
Introduction and useful linksRootWikipedia, users-guide (5.26), Reference Guide, HowTo's, Tutorials, Root Talk, user forums. RootROOT is an object-oriented program and library developed by CERN for the visualization and data processing. It provides containers for data analysis. |
Navigating Root
• CINT/ROOT C/C++ Interpreter
• TBrowser
Starting Root
• CINT/ROOT C/C++ Interpreter:
>root --help
Usage: root [-l] [-b] [-n] [-q] [dir] [[file:]data.root] [file1.C ... fileN.C]
Options:
  -b : run in batch mode without graphics
  -n : do not execute logon and logoff macros as specified in .rootrc
  -q : exit after processing command line macro files
  -l : do not show splash screen
 dir : if dir is a valid directory cd to it before executing

  -?      : print usage
  -h      : print usage
  --help  : print usage
  -config : print ./configure options
Step Up Corner:
• Examples how to call a root macro from the command line:
>root test.C
>root -lbq test.C\(4\)
>root -lb test.C\(8,15\)
>root -l test.C\(\"myfile.root\",2342\)
Compiling a root macro
• CINT/ROOT C/C++ Interpreter:
root -l
root [0] gSystem->CompileMacro("test_macro.C");
root [1] test()

root -l
root [0] gSystem->Load("test_macro_C.so"); // loading the shared library we
created earlier
root [1] test()
Using an ntuple or tree
• CINT/ROOT C/C++ Interpreter:
root -l
TFile *mfile = new TFile("filename.root");
TTree *tree = (TTree*)mfile->Get("ntuple");
tree->Draw("x");
• Generating a class based on your tree:
root -l
>TFile *mfile = new TFile("filename.root");
>TTree *tree = (TTree*)mfile->Get("ntuple");
>tree->MakeClass();
MakeClass will create a source and header file for your class based on the ntuple. This is definitely the way to go for more complicated data analysis.Step Up Corner:
• Examples using a tree:
>tree->AddFriend("Hits",mfile);

>tree->Draw("x","weight");
>tree->Draw("x-z","y","y>1623"); // (expression, weight, condition)
>tree->Draw("(x-z) > histogram","y","(y>4) && (z<8)"); // (expression, weight, condition)
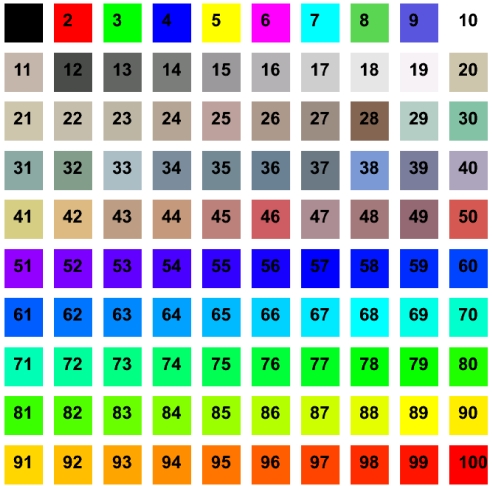
| Color and Markers: |  |
 |
Adding a legend and title to your plots
• Example of using a TLatex:
    /////////////////////////////
    ///     TLatex Title      ///
    /////////////////////////////

    char title[200];
    sprintf(title,"Average Number of Events");
    TLatex *tex1 = new TLatex(1,50,title);
    tex1->SetTextSize(0.055);
    tex1->SetTextColor(1);
    tex1->Draw("same");
• Example of using a TLegend:
   ////////////
   // Legend //
   ////////////

   char legend1[100];
   char legend2[100];
   char legend3[100];

   sprintf(legend1, "Simulation Background");
   sprintf(legend2, "Atmospheric Neutrino Simulation");
   sprintf(legend3, "Data");

   TLegend *le = new TLegend(.55, 0.76, .89, .90);
   le->AddEntry(h1_bkg ,legend1, "F");
   le->AddEntry(h1_sig ,legend2, "F");
   le->AddEntry(h1_data,legend3,"LP");

   le->SetFillColor(0);
   le->Draw("same");
How to scale your histogram correctly
• Example:
   ////////////////////////
   // resizing histogram //
   ////////////////////////

    float xmax = h1_sim->GetXaxis()->GetXmax();
    float xmin = h1_sim->GetXaxis()->GetXmin();
    float ymax = h1_sim->GetMaximum();
    float ymin = h1_sim->GetMinimum();
    if(h1_data->GetMaximum()         > ymax) ymax = h1_data->GetMaximum();
    if(h1_data->GetMinimum()         < ymin) ymin = h1_data->GetMinimum();
    if(ymin >0 ) ymin =0;

    ymax = (ymax+sqrt(ymax)) *1.2; // increase y axis maximum by sqrt of its value (simple stat error for error bad) and 20% to avoid the distribution being squeezed into the histogram and so that the error bars can show up

    h1_sim->GetYaxis()->SetRangeUser(0,ymax);

    printf("Yaxis [%f, %f]\n",ymin,ymax);

    // Redraw for clean plot //

    h1_sim->Draw();
    h1_data->Draw("same");
Example scripts:
• Please find examples here
pyroot
• Presentation from Jim on pyroot
• How to use the pyroot interpreter