2006 AMANDA Point Source Analysis
Event Selection
Methodology, Sensitivity & Discovery Potential
Unblinding Proposal
Results
Questions and Answers
 |
| NASA/ESA Hubble |
Unblinding Results
2005-2006 Combined Results
Full Sky Search
5433 events are shown (924 events >100o zenith) from the 2006 dataset.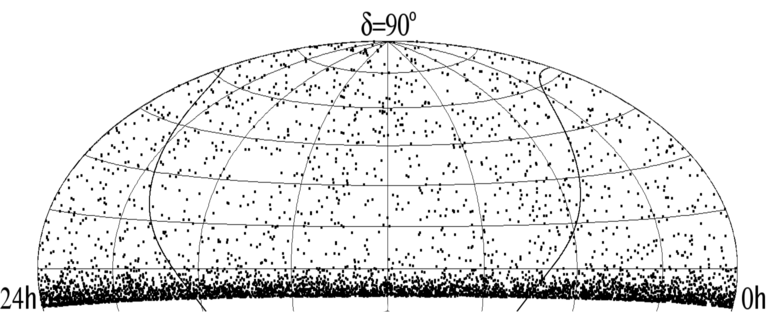
The likelihood ratio is evaluated on a 0.25ox0.25o grid ranging from -5o<δ<82.5o. At each point the significance is calculated, resulting in the following map:
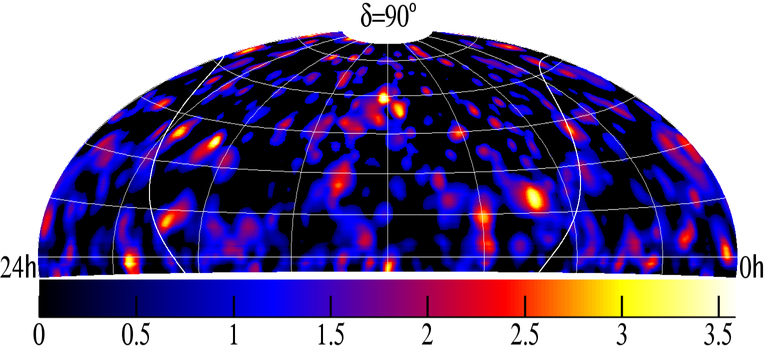
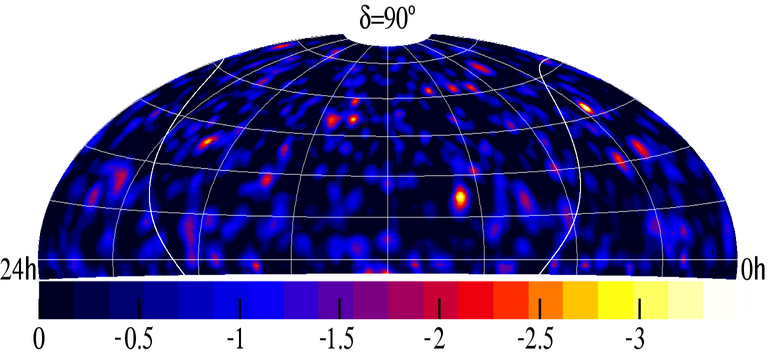
The maximum significance obtained is 3.58σ near 12.18h, +58.5o. Out of 100 sets of randomized data, 84 have a maximum significance equal to or greater than 3.58σ. The map from 2005 is shown below for comparison (in different units of log10(p-value); however, the hot spots can still be compared easily):
Search Based on a List of Candidate Sources
The method is applied to the locations of potential sources in the IC-9 point source catalog and the obtained limits (E2Φ < μ90*10-11 TeV cm-2s-1) and p-values (probability the result is due to background alone) are summarized in the table below.| Object | RAo | Zenitho | P-value | μ90 |
| MGRO J2019+37 | 304.830 | 126.83 | 0.064 | 20.53 |
| Cyg OB2 | 308.290 | 131.32 | 0.019 | 24.66 |
| Mrk 421 | 166.110 | 128.21 | 0.227 | 14.51 |
| Mrk 501 | 253.470 | 129.76 | 1.000 | 4.13 |
| 1ES 1959+650 | 300.000 | 155.15 | 1.000 | 4.98 |
| 1ES 2344+514 | 356.770 | 141.71 | 0.308 | 14.94 |
| H 1426+428 | 217.140 | 132.68 | 0.291 | 13.89 |
| BL Lac (QSO B2200+420) | 330.680 | 132.28 | 1.000 | 6.50 |
| 3C66A | 35.670 | 133.04 | 1.000 | 7.86 |
| 3C 454.3 | 343.490 | 106.15 | 0.291 | 13.56 |
| 4C 38.41 | 248.820 | 128.14 | 1.000 | 6.93 |
| PKS 0528+134 | 82.740 | 103.53 | 0.187 | 14.66 |
| 3C 273 | 187.280 | 92.05 | 0.230 | 14.88 |
| M87 | 187.710 | 102.39 | 0.450 | 9.59 |
| NGC 1275 (Perseus A) | 49.950 | 131.51 | 1.000 | 11.10 |
| Cyg A | 299.870 | 130.73 | 0.275 | 13.72 |
| SS 433 | 287.960 | 94.98 | 0.385 | 10.64 |
| Cyg X-3 | 308.110 | 130.96 | 0.012 | 25.70 |
| Cyg X-1 | 299.590 | 125.20 | 1.000 | 4.23 |
| LS I +61 303 | 40.130 | 151.23 | 1.000 | 10.03 |
| GRS 1915+105 | 288.800 | 100.95 | 0.005 | 26.72 |
| XTE J1118+480 | 169.550 | 138.04 | 1.000 | 9.63 |
| GRO J0422+32 | 65.430 | 122.91 | 0.409 | 12.20 |
| Geminga | 98.480 | 107.77 | 0.286 | 14.01 |
| Crab Nebula | 83.630 | 112.01 | 0.456 | 10.41 |
| Cas A | 350.850 | 148.82 | 1.000 | 6.94 |
The probability of reaching p = 0.005 in at least one of the 26 trials is 0.12. The probability of reaching p = 0.01 in at least one trial is 0.23.