
John Kelley, UW Madison, 22 August 2008
DOM-Cal's first step in the calibration procedure is to calibrate the SPE and MPE discriminators. This is achieved using the front-end (FE) electronic pulser to inject signals of known charge into the discriminator path. The procedure is as follows:
The primary assumptions made in this calibration are that:
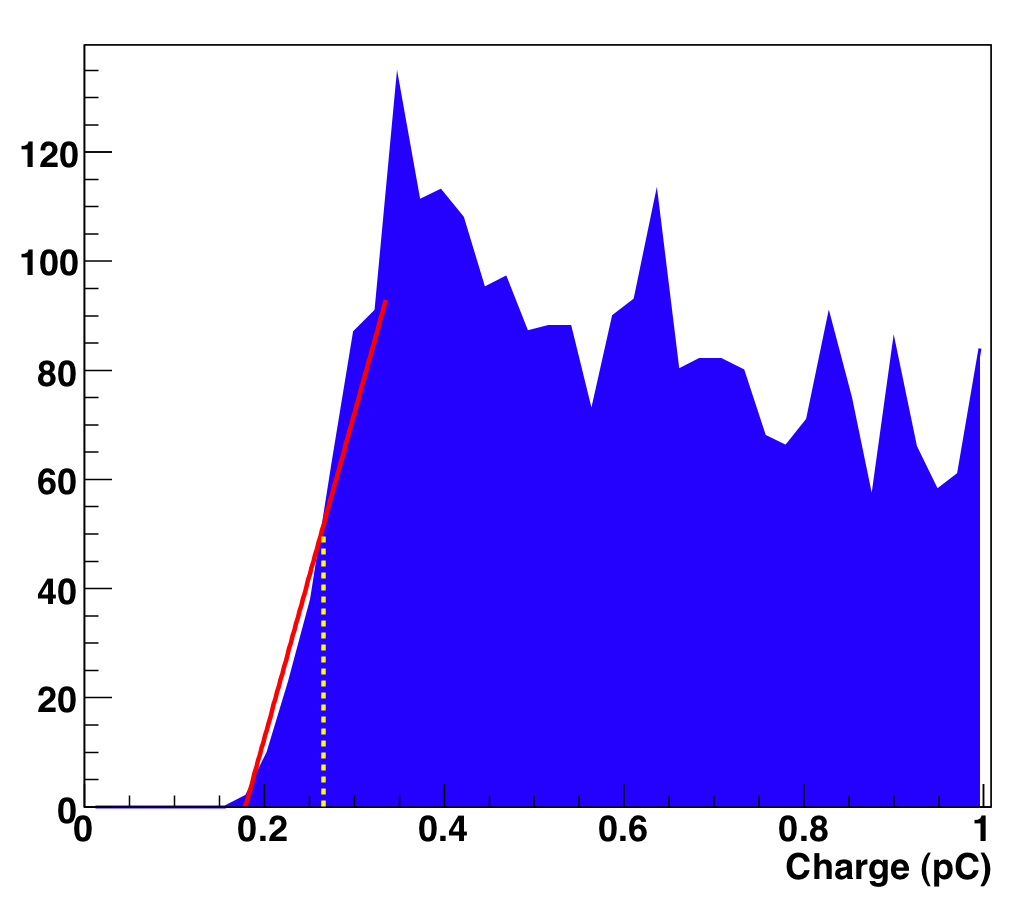
We can check the calibration by mining the DOM-Cal results themselves, as we store charge histograms at known discriminator settings that are gathered during the HV/gain calibration. The cutoff in the charge histogram from the discriminator setting will roughly be a sigmoid determined by the spread of charges from pulses of a given amplitude. This edge can be fit linearly and the midpoint extracted to approximate the threshold.
|
|
Figure 1: Left: Sample charge histogram collected by DOM-Cal. Right:fitting the discriminator cutoff.
This procedure is not without its flaws and is not very accurate. However, we have a huge number of histograms collected (over 30K), so barring any systematic effects, we should be able to see if the actual operating thresholds are close to the values supplied by the calibration.
When extracting the thresholds from the charge data, we find that the procedure is most reliable at higher gains. This is probably because we record less of the exponential noise peak because of the discriminator settings we are using. Figure 2 shows the ratio of actual operating charge threshold vs. expected charge threshold:
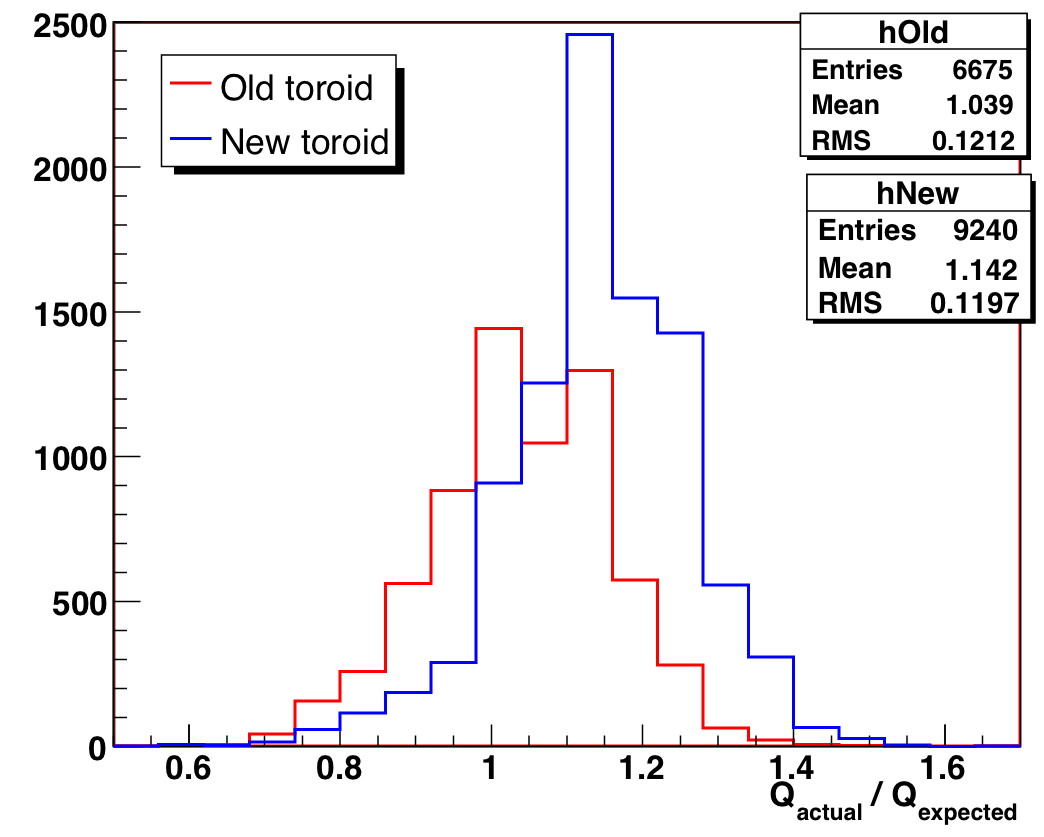
Figure 2: Ratio of actual to expected threshold for charge histograms with log
gain > 7.5.
Data points are separated by toroid type.
The distribution clearly separates by toroid type. The median ratio for the old toroid type is 1.05, indicating that the discriminator calibration is probably working correctly for these DOMs in this gain and threshold range. The median ratio for the new toroid type is 1.15, which is not coincidentally the ratio of impedances (50/43 = 1.16) for new and old toroid types. This clearly indicates that the pulser relationship used in the calibration (which was determined only for an old toroid DOM) is wrong for the new toroids.
It is possible that the results above do not hold for fractional-PE pulses at lower gains (closer to the operating gain of 10^7), because the pulse shape may change. Indeed, we do see a shift to higher threshold ratios when limiting ourselves to these charge data:
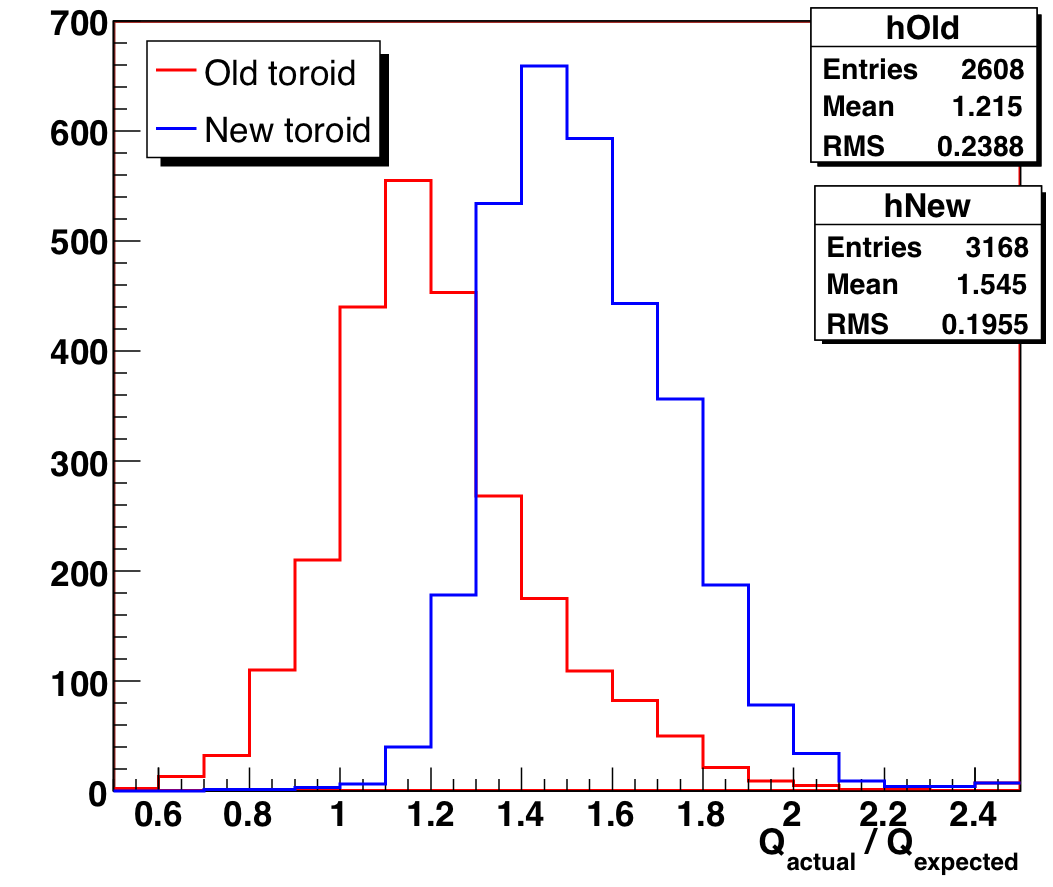
Figure 3: Ratio of actual to expected threshold for charge histograms with 6.8
< log gain < 7.2.
Data points are separated by toroid type.
Here the median of the old toroid DOMs is 1.18, and the median of the new toroid DOMs is 1.52. There are long tails to both distributions though, indicating the weakness of this method. Still, we have a clear separation with toroid type, and the separation is larger than at higher gain.
Based on this study, we are not convinced that the discriminator calibration needs to be reconceived — however, it is obvious that we need to update the pulser-to-charge relationship for the new toroid DOMs.