John Kelley, UW-Madison, May 2005
![]()
1. What about point sources in the galactic plane? How do those affect this analysis, and why don't you consider them?
This analysis is concerned with detecting or setting a limit on the diffuse flux from the plane. Because of the generation mechanism (cosmic ray interactions with the interstellar material), this flux is guaranteed at some level. While there are almost certainly some galactic point sources in the plane, selecting the candidate sources and modelling the emission becomes a different problem and a different analysis.
Technically, the limit we set on the flux from the plane is a limit on the sum of the diffuse emission plus the galactic point sources (plus any extragalactic sources, etc.). But this can also be considered a conservative limit on the diffuse emission from the plane, which is what we do.
2. Why do you estimate sensitivity to other hypotheses, instead of resimulating the signal Monte Carlo?
Partially, this is for convenience. Although I have thought about expanding the reweighting technique to a two-dimensional distribution, it's not a simple problem. There are also technical issues about how the reweighting program operates that would require a different approach to the event sampling.
However, the estimation approach does have the benefit of flexibility — I can easily change, say, the width of the Gaussian signal without having to reweight or resimulate from scratch (although it's important not to do this after unblinding). And I believe the approximations that go into the procedure are valid enough to make the result nearly identical to what I would get if I resimulated from scratch.
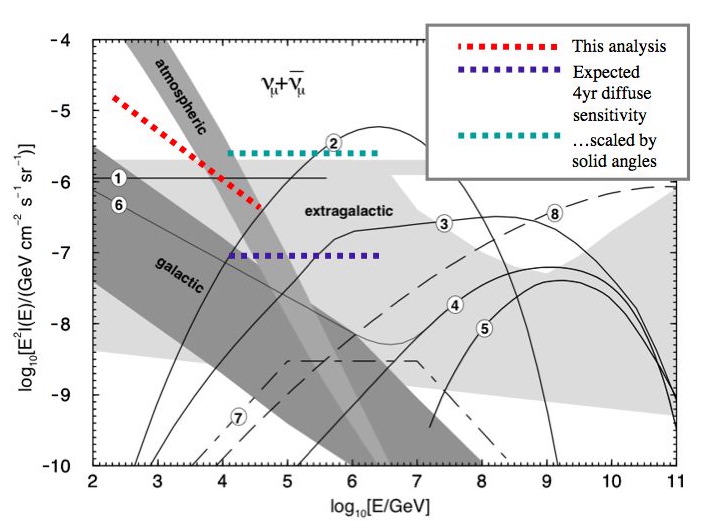
3. On your sensitivity plot (figure 4.4), how can the low-energy tail of the sensitivity line be so far below the atmospheric background level?
Essentially it's because the energy response function of the detector and the analysis must be taken into account when interpreting this plot. The peak of the response to the signal is at approximately 3 TeV, so it's most instructive to compare the atmospheric level with the signal sensitivity at this point. And indeed, this is approximately where the sensitivity line crosses into the atmospheric band.
4. In figure 4.4, why is it acceptable to plot your sensitivity on the standard Learned & Mannheim plot, when it's only valid in a small angular region around the galactic equator?
I'm following Learned & Mannheim's precedent here. Each level of flux in the band of predictions for galactic neutrinos they present in their plot (derived from the Ingelmann & Thunman model) is only valid for a particular galactic latitude and longitude. I want to compare my sensitivity to this model, which is why I use the Learned & Mannheim figure in the first place, but I feel it's important be clear what region I'm claiming to be sensitive in.
5. The stacked source analysis at Dortmund has an unusual deficit of on-source events, which might indicate a problem in the background estimation, such as a non-uniformity in the right ascension. What is the plan for dealing with this?
Elisa Bernadini and others at Zeuthen have looked at the right ascension distribution of the (unscrambled) 2000-03 point source data sample and do not immediately see anything that could cause this effect. Furthermore, they have undertaken a number of toy Monte Carlo studies to explore other hypotheses, and nothing has emerged that results in a deficit large enough.
Until a viable hypothesis does emerge, my current assumption is that the deficit is due to statistics. If a concrete phenomenon does emerge in the data, the background will be re-estimated if possible, but the cuts will not be changed. This is recorded in the unblinding procedure in section 6.
6. How can we interpret these limits in the context of existing AMANDA-II diffuse limits?
Perhaps another way to phrase this question is, "why are those numbers so big?" The first thing to remember is that because the spectrum is steeper than E^{-2}, the number presented as the limit is the value at 1 GeV, and the spectrum will drop off at higher energies on an E^2 plot.
But it's still an excellent question, because one can use a diffuse limit to set a limit on the flux from the galactic plane (of an E^{-2} spectrum, anyway). The main disadvantage to this method is that because the diffuse analysis detects an average flux across a hemisphere, you will need a correspondingly higher flux from the relatively small plane region to detect it with a 2pi search. Another way of saying this is that one needs to scale the average diffuse limit up by the inverse fraction of the hemisphere (2pi sr) covered by the relatively small plane region (0.22 sr for +/- 2 degrees), a factor of 28.5.

Figure 5.1: Comparison of this limit versus the expected 4-year diffuse sensitivity,
and the 4-year sensitivity scaled up by the inverse fraction of the sky covered
by the plane region.
To make a rigorous comparison is difficult since in reality, the results are model-dependent, but this does show the advantage of restricting the analysis to the region around the equator.