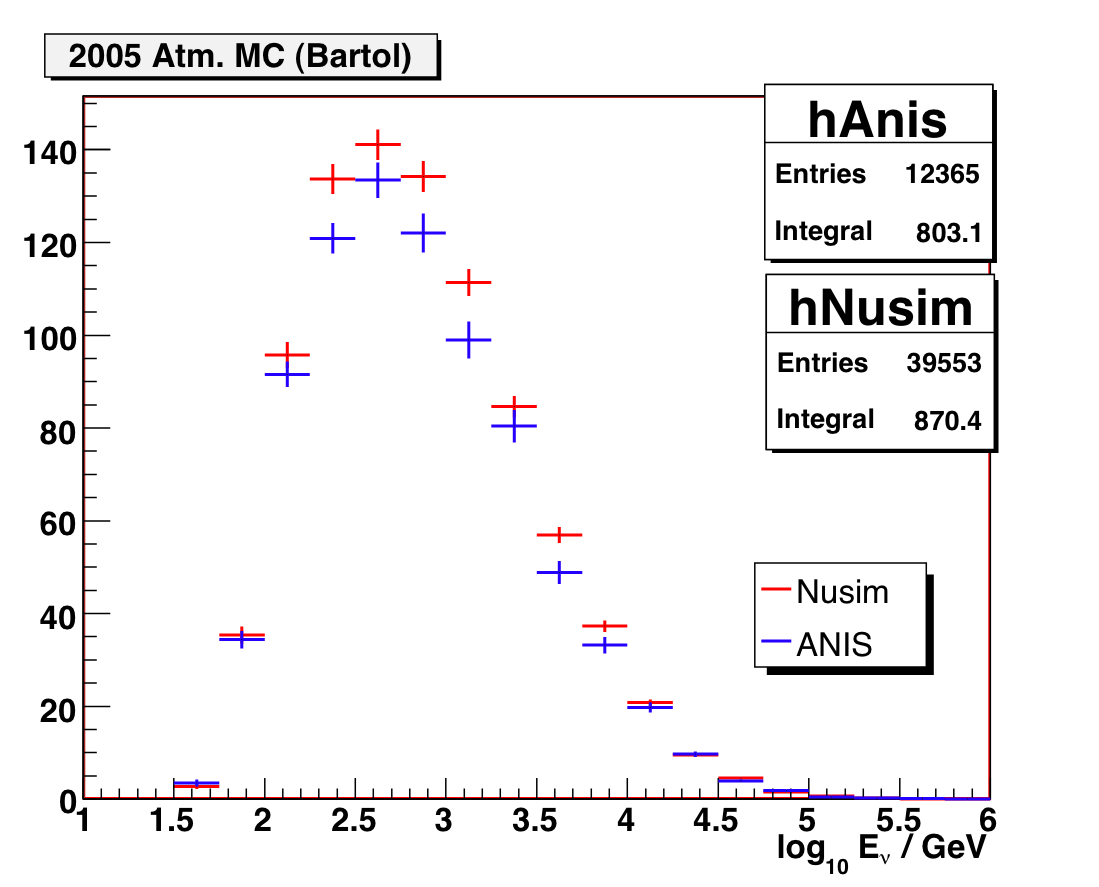
Figure1: Neutrino energy at final cut level for ANIS and Nusim.
John Kelley, UW-Madison, March 2008
I have performed a preliminary comparison of atmospheric muon neutrino flux differences as simulated by ANIS and nusim. The input flux is the Barr et al. ("Bartol") prediction, as implemented in the NeutrinoFlux class. The simulation parameters are as follows:
Both:
ANIS-specific settings:
nusim-specific settings:
The number of events and their energy distribution was found to be similar at the final cut level. Specifically:
Here are a few comparison plots:

Figure1: Neutrino energy at final cut level for ANIS and Nusim.
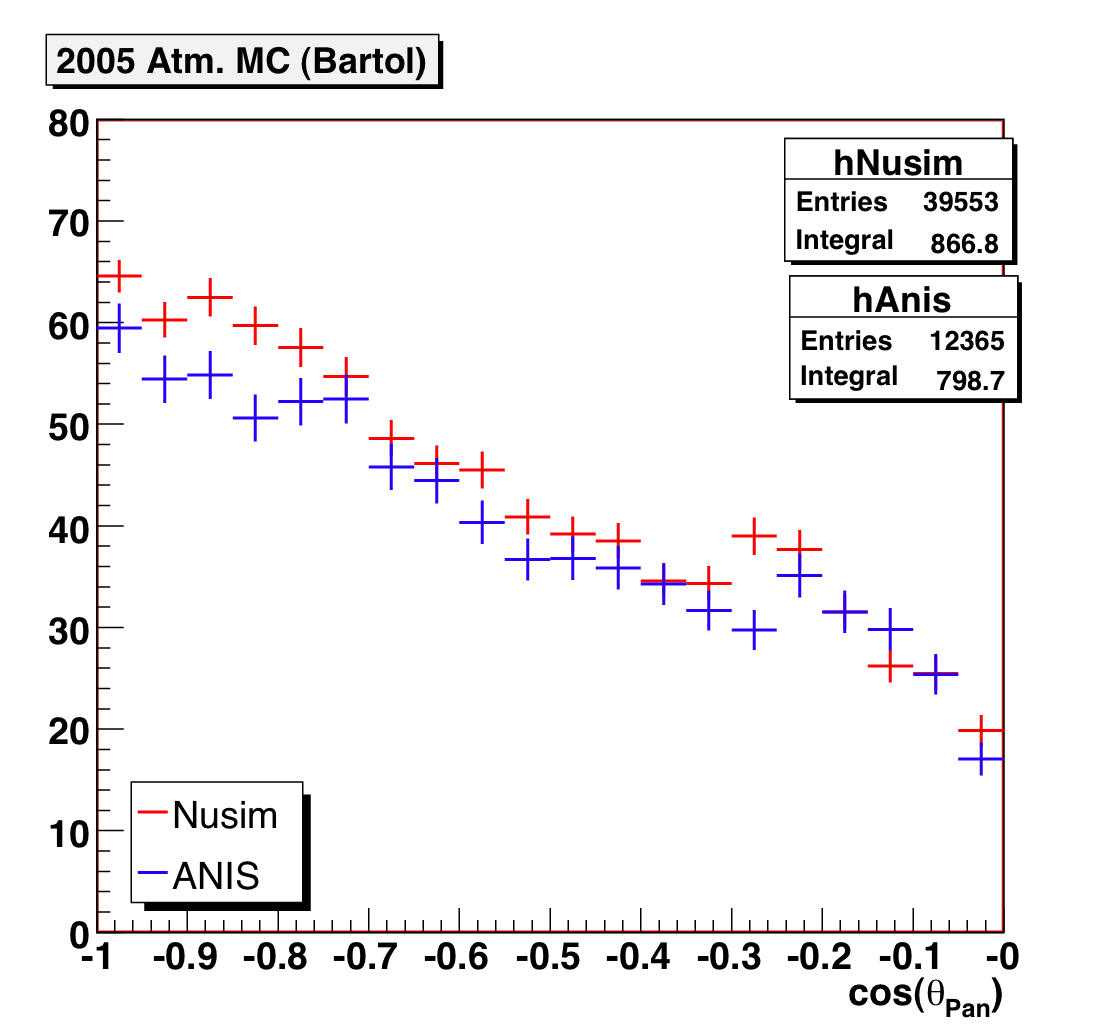
Figure 2: Reconstructed zenith angle for ANIS and nusim.
The left edge is vertical events, right is horizontal.
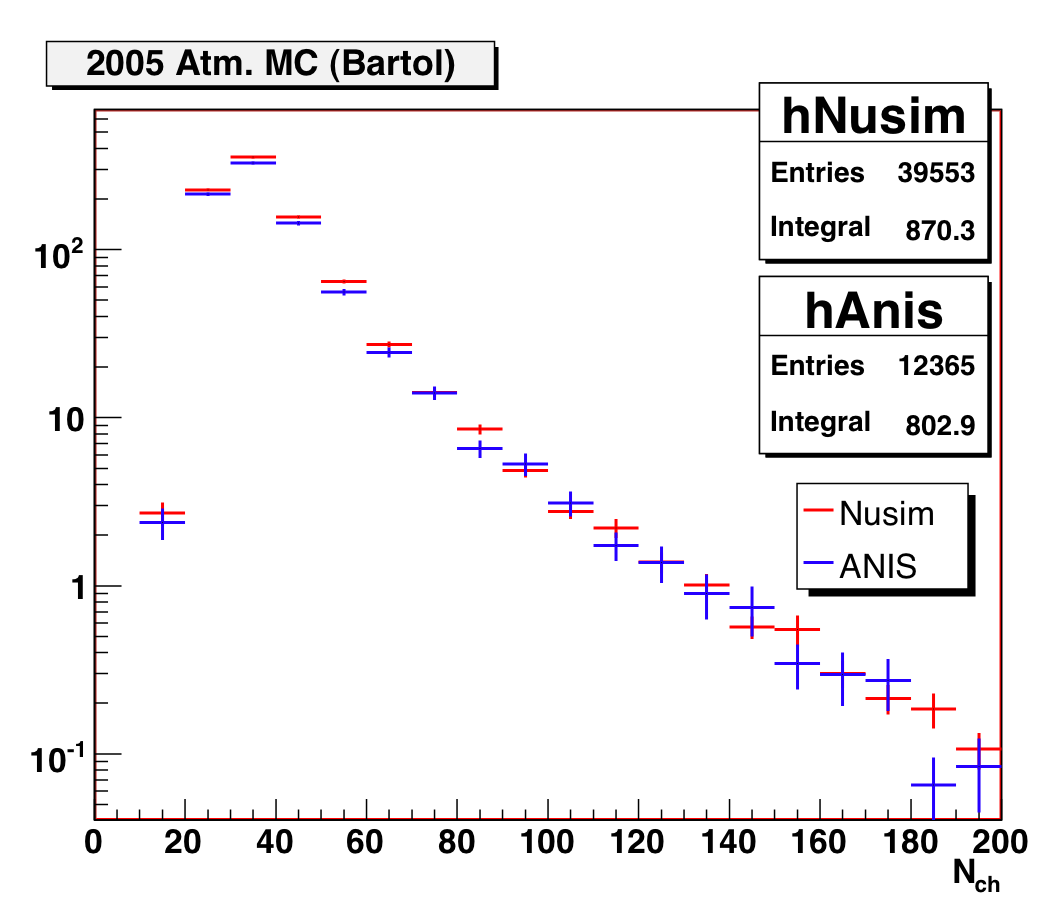
Figure 3: Number of channels hit for ANIS and nusim.
The E^{-2} spectra are also very similar, with 7% fewer events in ANIS, and similar median energies (55 TeV in ANIS vs. 52 TeV in nusim):
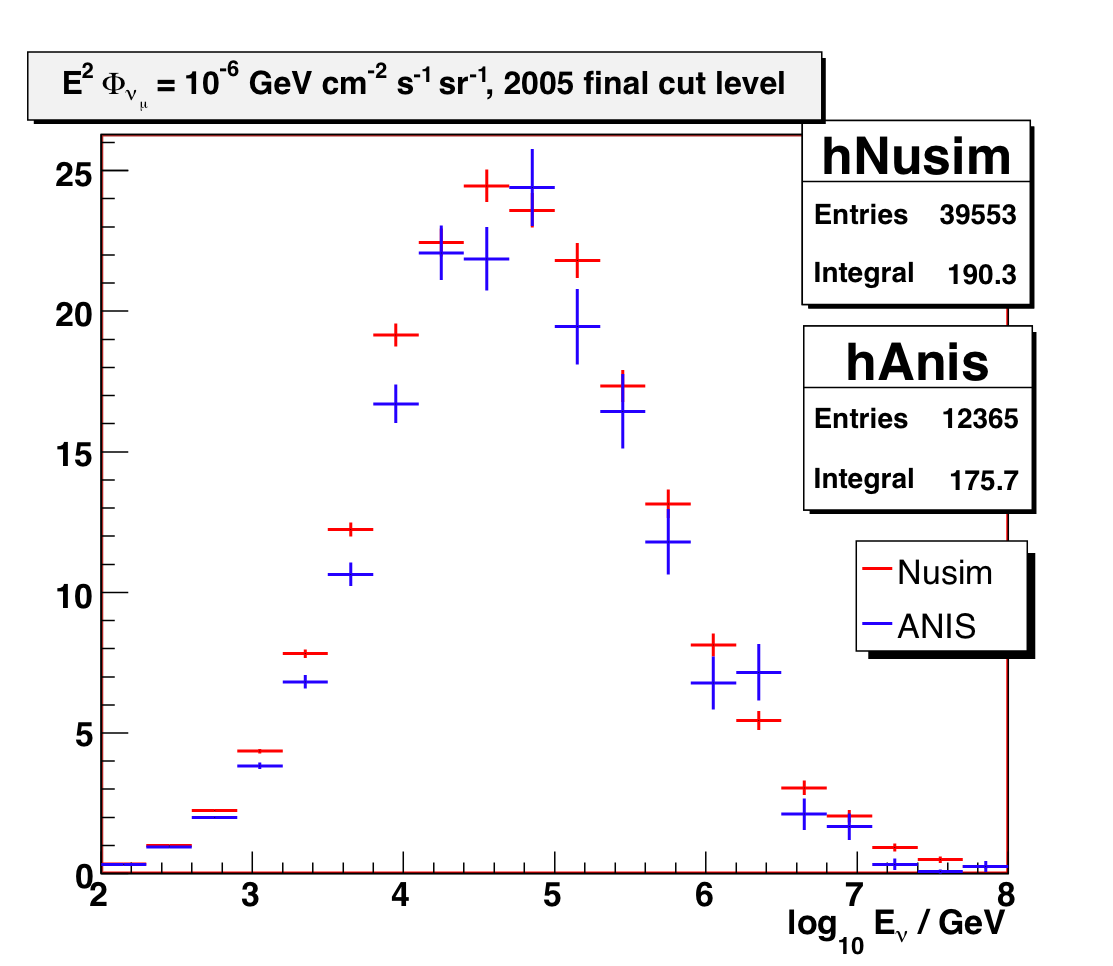
Figure 4: Energy spectra of ANIS vs. nusim for an E^-2 spectrum (final cut level).
Some of the difference in simulation methodology can be seen via the interaction probability difference. The following plot shows the distribution of event interaction probability weights as a function of energy (Si1 in ANIS, Intwght in nusim):
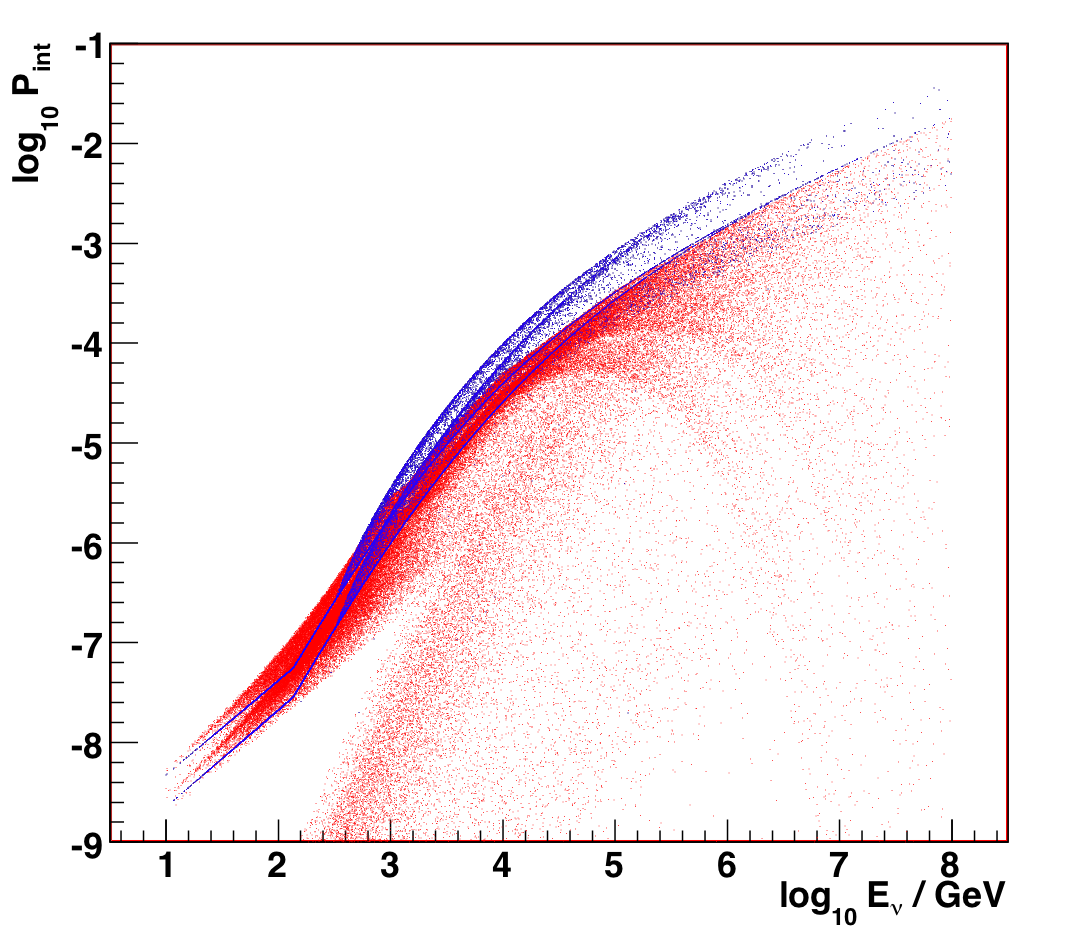
Figure 4: Interaction probability vs. neutrino energy for ANIS (blue)
and nusim (red) at L3.
Understanding this plot requires some explanation. First, there are two distinct bands for neutrinos and antineutrinos. Second, NC interactions along the way through Earth (followed by CC interactions at lower energy) cause the faint low-probability band in nusim (not sure if this is simulated in ANIS). Third, the rolloff at high energies due to Earth absorption is seen in nusim (different roll-offs for different zenith angles), whereas ANIS simply does not output these events.
The difference in the slope in the ANIS interaction plot is because of the energy-dependent interaction volume (scales with muon range).
Any differences do not seem to be coming from the underlying cross sections (CTEQ5 in anis vs. MRSG (1996) in nusim), which are comparable in this energy range:
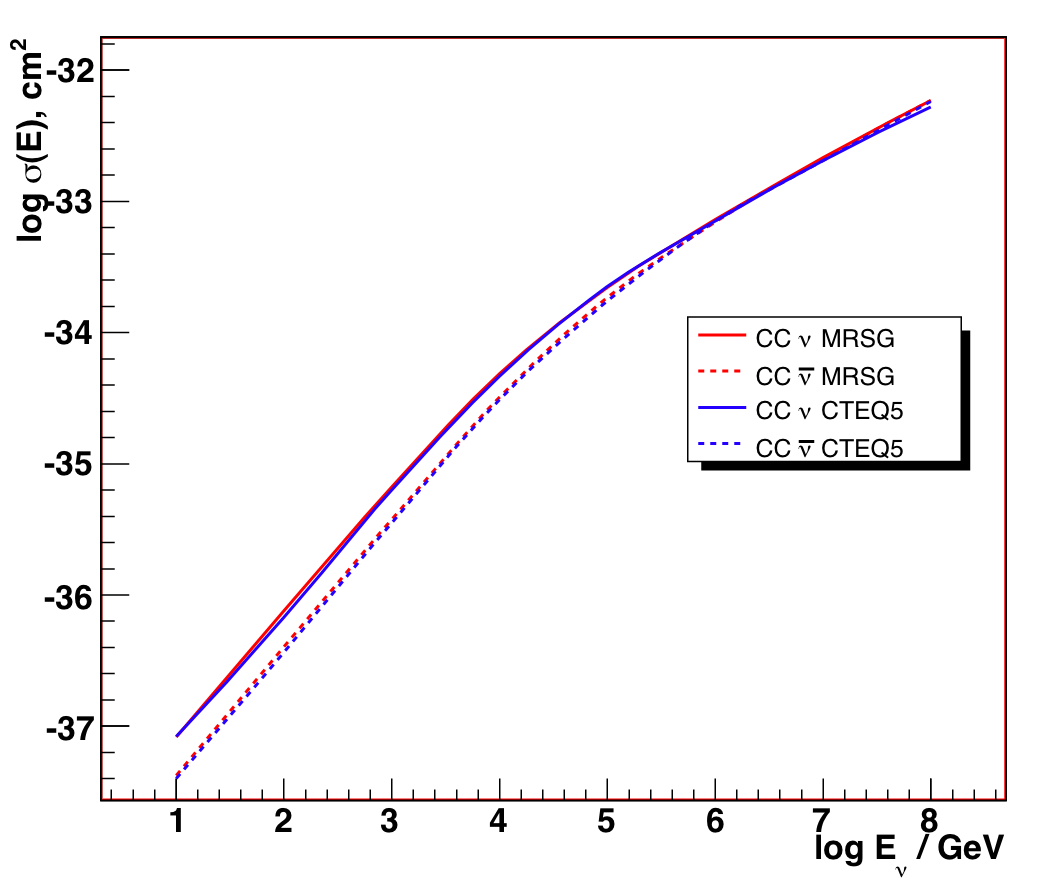
Figure 5: Cross sections in anis and nusim vs. energy.