T Coronae Borealis Lightcurves
Page and code by Jessie Thwaites, Sam Hori, Amos Ongondi, and Justin Vandenbroucke. With comments or questions, please contact jthwaites@icecube.wisc.edu and justin.vandenbroucke@wisc.edu.
This webpage is for monitoring T Coronae Borealis, in anticipation of its upcoming eruption. The time the plots were last updated is shown in the title (automatically updated at 9AM US-Central time).
Data Sources
Gamma-ray data: T CrB has been added to the LAT monitored source list (GCN
35271) and now has daily lightcurve data available
here. Data for these plots is downloaded directly from
this link.
X-ray data: T CrB is on the Swift-BAT hard X-ray
monitored sources list. Daily lightcurves can be found
here, and its
read me here. The paper
Krimm et al., 2013, ApJSS 209,14 describes the BAT Transient Monitor in detail.
28 May 2026 NOTE: Swift has suspended science operations to prioritise its orbital lifetime. The Swift panel may be blank in the below plots for that reason. See
the Swift website for operations status details.
Optical data: T CrB is one of the longest and best monitored optical sources. Data for these plots is downloaded directly from the AAVSO International Database using
this form. For this, we select observations in the V and B bands. See Kloppenborg, B. K., 2023, Observations from the AAVSO International Database,
https://www.aavso.org.
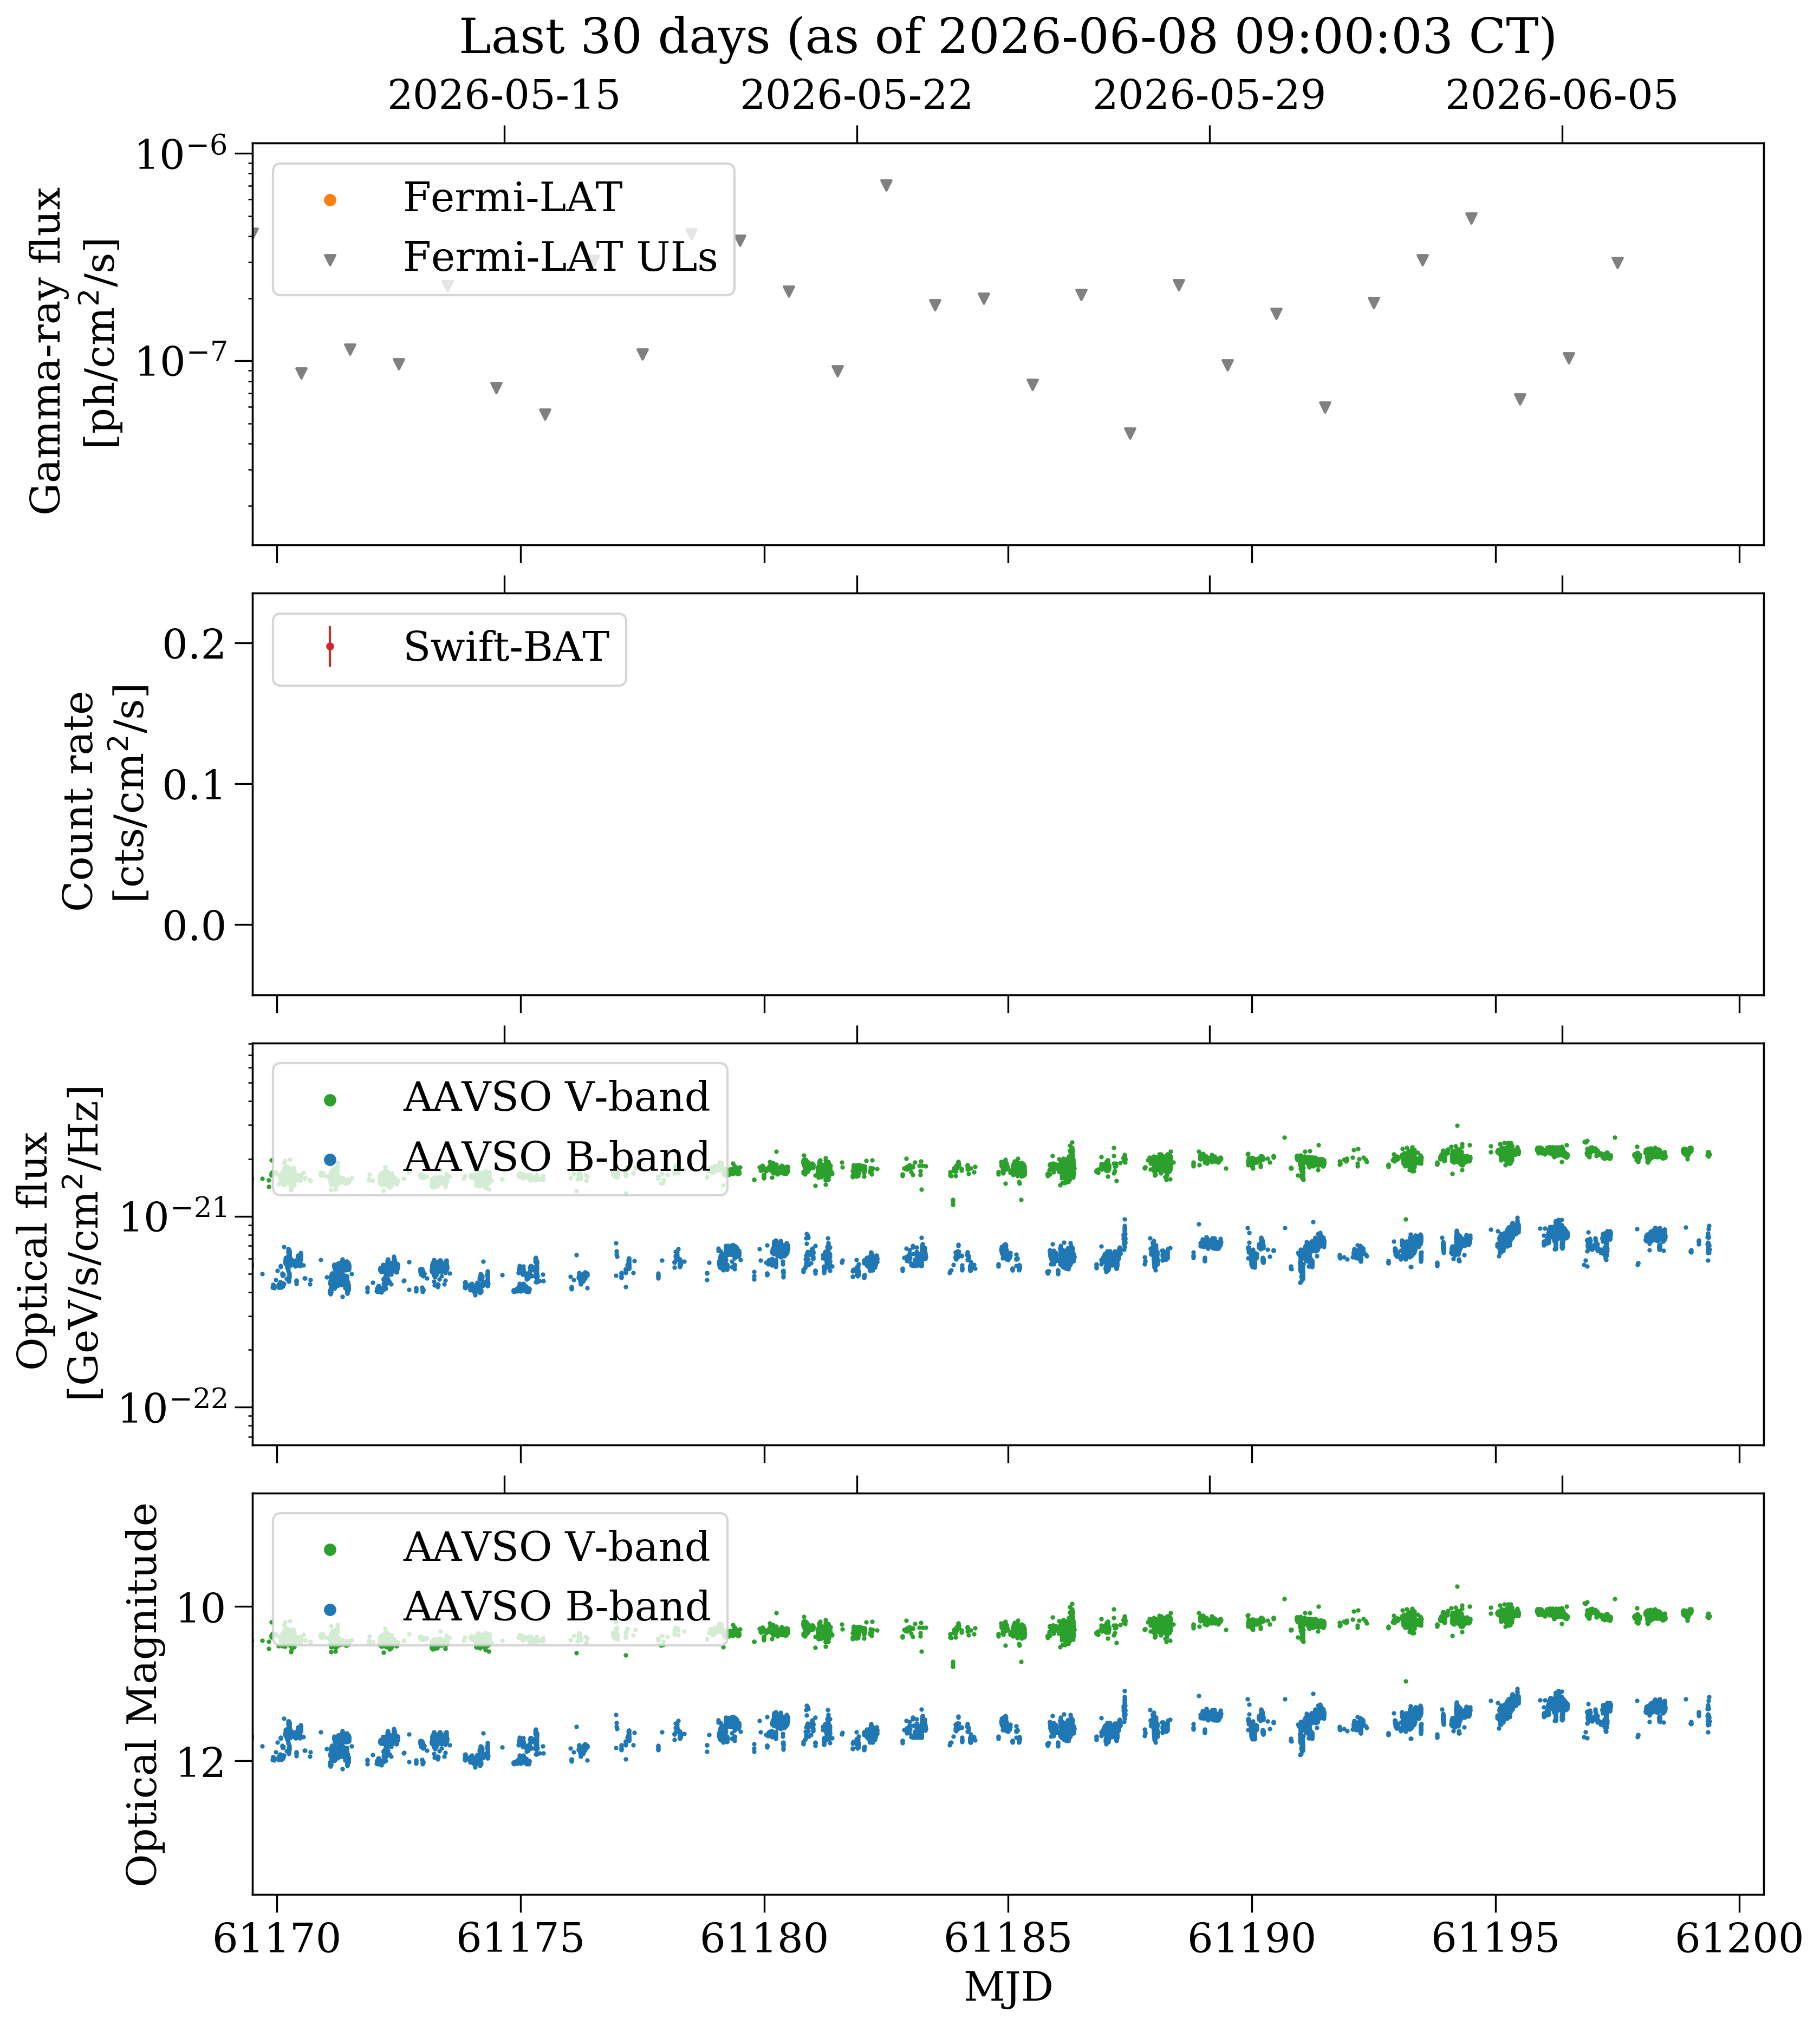
Most recent 30 days
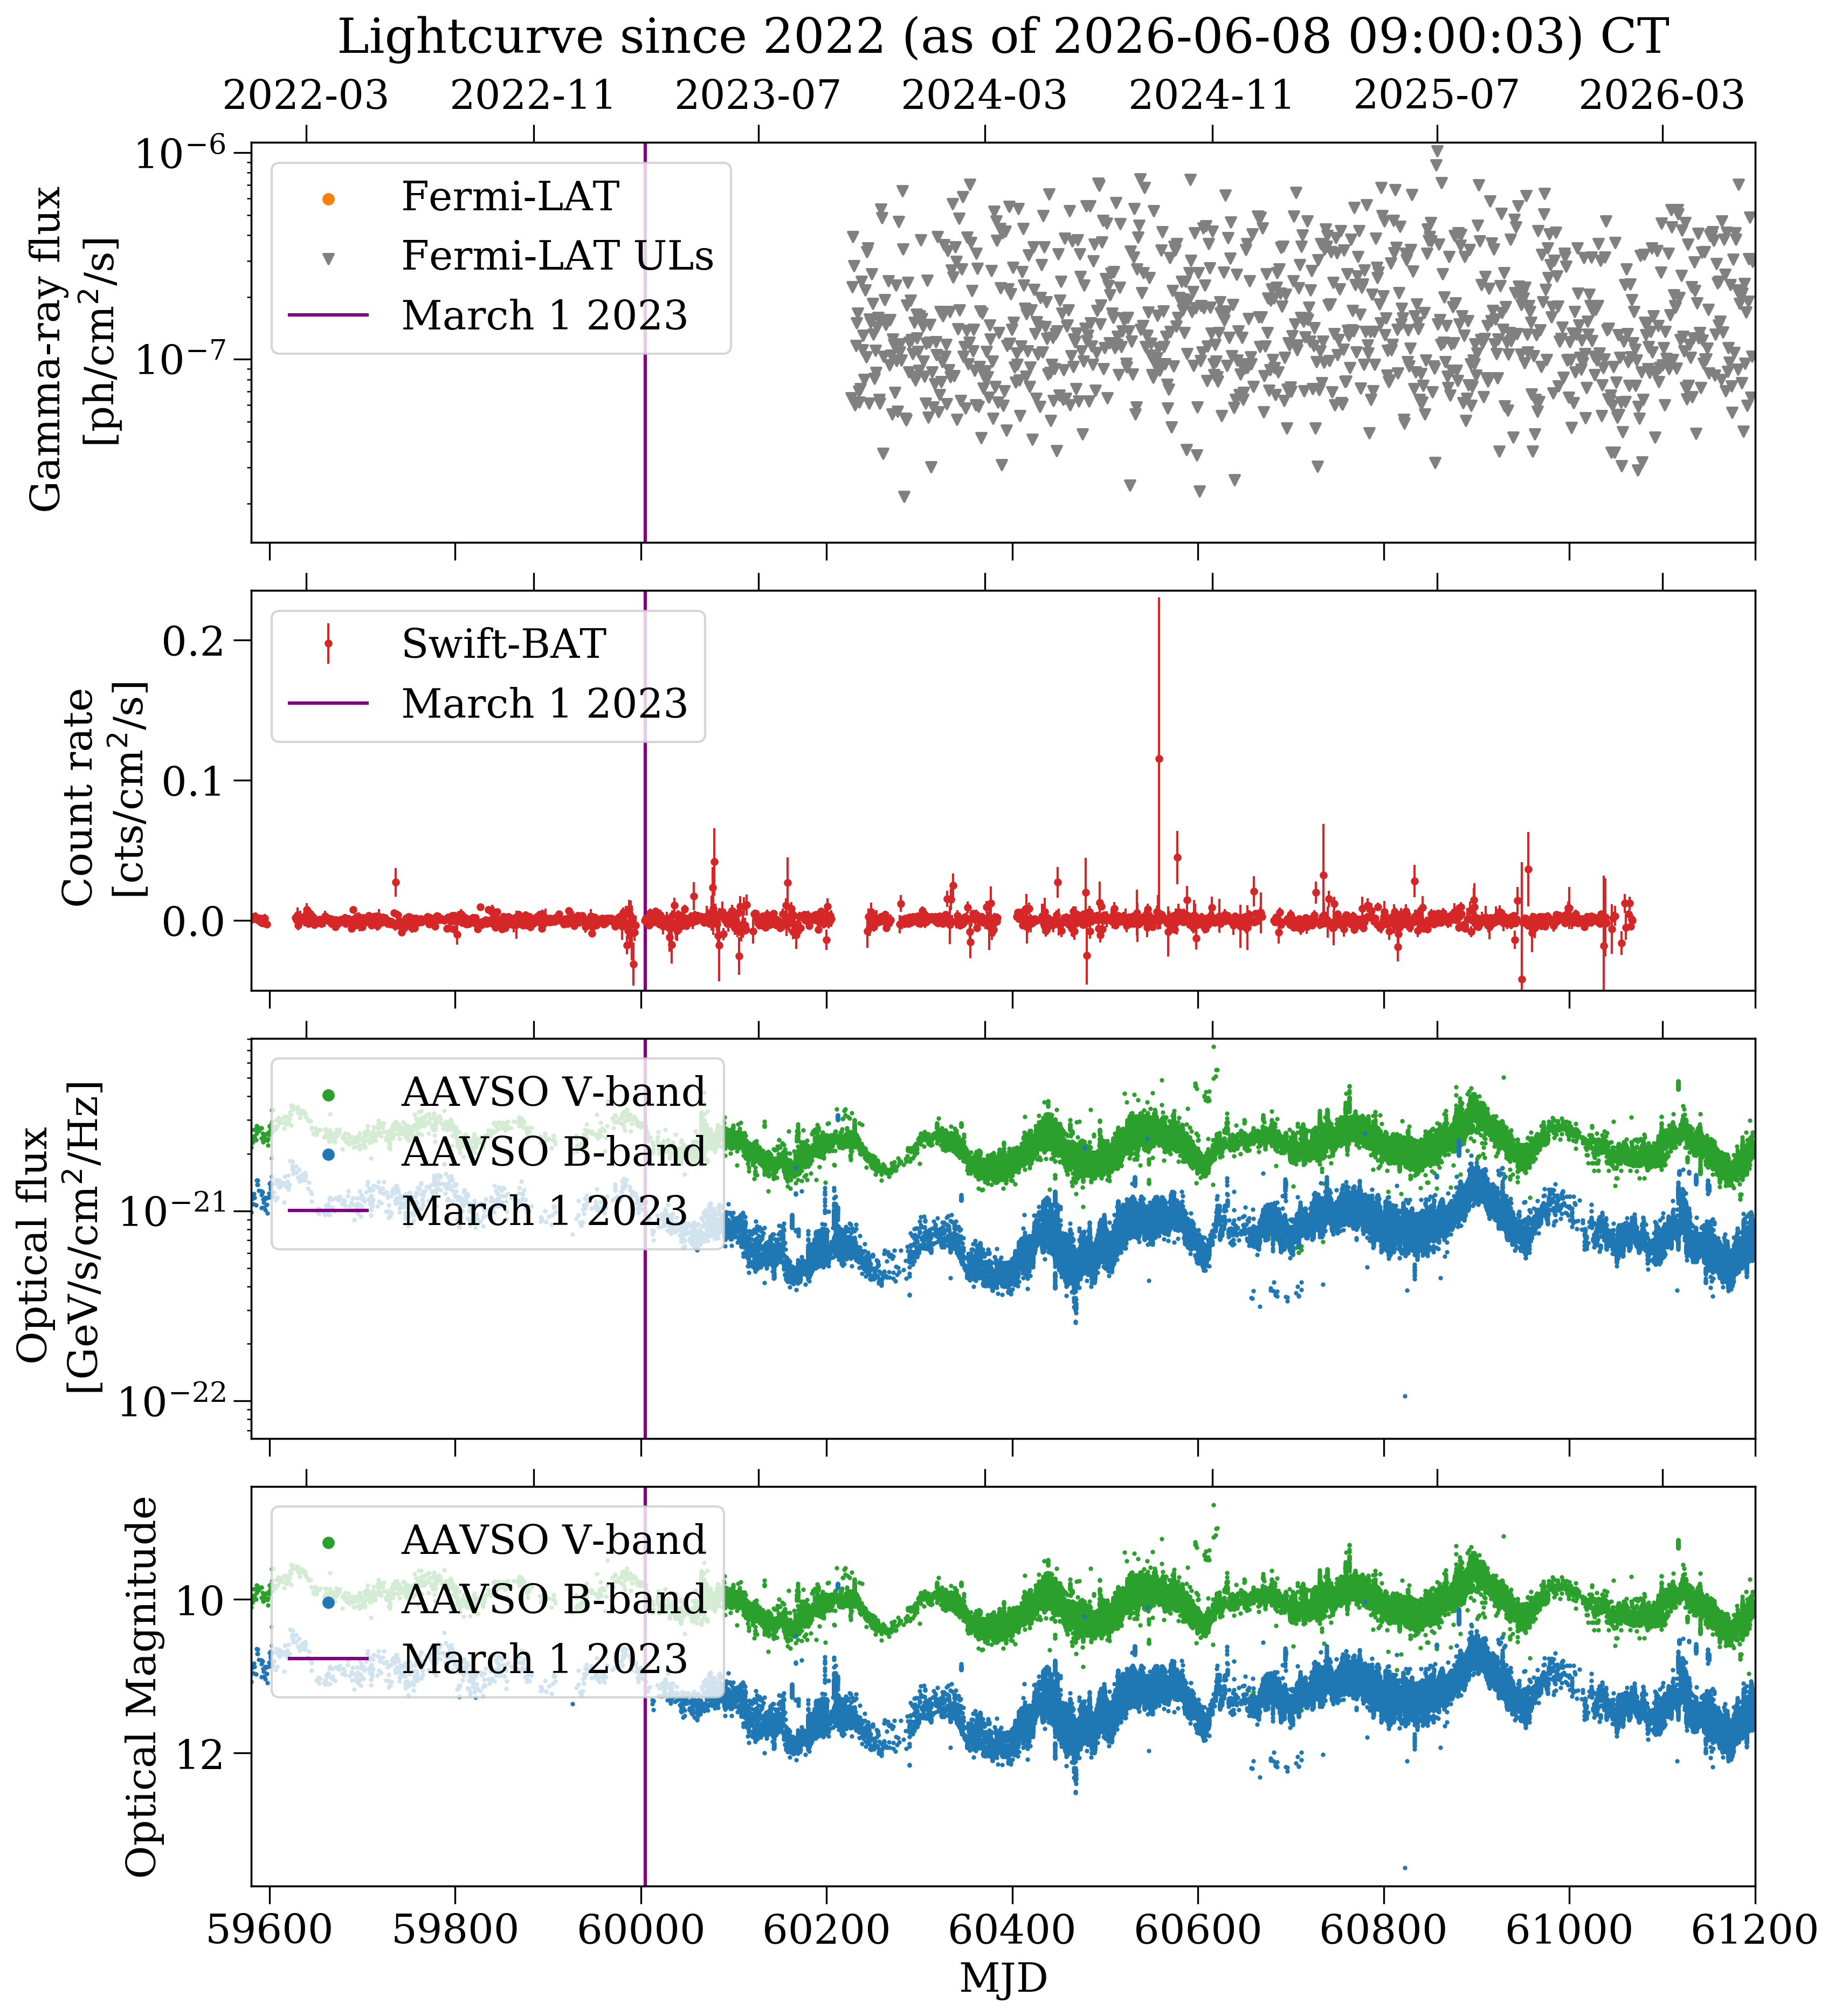
Since 2022
The reference time shown is March 2023, around the time when the dip began.
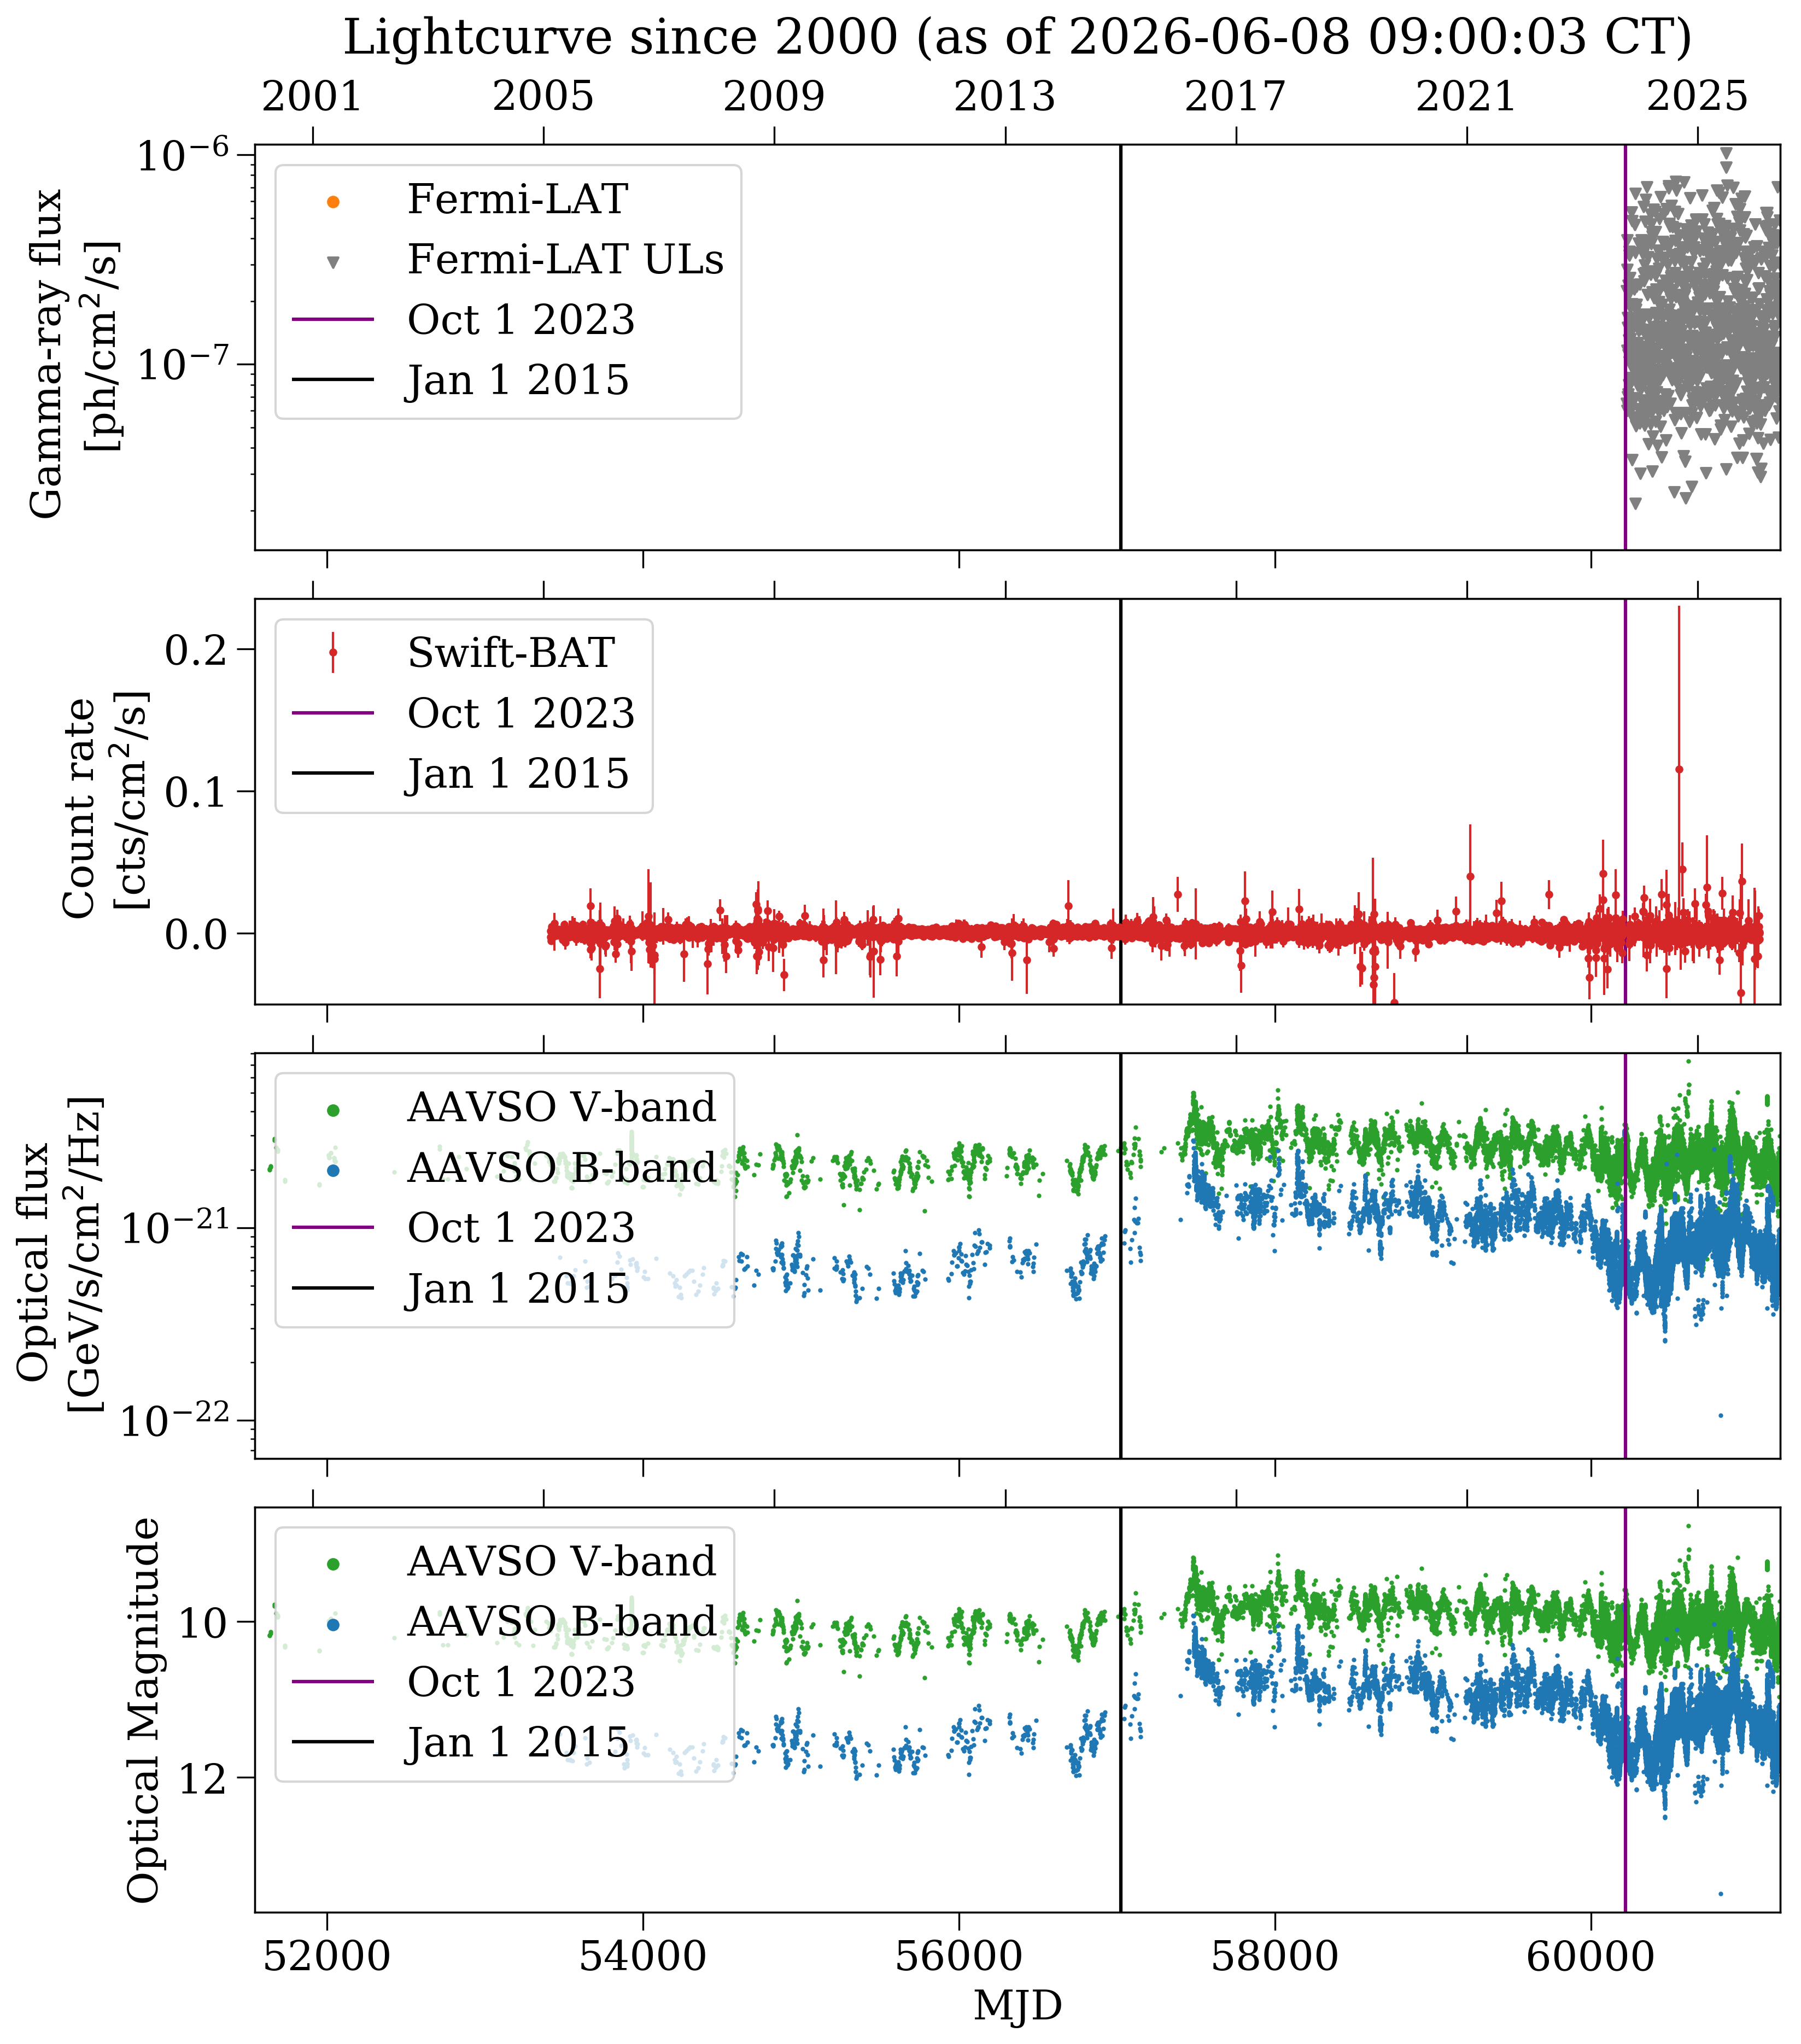
Since 2000
Reference times shown are for the start of 2015, the beginning of the approximately 9-year high period that precedes an eruption of this source, and October 2023, approximately when this source started being monitored by Fermi.