Code Structure
Most of data-related process can be opertrated by script_executor.py and sim-related process can be operated by sim_script_executor.py in MF_filters /scripts/ path.
For example, If user excute below commands for analyzing data at the scripts/ path:
source ../setup.sh
python3 script_executor.py -k sub_info -s 3 -r 11650 -b 1
script_executor.py will find actual raw ARA file path that corresponding to station ID 3 and run number 11650. Then, it will launch chunk_sub_info.py in MF_filters/tools/ path. chunk_sub_info.py will access various classes saved in ara~.py to process data and get analysis results.
Regarding the finding raw ARA file path based on staton ID and run number, User need to generate the file list by batch_run_maker.py and place it in data/run_list/. The list is made by get_dat_list() funciton. This function is only optimized to ARA 2 and 3. If user want to make a list of other stations by this function, probably good to debug it first. User also just ask scrtipt to find the path in real time by changing use_path_search to True. But it might take a long time to code to find the path.
In case of the analyzing simulated event, it will go through similar process:
source ../setup.sh
python3 sim_script_executor.py -k sub_info -s 3 -d  /data/ana/ARA/ARA03/sim_signal_full/AraOut.signal_E17_F2_A3_R7.txt.run8.root
In this time, sim_script_executor.py will launch chunk_sub_info_sim.py to deal with simulated event. chunk_sub_info_sim.py will construct almost same classes saved in ara~.py to process the data. The way to generate the simulated events will be discussed in next section.
ara~.py: store core classes that can be used in various data processchunk~(_sim).py: load necessary classes and apply into data to get analysis results.(sim_)script_executor.py: single master script that can control all thechunk~.pyscripts. It will find the data path based on inputs and save the results inhdf5format.
Fig. 3 is example what kind of process will be happen if user launch interferometry by (sim_)script_executor.py script.
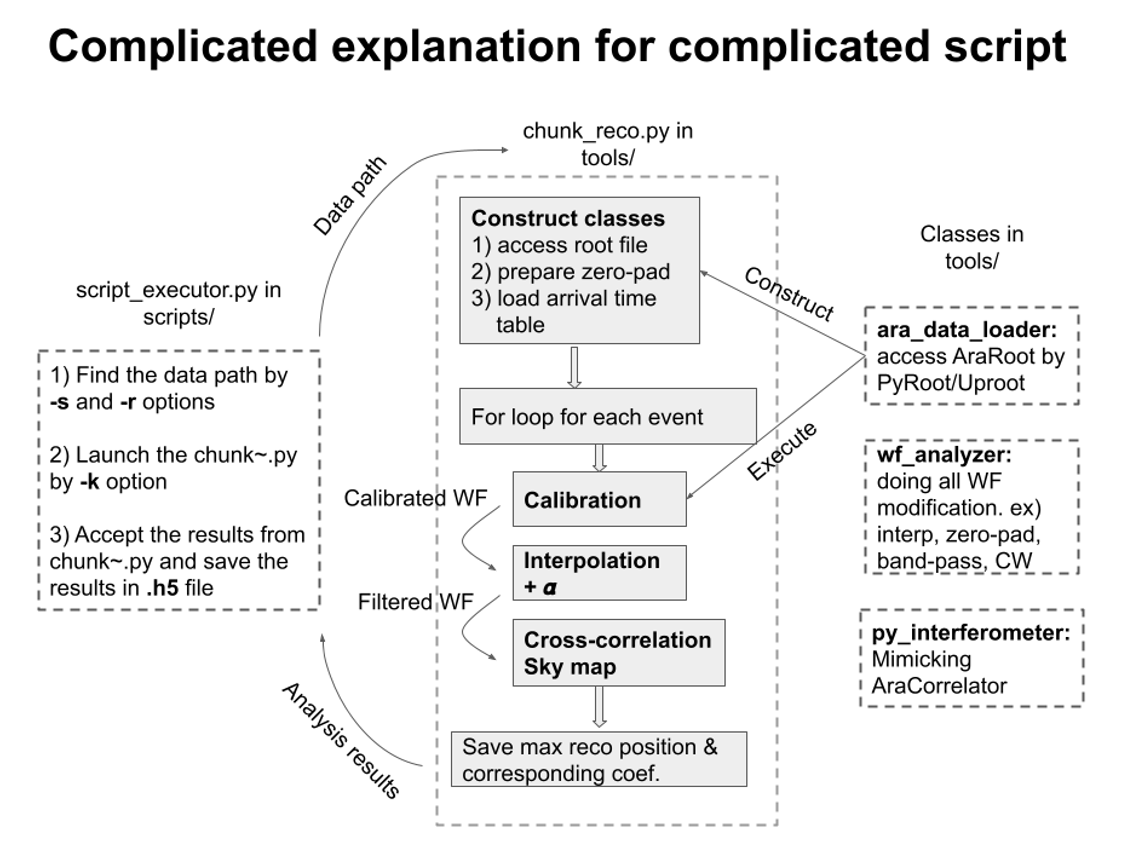
Fig. 3 Code structure whan user uses script_executor.py scripts
If everything goes well by running python3 script_executor.py -k sub_info -s 3 -r 11650 -b 1 command, User will see Fig. 4 and Fig. 5 from terminal
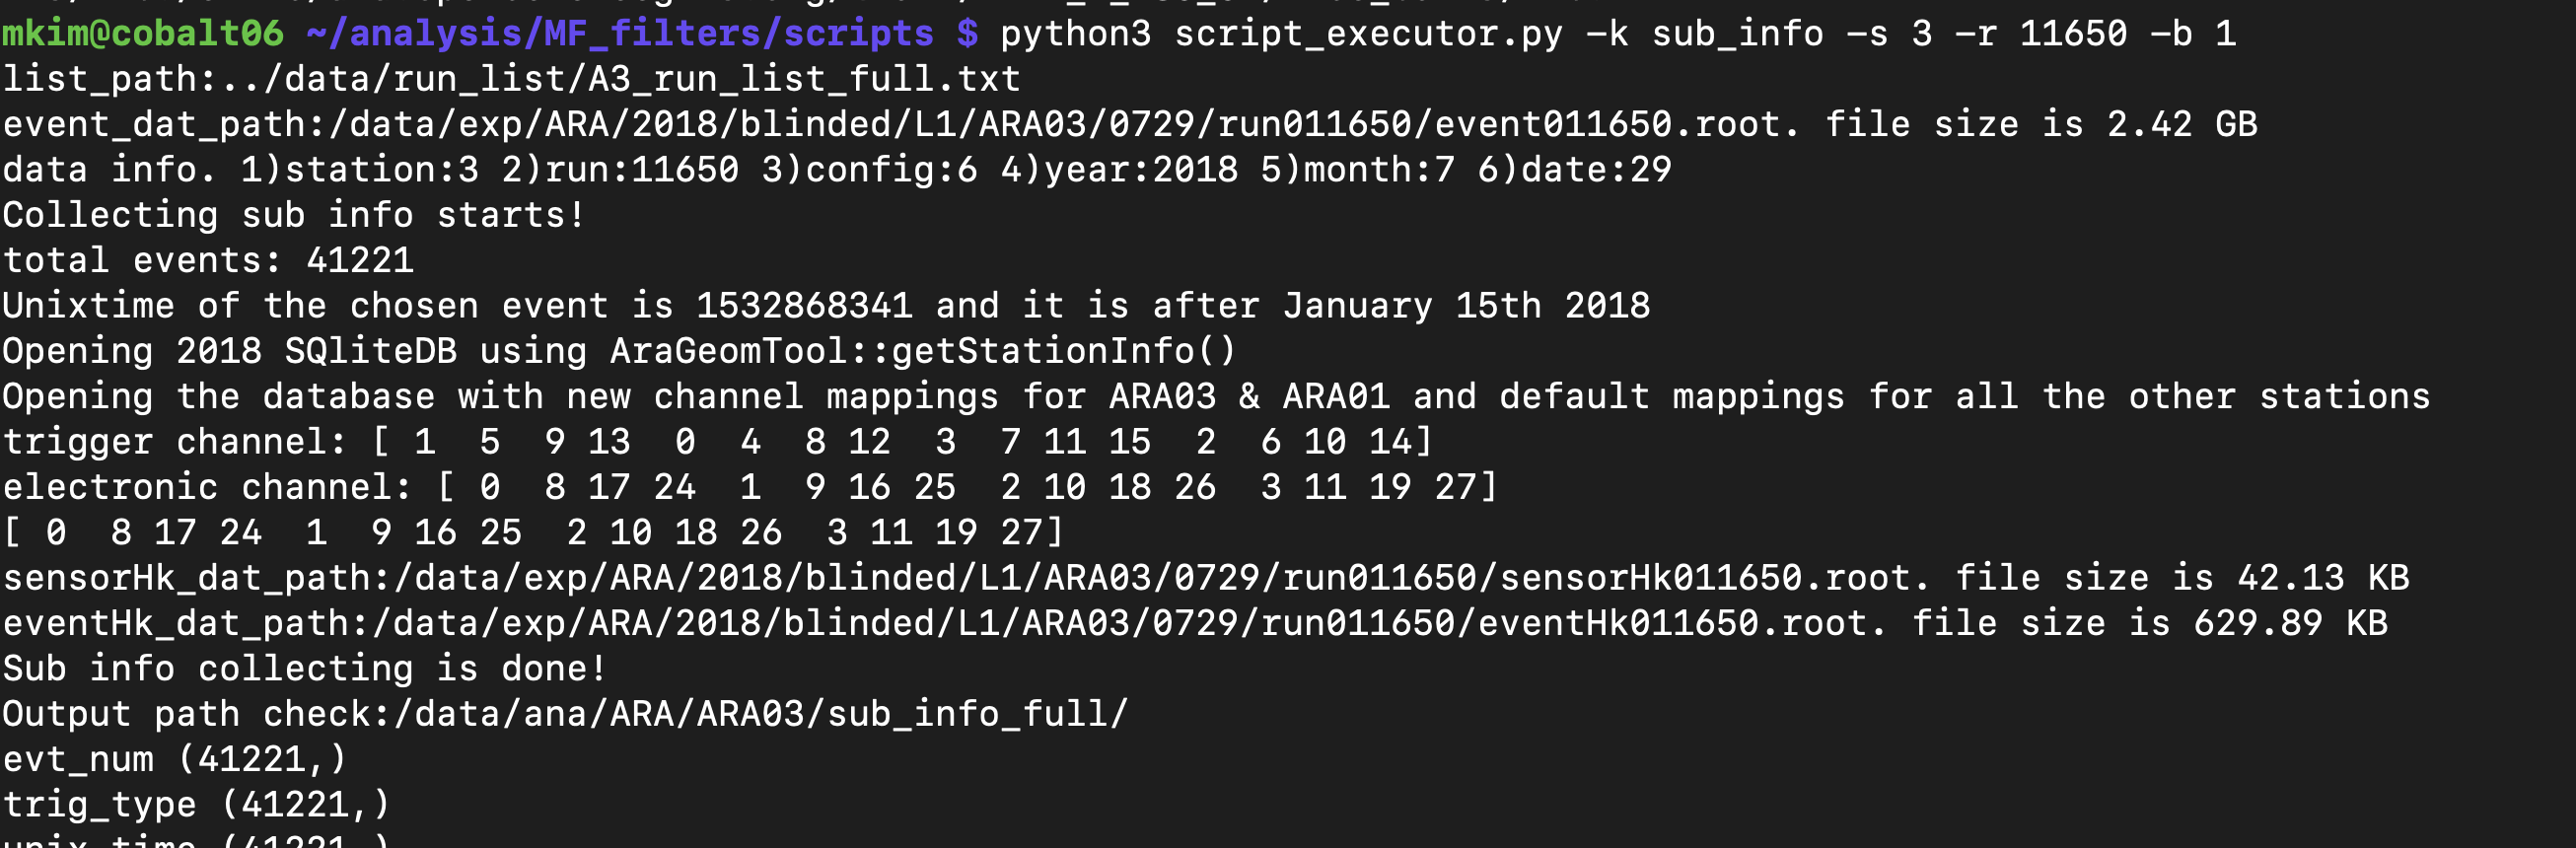
Fig. 4 example message
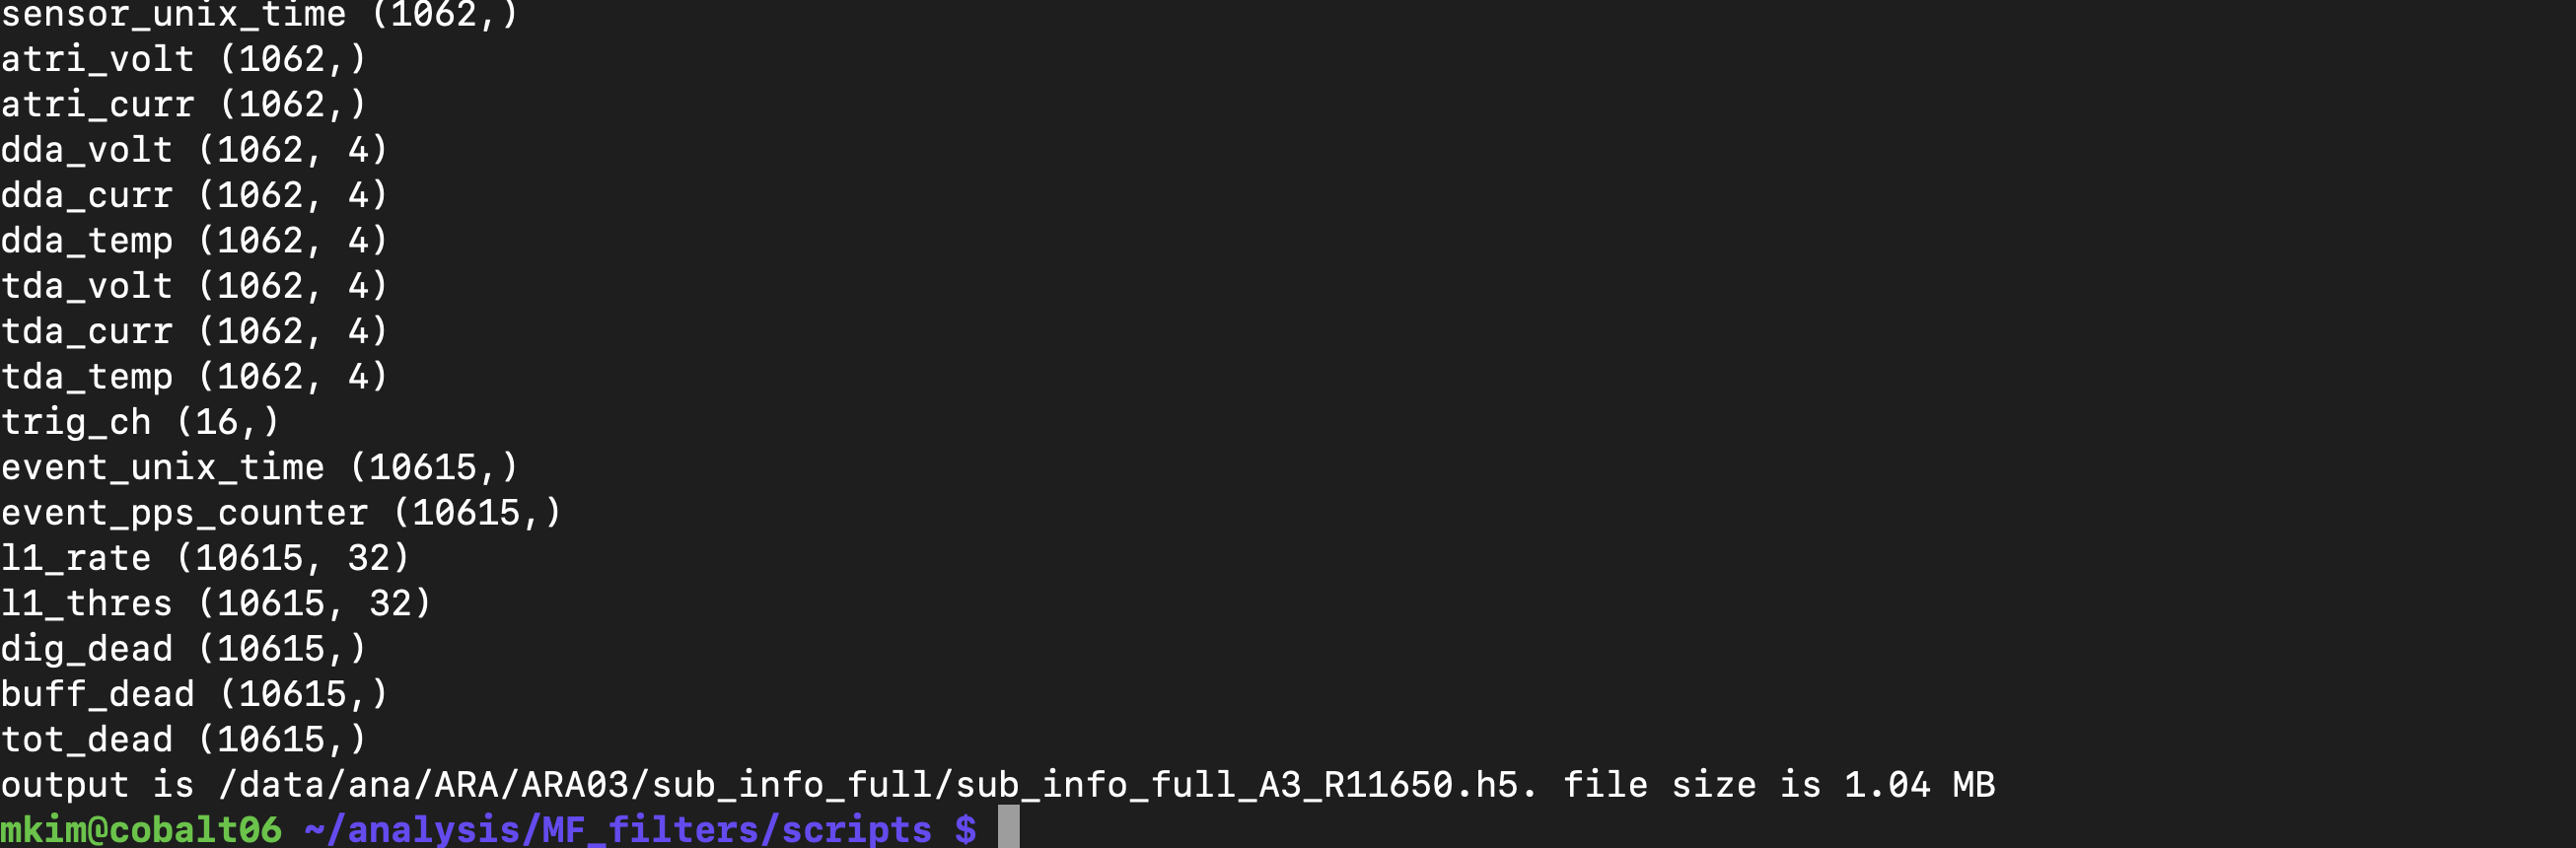
Fig. 5 example message
Simulation Process
Simulated events are generated by AraSim in_situ_gain branch. It is almost identical with main branch. Just way to match gain model and simulated channel are bit outdated.
In order to produce simulation set, User need two things
setup files per configuration: sim_setup_maker_only_setup.py will genrate AraSim setup file that can simulate each datas configuration. Already generated setup files are in sim/ARA02/ and sim/ARA03/
gain and noise models per configuration: These files are generated from data itself. It is containing each configurations unique frequency spetrum of all channels. Already generated models are in sim/ARA02/sim_table_full/ and sim/ARA03/sim_table_full/
After having those things, user can launch the simulation like excuting below commands from AraSim/ path:
source /home/mkim/analysis/MF_filters/setup.sh
./AraSim /home/mkim/analysis/MF_filters/sim/ARA02/sim_signal_setup_full/signal_E16_F1_A2_R1.txt 0 /data/ana/ARA/ARA02/sim_signal_full
First argument is setup file. Second argument is just book keeping number. And third argument is desired output path.
Details of simulation will be discussed at eh analysis section
Analysis Chain by Code
This is just summary of commands that user need to execute (in sequence) to get sensitivity from burn sample and simulated events.
I recommand to read the analysis section first. It will make you easy to read below commands
For the data side:
source ../setup.sh
python3 script_executor.py -k sub_info -s <station ID> -r <run number> -b 1          # collect sencondary information
python3 script_executor.py -k qual_cut_1st -s <station ID> -r <run number> -b 1 -q 1 # performs 1st data cleaning
python3 script_executor.py -k ped -s <station ID> -r <run number> -b 1               # produces pedestal
python3 script_executor.py -k baseline -s <station ID> -r <run number> -b 1          # produces average frequency sepctrum for testbed method
python3 script_executor.py -k cw_flag -s <station ID> -r <run number> -b 1           # identify freqiencies that contaminated by CW
python3 script_executor.py -k cw_band -s <station ID> -r <run number>                # grouping bad frequencies for geometric filter
python3 script_executor.py -k cw_ratio -s <station ID> -r <run number> -b 1          # calculates power reduction ratio by geometric filter
python3 script_executor.py -k qual_cut_2nd -s <station ID> -r <run number> -b 1 -q 2 # performs 2nd data cleaning
python3 script_executor.py -k ped -s <station ID> -r <run number> -b 1               # produces pedestal based on 2nd data cleaning
python3 script_executor.py -k rayl -s <station ID> -r <run number> -b 1              # produces noise and gain model
python3 script_executor.py -k rayl_nb -s <station ID> -r <run number> -b 1           # produces noise and gain model without band pass filter. it is for matched filter
python3 script_executor.py -k snr -s <station ID> -r <run number>                    # calculates SNR
python3 arr_time_table_maker.py <station ID>                                         # calculates arrivaltime table by ray tracing
python3 script_executor.py -k reco_ele_lite -s <station ID> -r <run number>          # performs vertex reconstruction based on AraCorrelator method
python3 script_executor.py -k rpr -s <station ID> -r <run number>                    # calculates Root Power Ratio for AraVertex based reconstruction
python3 script_executor.py -k vertex -s <station ID> -r <run number>                 # performs vertex reconstruction based on AraVertex method
python3 script_executor.py -k mf -s <station ID> -r <run number>                     # perform matched filter
python3 script_executor.py -k qual_cut_3rd -s <station ID> -r <run number> -b 1 -q 3 # performs 3rd data cleaning
python3 script_executor.py -k sub_info_burn -s <station ID> -r <run number>          # collect sencondary information in the burn sample
python3 info_summary.py <station ID>                                                 # collect run and event number, trigger type, and unxi time for all events
python3 dat_summary_live.py <station ID> <entry> <entry width>                       # calculates live time based on 1st data cleaning
python3 dat_summary_live_sum.py <station ID>                                         # merges the results
python3 dat_summary_qual.py <station ID> <entry> <entry width>                       # collect the data cleaning results of all events
python3 dat_summary_qual_sum.py <station ID>                                         # merges the results
python3 dat_summary.py <station ID> <entry> <entry width>                            # collect the vertex reconstruction and matched filter results of all events
python3 dat_summary_sum.py <station ID>                                              # merges the results
For the simulation side:
source ../setup.sh
python3 sim_script_executor.py -k sub_info -s <station ID> -d <sim output path>       # both signal and noise
python3 sim_one_weight.py <station ID> mass                                           # signal only. calcualtes event rate based on probability and flux model
python3 sim_script_executor.py -k baseline -s <station ID> -d <sim output path>       # noise only
python3 baseline_merge.py <station ID>                                                # noise only
python3 sim_script_executor.py -k phase -s <station ID> -d <sim output path>          # noise only. collect the phase of noise only event that will be used for phase variance method
python3 sim_script_executor.py -k cw_flag -s <station ID> -d <sim output path>        # nosie only
python3 sim_script_executor.py -k cw_flag_signal -s <station ID> -d <sim output path> # signal only. perform testbed and phase variance by using the phase from noise event
python3 sim_script_executor.py -k cw_ratio -s <station ID> -d <sim output path>       # both signal and noise
python3 sim_script_executor.py -k rms -s <station ID> -d <sim output path>            # both signal and noise. calculates rms
python3 rms_merge.py <station ID>                                                     # nosie only
python3 snr_maker.py <station ID> <rms results path>                                  # both signal and noise. calculates SNR by rms from noise event
python3 sim_script_executor.py -k reco_ele -s <station ID> -d <sim output path>       # both signal and noise. finds c_max of all elevation angle
python3 reco_ele_lite_merge_sim.py <station ID> <signal or noise>                     # both signal and noise. re-structure the vertex reconstruction results by chooing only one c_max
python3 sim_script_executor.py -k rpr -s <station ID> -d <sim output path>            # both signal and noise
python3 sim_script_executor.py -k vertex -s <station ID> -d <sim output path>         # both signal and noise
python3 sim_script_executor.py -k temp -s <station ID> -d <sim output path>           # both signal and noise. generates template that will be used for matched filter to data and sim
python3 sim_script_executor.py -k mf -s <station ID> -d <sim output path>             # both signal and noise
python3 sim_script_executor.py -k qual_cut -s <station ID> -d <sim output path>       # both signal and noise
python3 sim_summary_qual.py <station ID> <signal or noise>                            # both signal and noise. collect the data cleaning results of all events
python3 sim_summary.py <station ID> <signal or noise>                                 # both signal and noise. collect the vertex reconstruction and matched filter results of all events
This final stage needed to be performed after user execute all the commands on the above:
source ../setup.sh
Check_Sim_v30_mf_corr_2d_map_fianl_surface_cut                                                  # it is drawing all 3 data cleaning results in 2 parameters
Check_Sim_v31.4.1_back_est_total_w_edge_ellipse                                                 # it is re-structure the data in slope and intercept parameter
python3 back_est_gof_ell.py <station ID> <0:VPol, 1:Hpol> <slope: 0 ~ 179> <fit range: 0 ~ 19>  # testing goodness of fit
python3 back_est_gof_ell_sum.py <station ID> <0:VPol, 1:Hpol>                                   # merging each GOF test results
Check_Sim_v32.2_back_est_pseudo_total_w_edge_ellipse                                            # calculates background estimation
python3 upper_limit_summary_total.py <station ID>                                               # calculates upper limit
Check_Sim_v34.0.5_live_time_plot                                                                # draws livetime plot
Check_Sim_v34.3_mf_corr_ver_2d_map_w_cut_combine_w_noise_total_w_edge_ellipse                   # draws results in 2 parameters with final signal background cut
Check_Sim_v36.7_aeff_sig_eff_evt_rate_combine_old_compariosn_w_err_total_w_edge                 # calcualtes Aeff, efficiencies, event passing rate
Check_Sim_v37_sensitivity_3results # draws sensitivity
User can find Check_Sim_v~ scripts in the Google Collab. from here.
How to launch the code at the condor
All the data and sim processes that can run by (sim_)script_executor.py can be perfromed at the condor system.
User can find condor submitting scripts from scripts/batch_run/ path.
For example, If user want to get vertex location of all burn sample events, go to submitter space by ssh submitter command, copy the entire wipac/ to uesrs own scratch path like /scratc/mkim/hwipac/. After deploying the submitting scripts, user need to change key option to reco_ele_lite and change the path of log, output, and error to your wipac/ path in the scratch. Then, simply typing bash ARA_dag_launch.sh at the /scratc/mkim/wipac/ path will make you submit your script to massive data process. If user can see Fig. 6 from the terminal after typing condor_q and observing DONE counts are going up, everyting is working well.
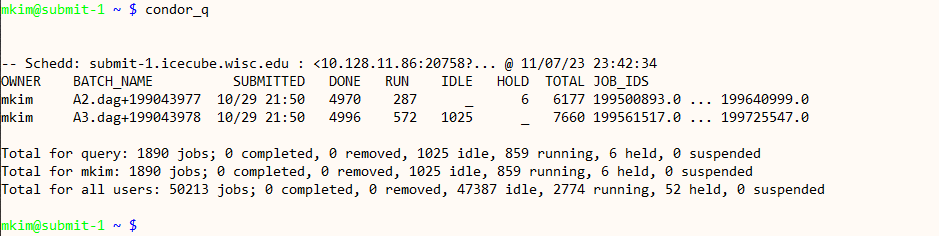
Fig. 6 example message after type condor_q
At the scripts/batch_run/, User can use wipac_full to process blind data, wipac_sim_signal_config for producing simulate events, and wipac_sim_signal_result_config for analyzing simulate events. And user can find few more scripts that can useful for massive data process.