2. ELECTROMAGNETIC OBSERVATIONS
2.4 MULTI-WAVELENGTH AFTERGLOWS
2.4.3 ISOTROPIC LUMINOSITY & ENERGY
The observed isotropic luminosity Lgiso of GRB030329, in the 30-400 keV band pass, can be calculated as follows:
![]()
Note that there is an implicit connection between the observed redshift (z), luminosity distance (dL), through an assumed cosmology. Since the spectroscopic redshift and observed flux are experimental observables, which span a distribution among individual GRBs and their sub classes, it is observationally inaccurate to assume a common value for all bursts. In order to facilitate a more direct comparison with the diffuse formulation, we use assumption of spherically symmetric, isotropic emission. However, we emphasize that our next iteration of the spectrum will correct for anisotropic emission, i.e. beaming effects, and cosmological k-corrections due to the redshift of the emission bandpass with respect to the observed bandpass. The former leads to an overestimation of the emitted luminosity which is modulated by Wb/4p sr, where Wb is the beaming solid angle.
An additional problem, due to the differential temporal and energy thresholds and sensitivities onboard the various GRB satellites, is the existence of selection effects, i.e. to the misrepresentation of burst populations. A clear example of this, can be seen in the IPN3 data sample, where poor temporal and energy detector thresholds result in an under representation of short GRBs and an over-representation of bright, long GRBs as can be see in figure 2.4.3.1. In addition to the under sampling of short GRBs, the mean duration for the long burst class is diminished by a factor of 2 due. Both selection effects are examples of the experimental bias introduced by different GRB detectors and underscore the error of lumping all bursts into a single category. Ironically, figure 2.4.3.1, taken from Kuehn 2004, was used to argue that the IPN3 and BATSE samples are the same statistical sample. Our contention, however, has been that the IPN3 represents a biased statistical sub sample of the canonical BATSE distribution.
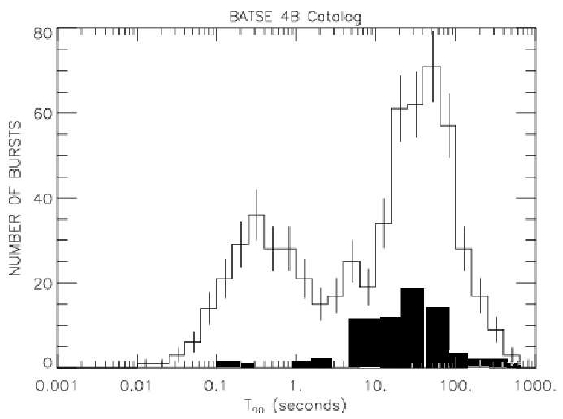
FIGURE 2.4.3.1: Bimodal distribution of T90 durations for BATSE GRBS (BATSE 2001). The T90 interval is the accumulation time required for a burst to emit from 5%-95% of the total number of detector counts above background. Long and short GRB populations span T90 durations that are greater than and less than ~2 seconds, respectively. The solid filled distribution represents the IPN3 burst sample. A clear under sampling of short bursts is evident. Furthermore, there is a noticeable shift in the mean duration for the long burst. This effect is understand as an experimental selection effect due to the relatively poorer temporal and energy threshold sensitivity of the IPN3 with respect to BATSE. Figure taken from Kuehn 2004.