2. ELECTROMAGNETIC OBSERVATIONS
2.3 PROMPT g-RAY EMISSION
2.3.3 PHOTON ENERGY SPECTRUM
In the 30-400 keV band pass,
GRB030329 registered a photon flux of 15.09 +/- 0.10
photons/(cm2 s), an energy fluence (Fg)
of 1.182 E-4 +/- 1.6 E-6 ergs/cm2, and an
energy flux (Fg) of 1.878 E-6
+/- 2.5 E-8 ergs/(cm2 s) in HETE-II (Vanderspek
et al.
2004). The fluence, corroborated by Konus-Wind who
reported Fg = 1.6 E-4 ergs/cm2
(over 35 s) in the 15-5000 keV band pass (Golenetskii
et al. 2003), places GRB030329 in the top 0.2% of the 2704 bursts detected
by BATSE (Hjorth
et al. 2003). The peak flux, measured over 1.2 seconds, was > 7 E-6 ergs/(cm2
s), surpassing the Crab flux by over two orders of magnitude in the same energy
band (Vanderspek
et al.
2003).
The temporal spectra (light curves) of GRBs, in conjunction
with fluence and flux measurements, are used to generate energy spectra via
forward folding deconvolution (Loredo
& Epstein 1989), where the incident prompt g-ray
photon energy spectrum is determined via convolving an assumed spectral model
with the detector response and comparing the fit with observed data. The best
fit is determined via either the inverse of the covariance matrix or by
mapping and locating the minimum of the c2
surface (Ford
et al. 1995).
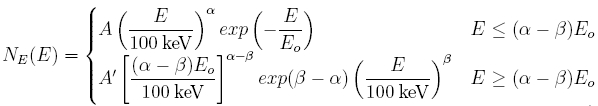
Although the light curves of GRBs are unique, the energy spectra of most bursts
are well described by an empirical model known as the Band function (Band
et al. 1993):
The spectral index changes from a low (a) to a higher (b) value at the break energy (egb), defined as:
![]()
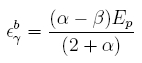
The normalization, A', is chosen such that the function and its derivative are continuous, i.e. A = A'. The maximum of E2NE(E) is proportional to nFn and is known as the peak energy (Ep), which is a measure of the spectral hardness, i.e. spectra with high/low Ep values are considered hard/soft, respectively. Since E2NE(E) is the energy flux per logarithmic energy band, Ep represents the typical or characteristic photon energy during the prompt GRB emission, i.e. the energy at which the source emits the bulk of its luminosity. For a > -2 and b < -2, Ep resides in the low energy component which is independent of b, and is defined as following:
![]()
Using the above expressions, we see that photon break and peak energies are related as follows:
Note that if once assumes average spectral indices, i.e. a ~ -1 and b ~ -2, then egb = Ep = Eo. The nFn spectrum of GRB030329 for a sample set of Band fit parameters is illustrated in figure 2.3.3.1.
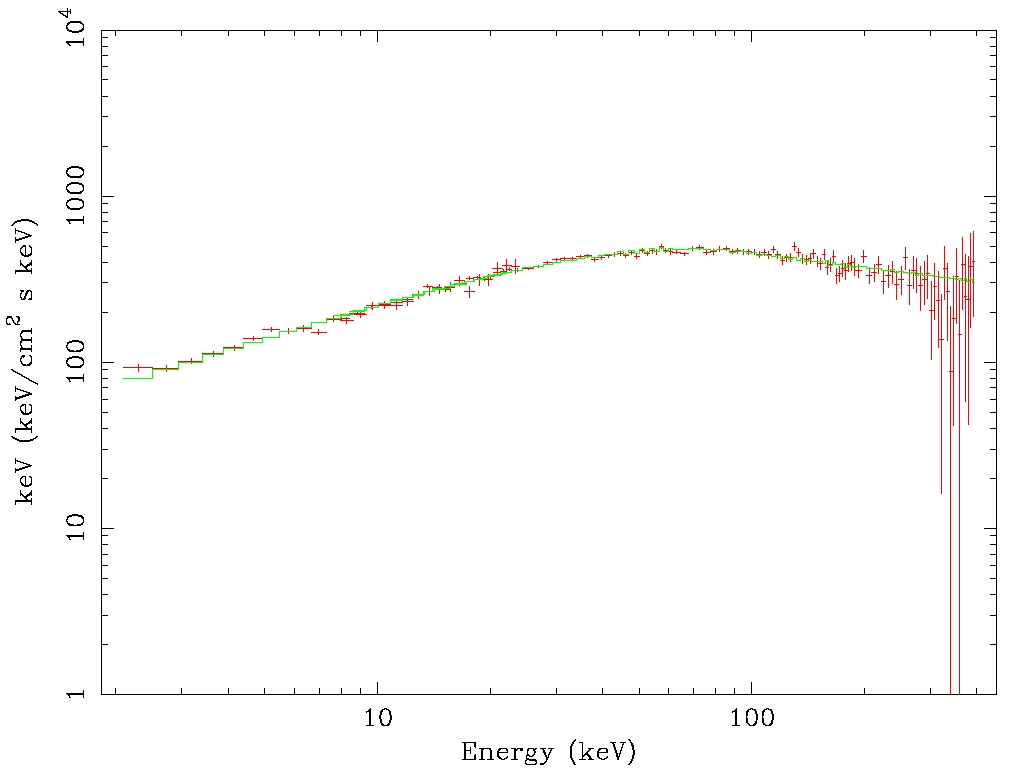
FIGURE 2.3.3.1: nFn spectrum of GRB030329 (Barraud et al. 2003); using the following Band function fit (green line) parameters: a = -1.2, b = -2.3, Eo = 91.4 keV, Ep = 73.1 keV.
The utility of the Band function lies in its inherent flexibility, since it can accommodate multiple standard spectral models such as:
Single Power Law (Eo→ ∞)
Photon Exponential (a = 0, b= -∞)
Energy Exponential (a.k.a optically thin thermal bremsstrahlung) (a = -1, b= -∞)
Broken Power Law with Continuous Transition (a ~-1, b ~ -2)
The caveat is that the fit parameters (A, a, b & Eo) must be allowed to vary, i.e. there are no universal values. Since the value of each fit parameter is a part of a distribution among GRBs, it is not adequate to assume that all GRBs are described by a fixed set of averaged parameters or that they obey simple power laws. In fact, the spectral fit parameters are time dependent and vary throughout the burst emission as illustrated in figure 2.3.3.2 for GRB030329.
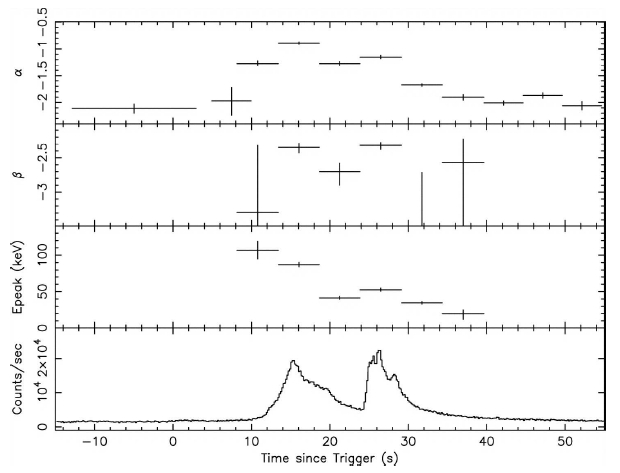
FIGURE 2.3.3.2: Temporal variation of Band spectral fit parameters for GRB030329 (Vanderspek et al. 2004). For reference, the bottom plot illustrates the light curve for FREGATE Band B (7-80 keV energy band pass).
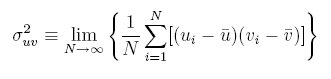
Traditionally, fit parameters are used which describe the entire burst emission, i.e. averaged over the burst duration. For this analysis, the following set of fit parameters to the Band function in the 2 - 400 keV band pass have been used: a = -1.32 +/- 0.02, b = -2.44 +/- 0.08 and Ep = 70.2 +/- 2.3 keV (Vanderspek et al. 2004). Using the equations above, the following parameters were calculated: Eo = 103.2 +/- 4.5 keV and egb = 115.6 +/- 9.9 keV. Canonical error propagation was adhered to, i.e. the variance was calculated via:
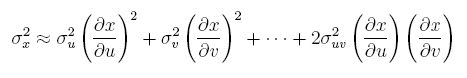
where the covariance is defined as:
The electromagnetic properties and the Band function spectral fit parameters used in this analysis for GRB030329 are summarized in table 2.3.3.1.
TABLE 2.3.3.1: Summary of Electromagnetic Properties & Energy Spectral Fit Parameters for GRB030329 (H2652).
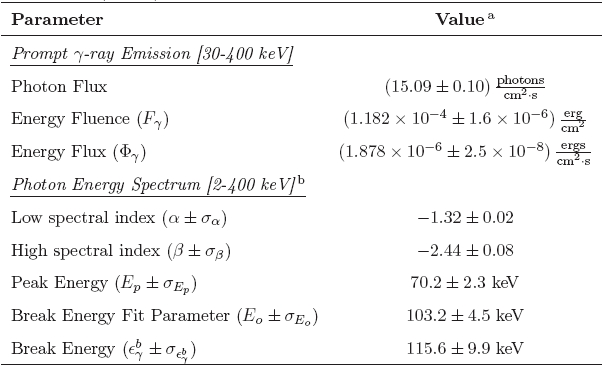
a Eo and egb were calculated, all other parameters taken from Vanderspek et al. 2004. b Errors given at 90% C.L.
Since the neutrino spectrum is expected to trace the photon spectrum, all spatio-temporal coincident GRB-neutrino searches with cataloged sources (Bay 2000, Hardtke et al. 2003, Kuehn 2004 & Taboada 2005) rely on the microphysics associated with the prompt g-ray emission phase. Specifically, the electromagnetic fluence of the burst is related to the normalization of the neutrino energy spectrum, while the prompt photon spectral (Band) fit parameters effect the break energies and slopes of the expected neutrino energy spectrum. In this manner, the photon energy spectral fit parameters and electromagnetic properties directly effect the shape and normalization of the expected neutrino spectrum. The former could play a role in the cut optimization while the latter is directly linked to the expected event rate. While there exist fundamental uncertainties, the description of the prompt photon emission is not among them. Hence a complete description of the photons is compulsory in order to
maintain a self-consistent prediction and
properly interpret the meaning of a null signal,
i.e. constraining the parameters of the model describing the microphysics of the burst. The importance of fitting the spectra of each GRB analyzed is further underscored in GRB941017 (BATSE trigger 3245), where a high energy (multi-MeV) tail in the prompt emission energy spectrum (Gonzalez et al. 2003) may indicate photomeson interactions in the source, with an enhanced predicted neutrino event rate (Muniz et al. 2004).