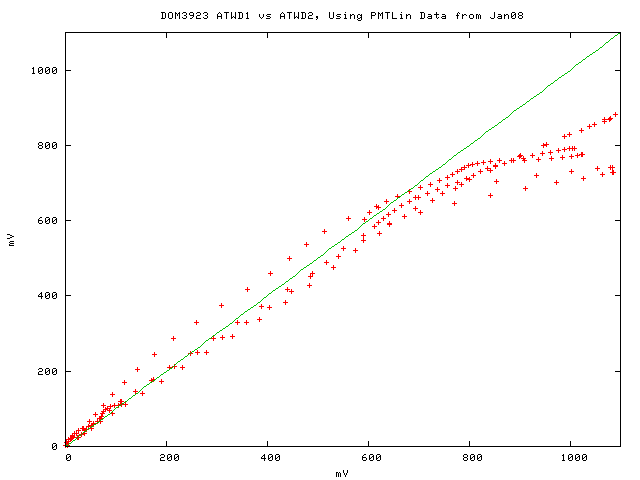
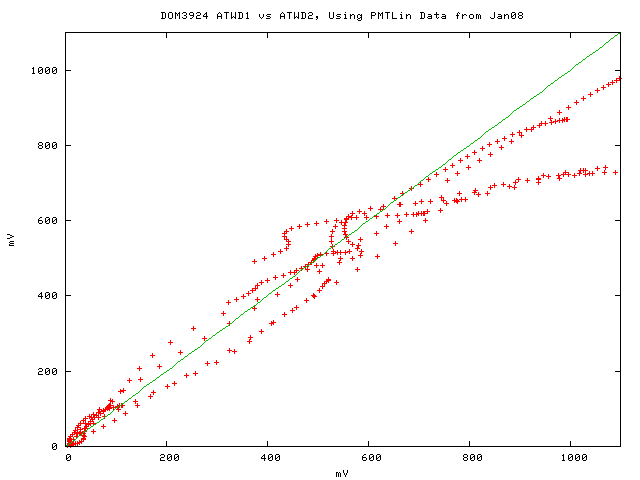
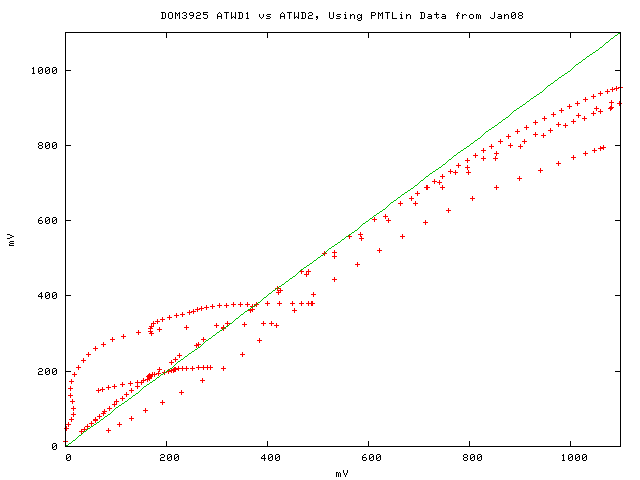
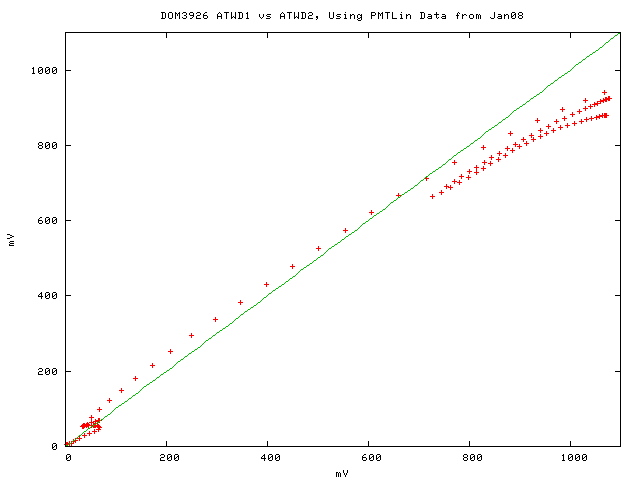
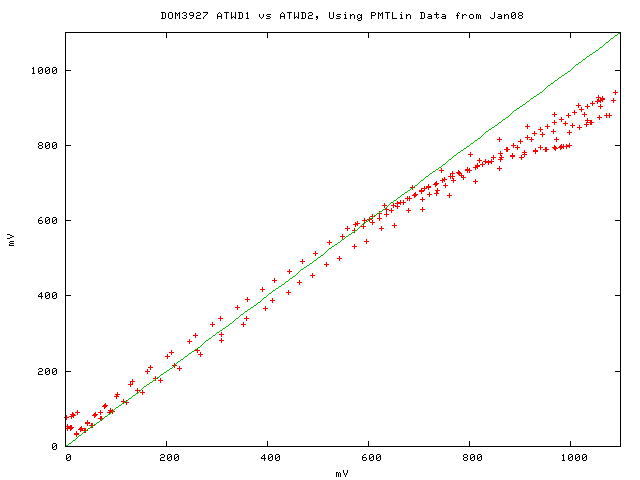
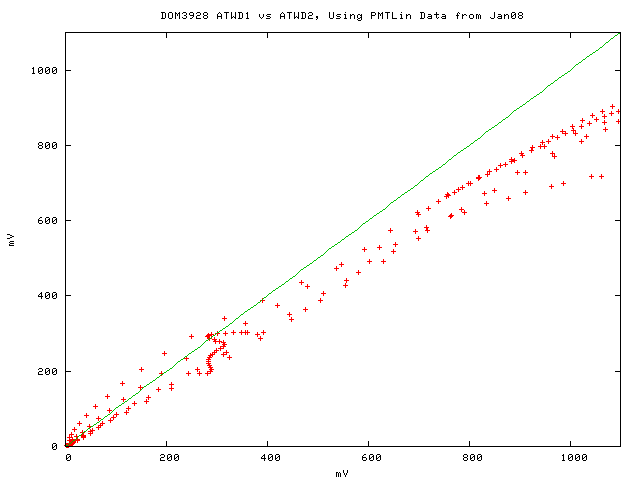
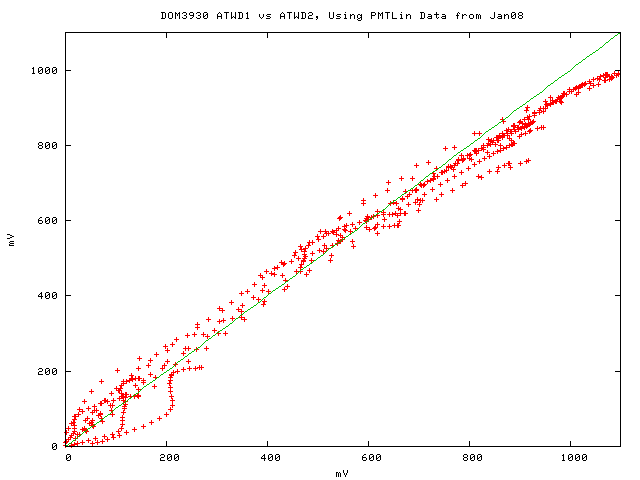
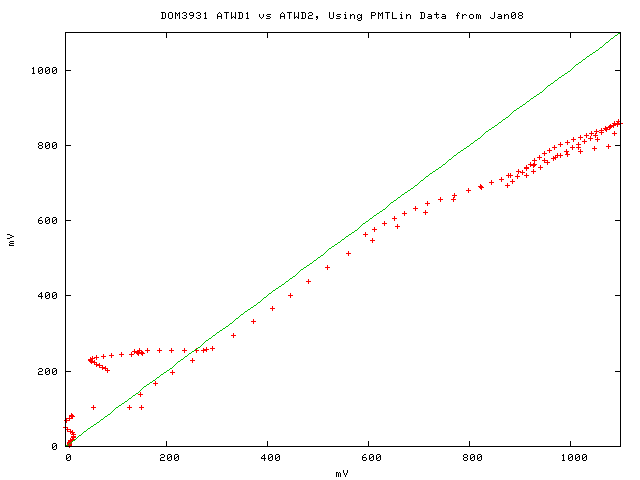
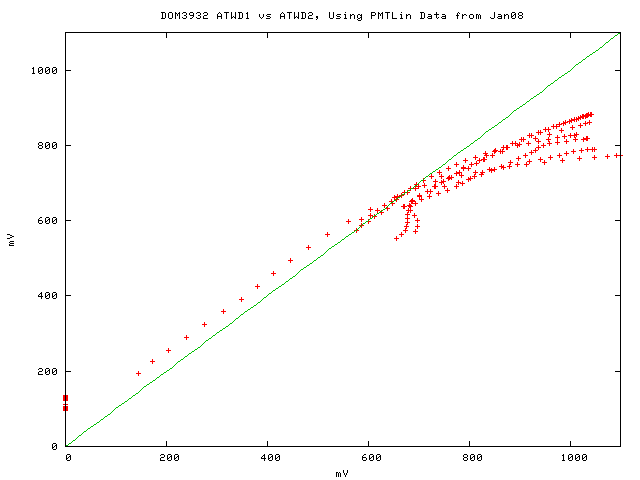
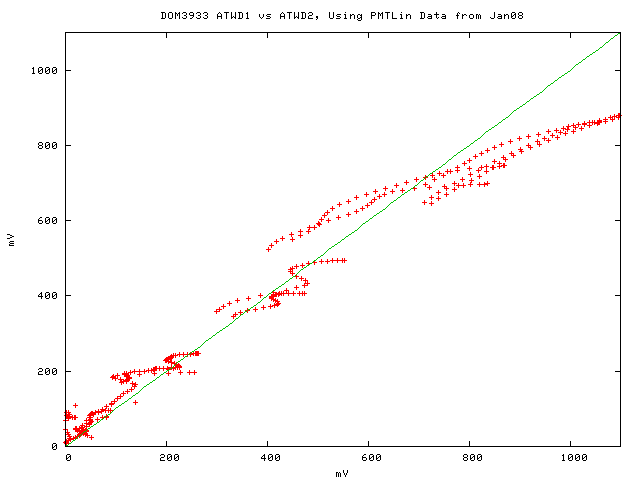
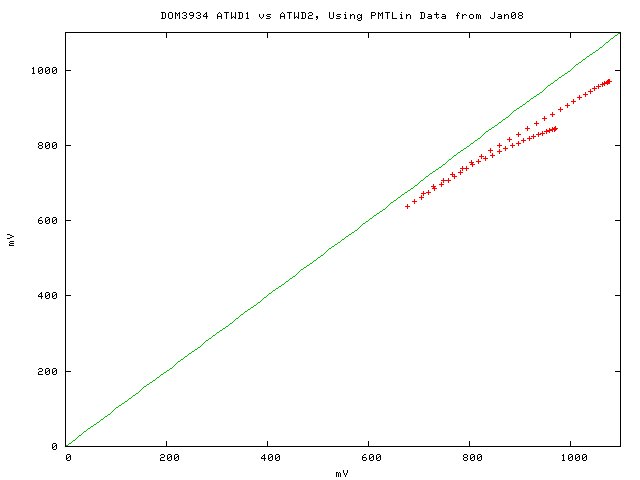
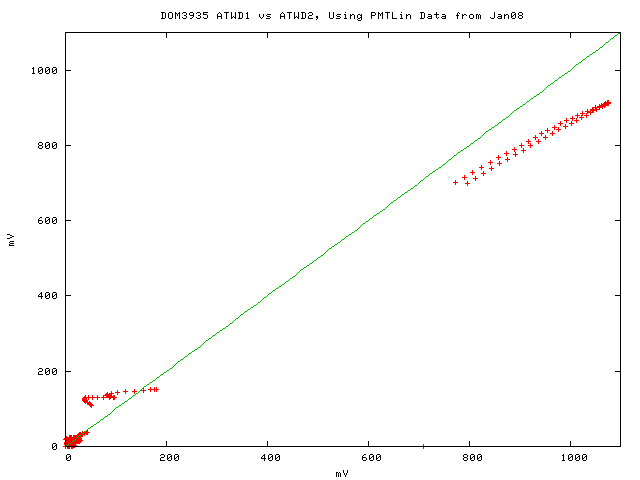
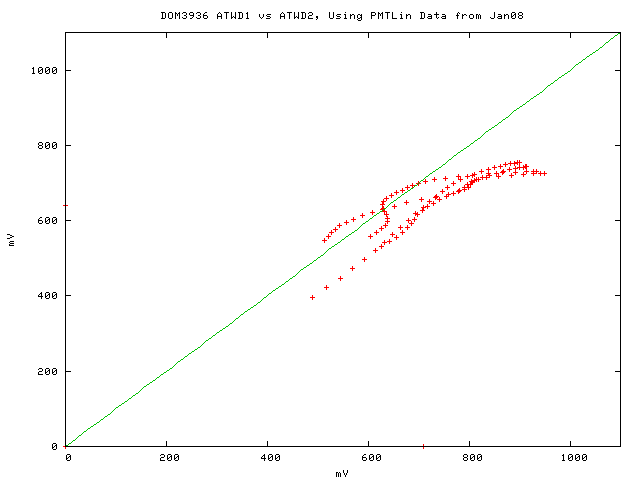
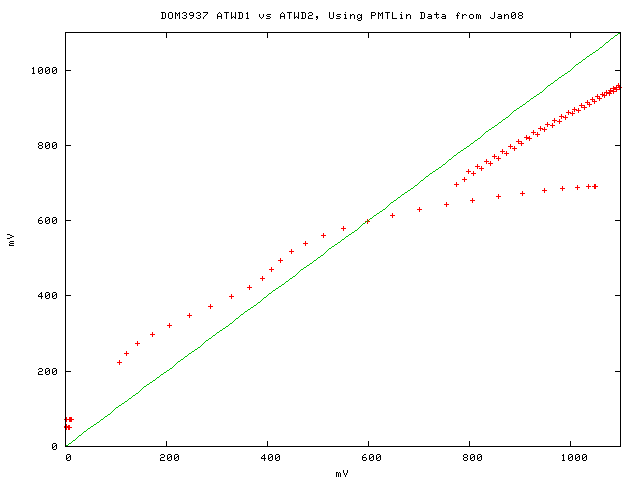
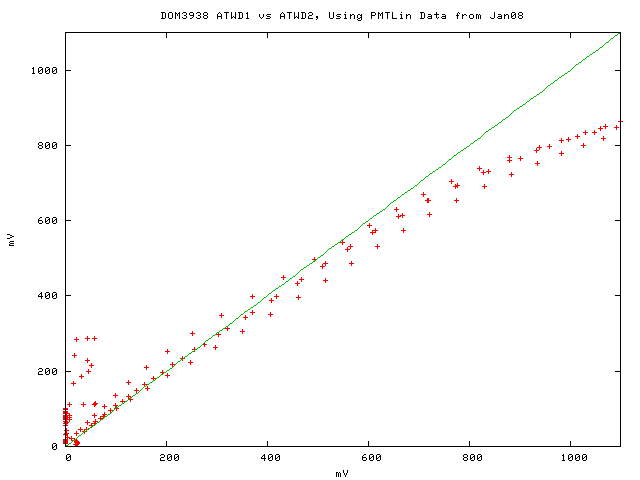
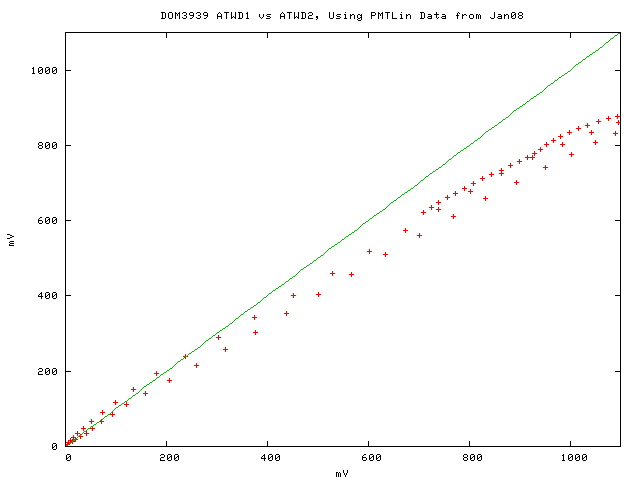
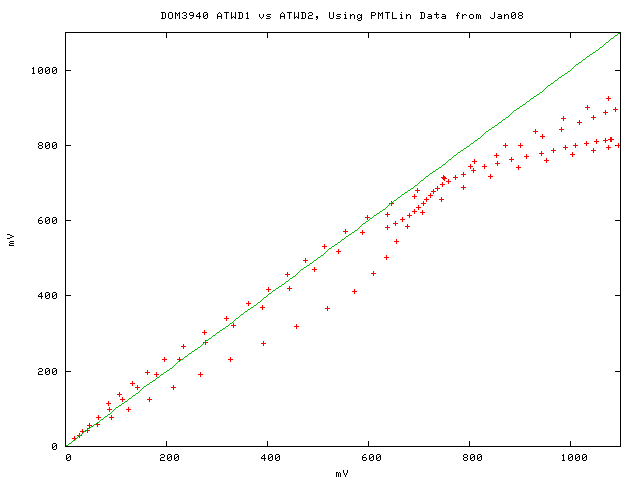
These plots depict the voltages measured in ATWD1 vs ATWD2 for DOMs on string 39. The data used were taken
in Jan 08. Averaged waveforms are used and each plot is made using waveforms when both channels have waveforms but
channel 1 is not yet saturated. Some of the plots are ugly but these are made primarily to continue the discussion on
how to include this channel correction in the saturation curve for the DOMs.
The peak and 30 leading edge points are used in each plots.