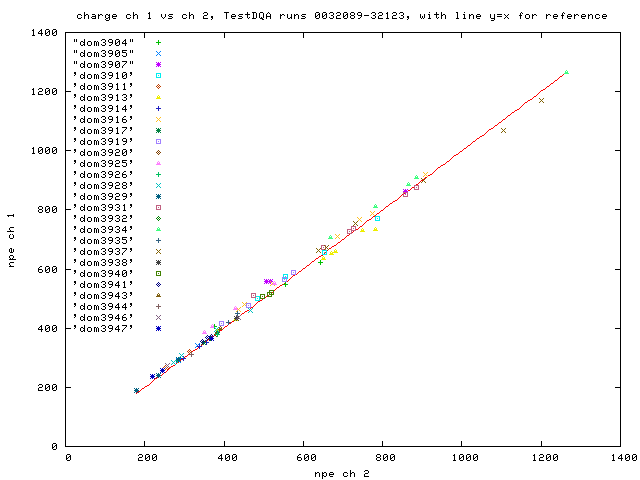
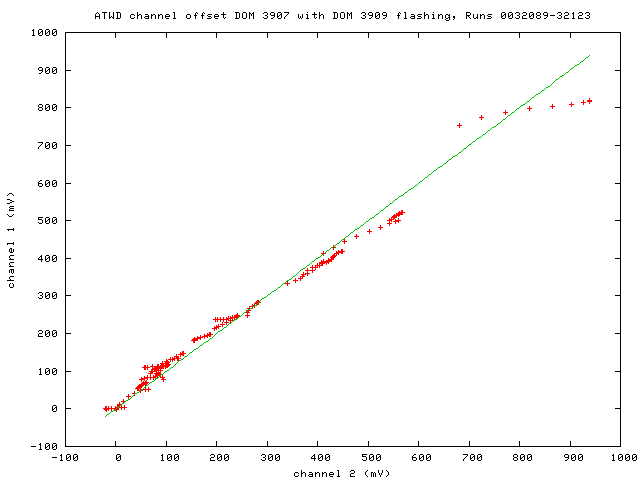
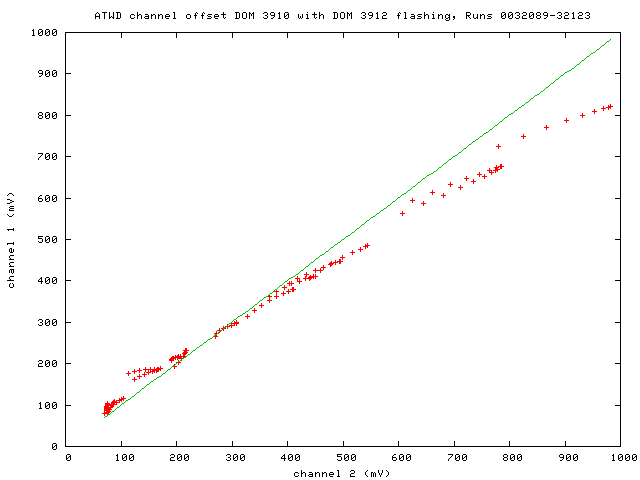
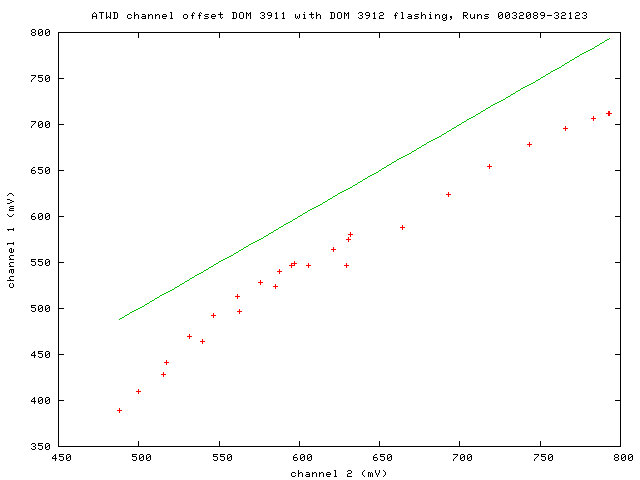
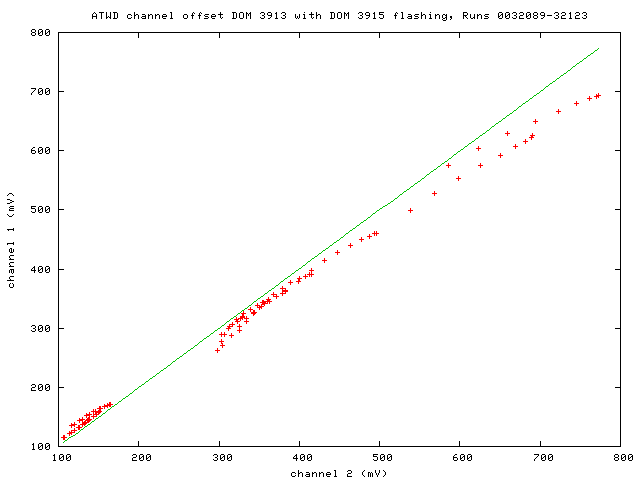
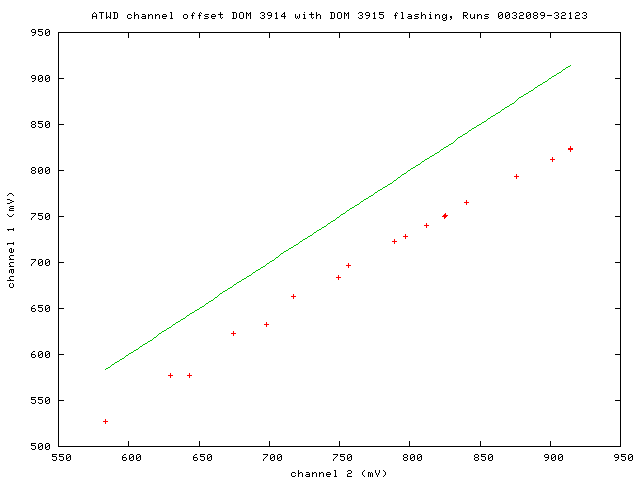
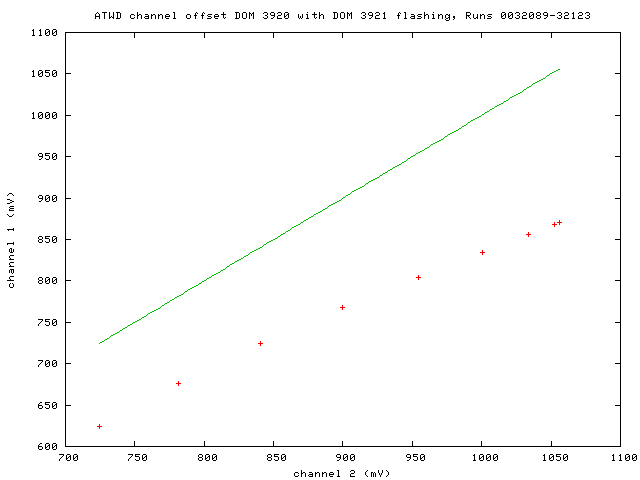
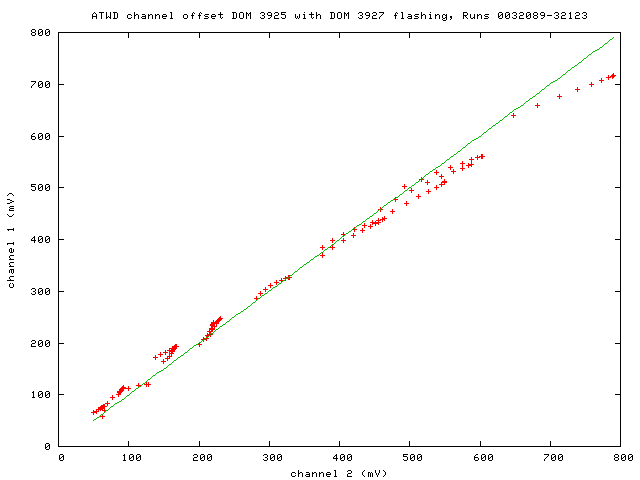
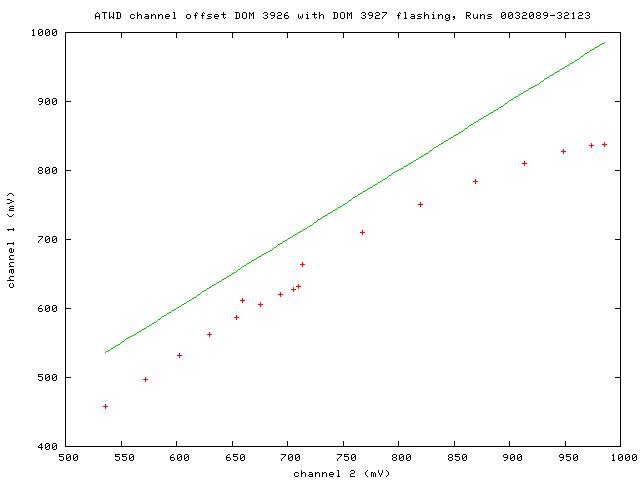
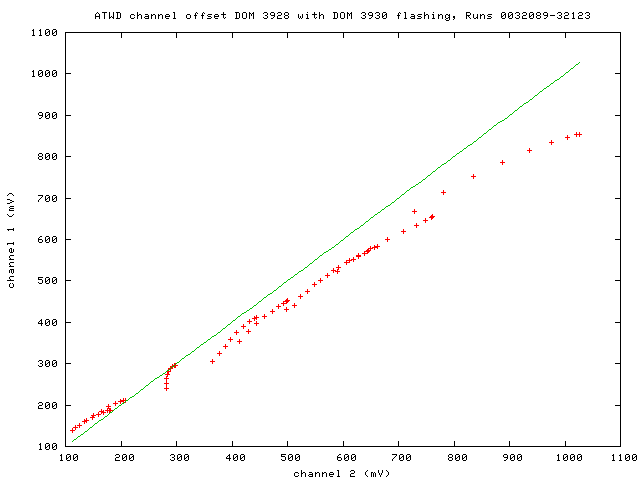
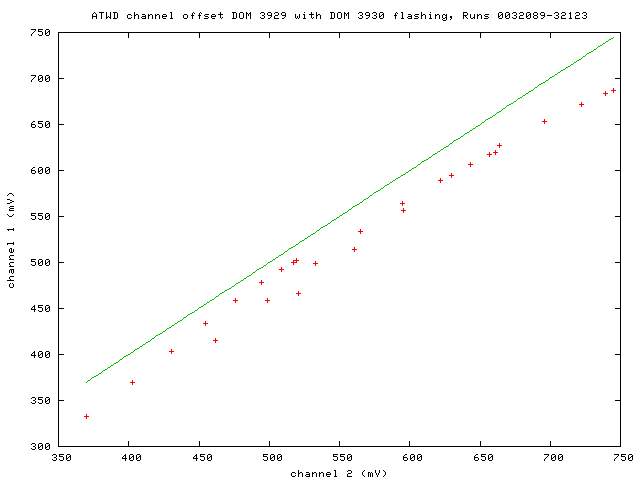
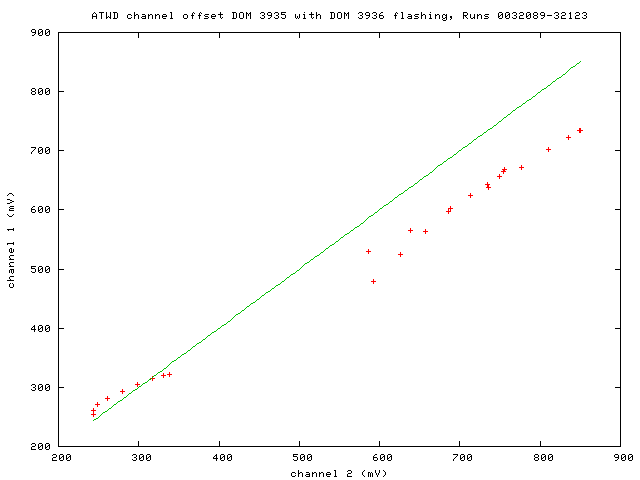
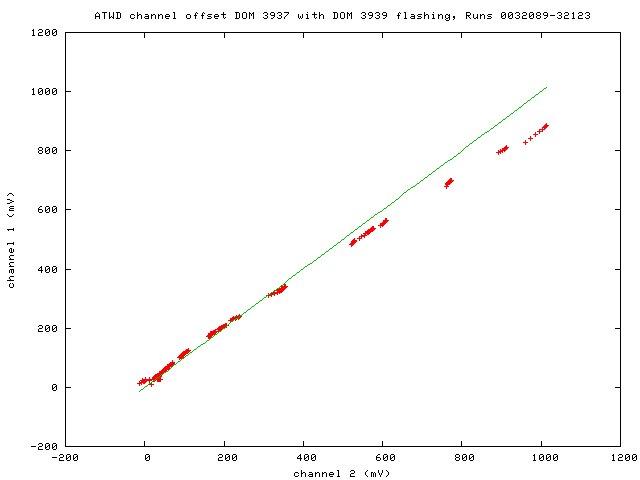
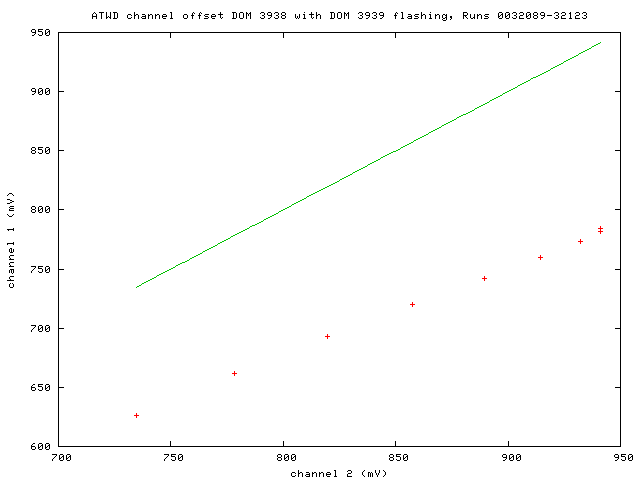
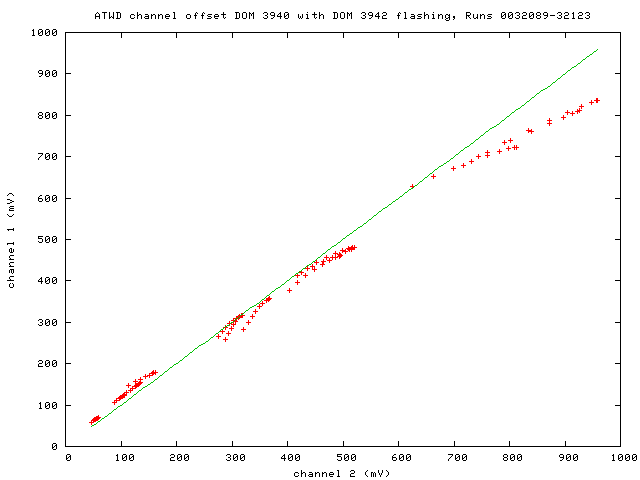
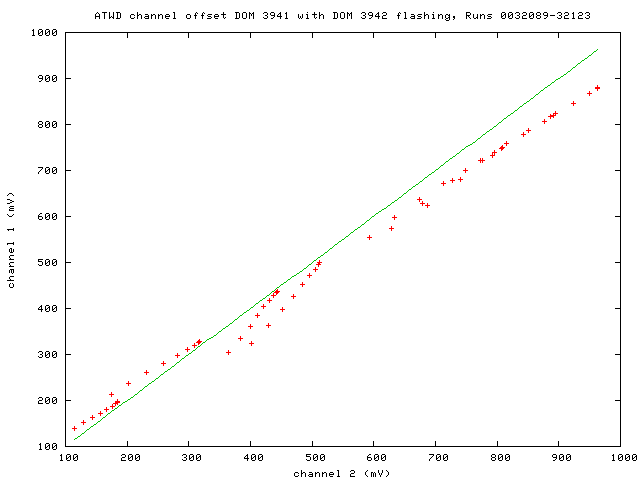
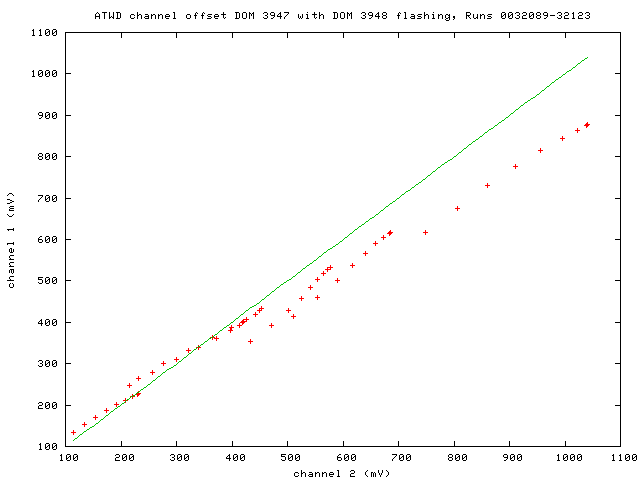
Below is a charge correlation plot using the TestDAQ runs0032089-32123.
These flasher runs were done with different brightness, width and masks. Only flashes which do not yet saturate ch1 are used.
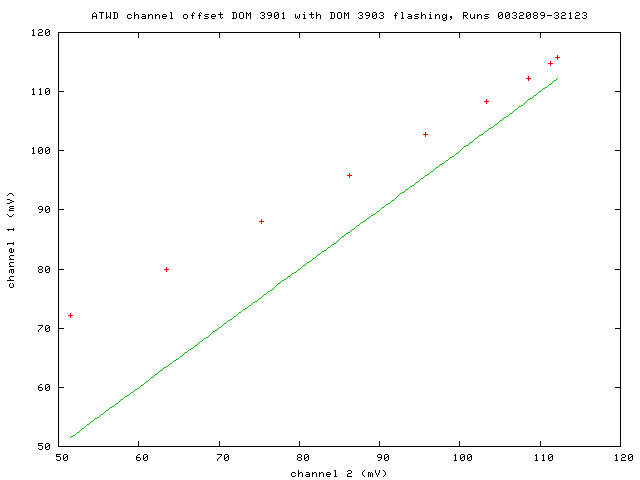
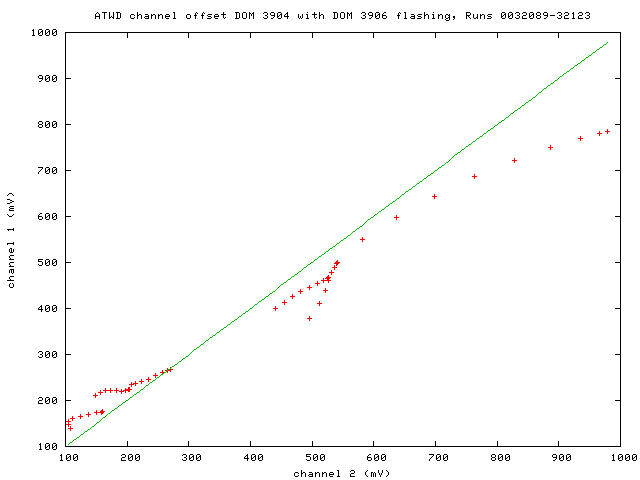
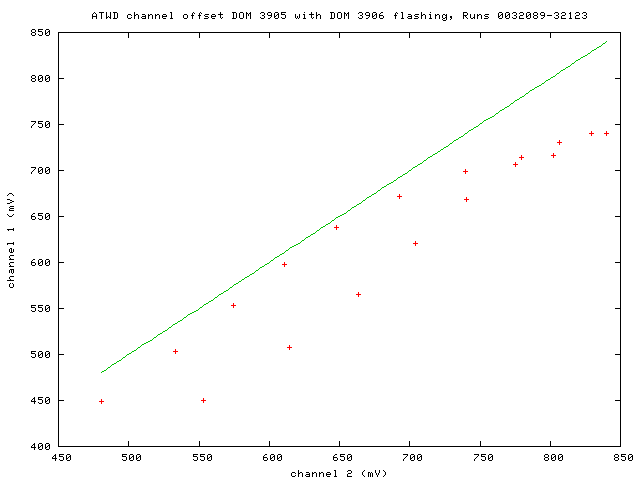
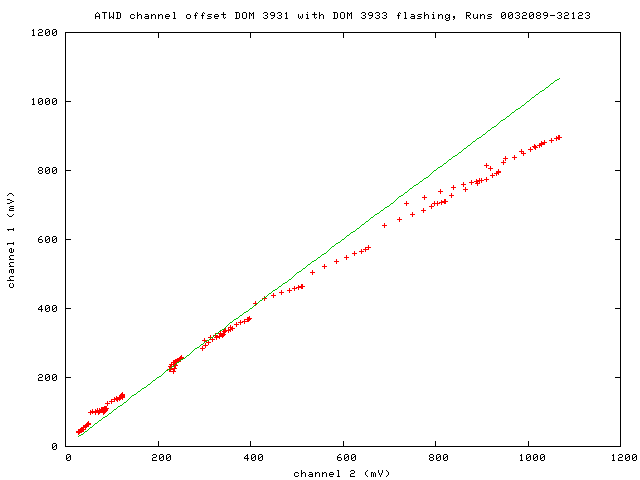
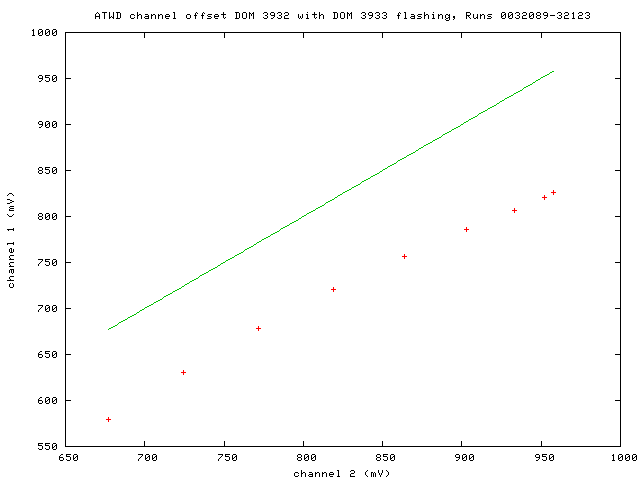
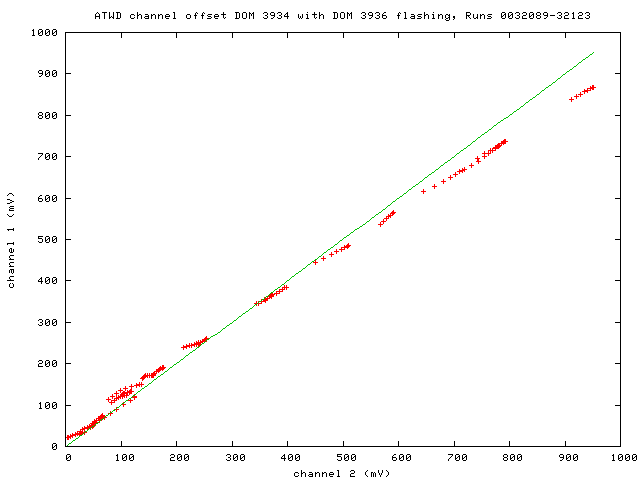
These plots depict the voltages measured in ATWD1 vs ATWD2 for DOMs on string 39. The data used were
taken in Dec 06 with the run numbers indicated on the plots. Averaged waveforms are used and
each plot is made using waveforms when both channels have waveforms but channel 1 is not yet
saturated.
The peak and 10 leading edge points are used in each plots.
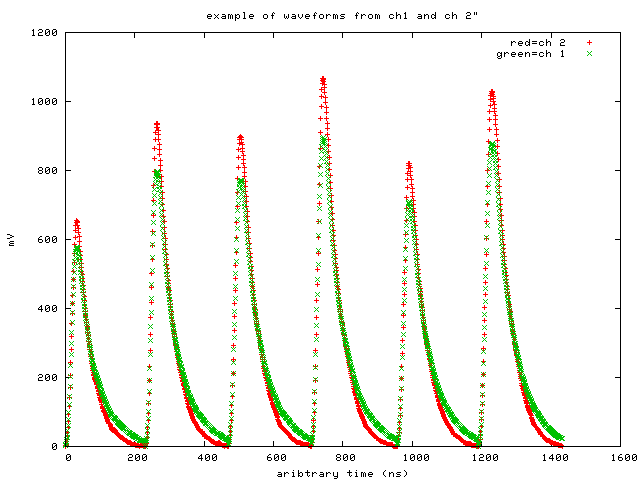
Integrating the waveforms give me charge differences in the 0.1-7%. Below are examples of waveforms each channel for DOM 3931 with DOM 3933 flashing.