Comparison of PMT Saturation between flasher data and Monte Carlo
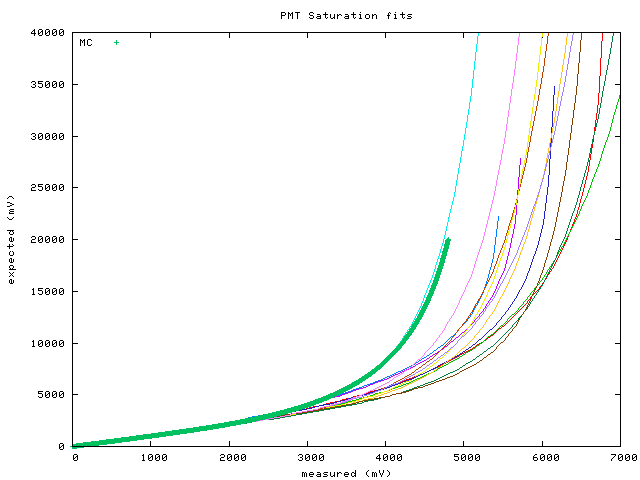
This is a collection of saturation curves made using flahser data. The fat green curve is what is
contained in Monte Carlo. I've checked that this is also the version in the latest version of pmt-simulator.
The parameters in the fit, maybe Chris can recognize them, are contained in I3PMTConstants.h
const double GAIN(1.0e7);
const double VOLTAGE(1365.*I3Units::V);
const double IMPEDENCE(43.*I3Units::ohm);//units are ohms.
* Current based saturation parameters measured by C. Wendt
*/
const double A(48.965 * I3Units::mA);//units are mA
const double B(129.74 * I3Units::mA);//units are mA
const double C(1.0709e-3 / I3Units::mA);//units are mA^-1
and the actual code is in the project pmt-simulator/private/pmt-simulator/pmtI3PMT.cxx
double I3PMT::SaturatedVoltage(double v_ideal){
//expects units of volts
double i_ideal(-v_ideal/I3PMTConstants::IMPEDENCE);
if(i_ideal <= 0) return v_ideal;
double alpha(pow(i_ideal/I3PMTConstants::A,3));
double beta(sqrt(i_ideal/I3PMTConstants::B));
double gamma(I3PMTConstants::C * i_ideal);
double ratio(1./( 1. + gamma * (log(1+alpha)/log(1+beta)) ));
return ratio * v_ideal;
}
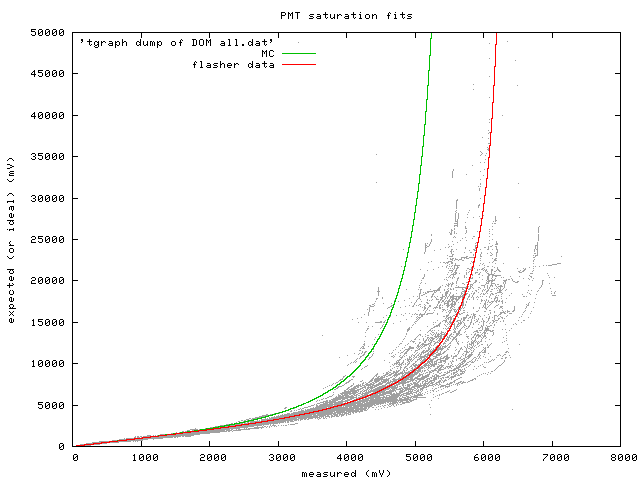
Here is a scatter plot of the data from 25 DOMs. On it I overlay the saturation curve from Monte Carlo
and then a fit to points using the same parametrization in the Monte Carlo. This fit was made using a
crude minimization of residuals between the points and the fit curve. No error is given at this time.
But it illustrates that one can improve the saturation correction in the Monte Carlo by adjusting the three parameters.
The new parameters from the fit above that could go into I3PMTConstants.h are:
const double A(74.91* I3Units::mA);//units are mA
const double B(123.25 * I3Units::mA);//units are mA
const double C(1.038e-3 / I3Units::mA);//units are mA^-1
The DOM that appears to saturate as the parametrization in the Monte Carlo is DOM5001, the first DOM on string 50,
"Chimpanzee", which has a broken flasherboard and was intentionally deployed at top of string 50.
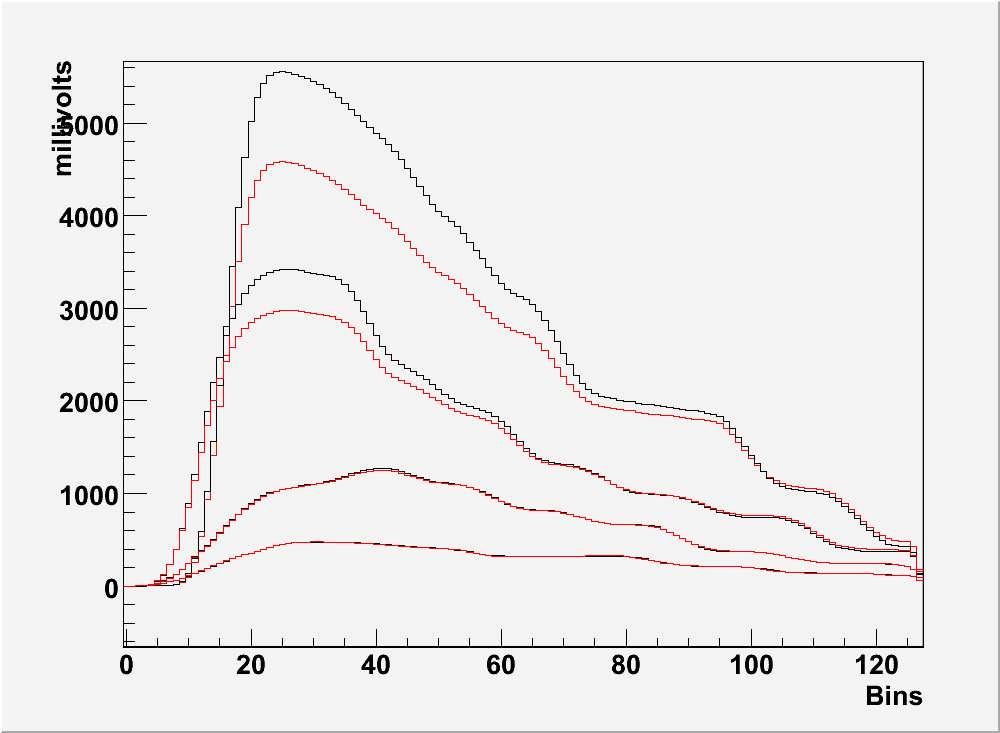
Now flasher runs are simulated. I arbitrarily set the flashing DOM as DOM63-55 and I simulate 300 flashes each with 8.4e+10photons. I use the old and new
PMT parmeters and I make the average waveform for DOMs 63-54, 63-53, 63-52, and 63-51. Starting at the top these are respectively represented by the pairs
of curves below where the red curves are for the old parameters and the black curves are with the new parameters.
Qualitatively this is what is expected from the change in parameters. The saturation occurs at a higher voltage and below around 2000mV the waveform should match. So, at least from this check, it appears that changing to the parameters does not break the pmt simulation.
Home