Introduction:
Muons from the SGR 1806-20 Dec 27 outburst
The main aim of
this
analysis is to use AMANDA-II as a muon
detector. Muons could be produced
in the
cascades from charged pions induced by the
gammas produced in the extremely intense
burst of the magnetar known as SGR 1806-20.
The muons from TeV gamma rays, potentially seen in AMANDA from this
burst, are calculable
from QED and from photoproduction DATA. The connection between initial
flux and observation in AMANDA is determined by known physics.
The source is located
in AMANDA’s upper hemisphere hence the
standard muon neutrino channel is not very
promising given the small
interaction probability in the atmosphere and the background of
atmospheric muons
(since both signal and background would look as external tracks).
The other channel
of
interest could be the neutrino induced
cascade that
will be subject to another unblinding
request for the
next future (though the energy region of interest is <100 TeV that
is not optimal for cascades).
Expected event
rates are
calculated in a phenomenological model in
F.
Halzen, H. Landsman and T. Montaruli,
TEV
PHOTONS AND NEUTRINOS FROM GIANT SOFT-GAMMA REPEATERS FLARES, astro-ph/0503348.
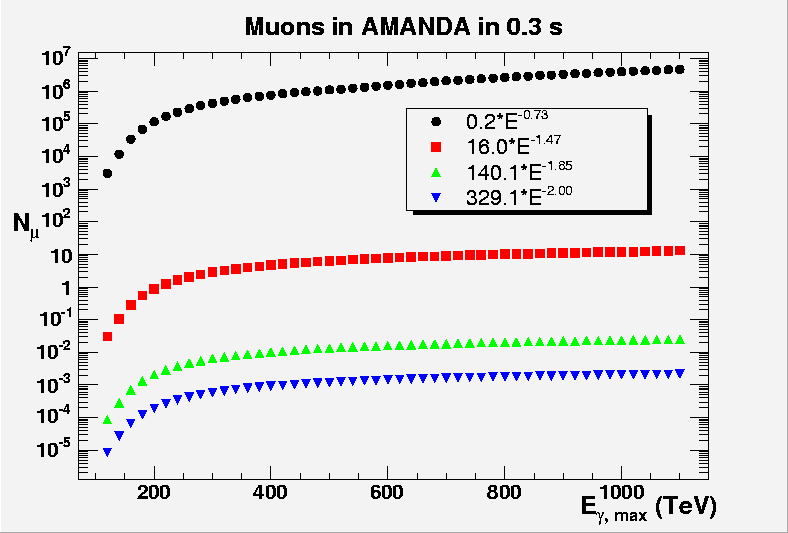
Event rates
strongly
depend on the assumed spectral index and on the maximum achievable
photon
energies. There are uncertainties
and arbitrary parameters in the model and the E-1.47
assumption is justified for the initial outburst given previous
detailed
observations by Beppo-SAX of a similar burst from SGR1900+14.

More
recently SGR 1806-20 were measured by Konus-Wind
and Helicon, astro-ph/0502541. In the paper the spectrum of the tail of the burst (not the initial spike)
is reported
in Fig 2: it exhibits a hard power-law component with E-1.8 ± 0.2
up to 104 keV were the
instruments
saturate.
Another spectral
measurement
was reported by SWIFT, astro-ph/0503030:
the
event unfortunately illuminated the detector from behind and the flux
passed
through the spacecraft and the shielding. The good time resolution of
0.1 ms allowed the
observation of the time structure of the
spike that lasted about 0.5 s. Nonetheless the energy resolution is
poor and
the spectral measurement in Fig. 3 up to 10 MeV
not
so reliable.
The last bin
(1.5-10) MeV may well contain a power-law
hard component, though the
authors fit the spectrum with an OTTB function (characteristic of em processes).
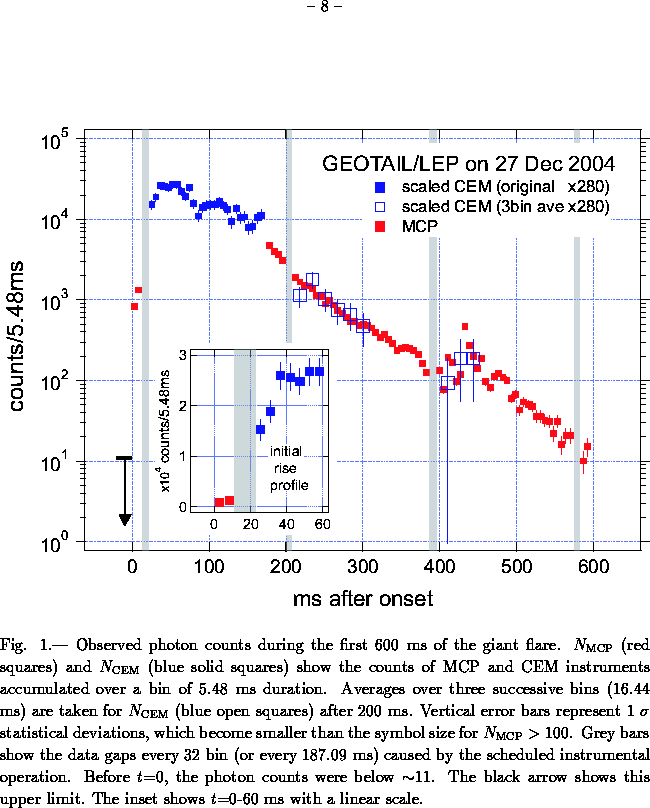
Also GEOTAIL
published the
counting rate as a function of time that decreases by more than 3
orders of
magnitude in 0.6 s.
The relevant
information for
the analysis are:
- coordinates
of the source: we assume the values from P.B. Cameron et al.,
astro-ph/0502428:
RA (J2000) 18h 08m
39.4s = 272.16 deg
DEC (J2000)
-20deg24'39.7" = -20.41 deg
- Most of the
satellites
report a spike duration of the order of
< 0.6 s
- Various satellites report the
trigger time,
from which, knowing the position of the satellite we have to calculate
the
delay time of photons at Earth (and at AMANDA). See the method here
and the
definition of the reference system.
In the table the trigger times
and location
of satellites, their time resolution and the estimated time at AMANDA
are
given.
|
Satellite and reference |
(X,Y,Z) of satellite (km) |
Time resolution (ms) |
Trigger time (h:m:ss)
and Estimated time at Earth (ss) (delay in ms) |
|
(-1.5997e5,97945,19671) |
5.48 |
21:30:26.35 -> 26.71 (361.884) |
|
|
(-72175.2453,-72233.5599,110158.1196) |
10-50 |
21:30:26.55 -> 26.88 (331.146) |
|
|
? no answers to emails… |
1 |
|
|
|
(5644.1,-4062.57,-100.219) |
8 |
21:30:26.64 -> 26.64 (0.66) |
|
|
8000 km from centre of Earth 7000 km Sunward of Earth’s centre |
|
21:30:26.124 -> 26.15 (26.68) 21:30:26.468 -> 26.49 (23.34) |
|
|
We consider this paper unreliable |
Detection of signal reflected by
Moon (time not reliable since
inconsistent in the paper Delay time 508.6 ms |
256 |
21:30:29.303 inconsistent with Tcoronas = TWind + 7.69s = 21:30:28.22 by 1 sec 21:30:20.53 -> 25.62 (508.6) |
In summary: the first time at
Earth
is 26.15 s from Cluster 4 and the last is 26.88 s for INTEGRAL so the
time
difference between times at Earth for various satellites is 0.73 s.
If we assume a spike duration
of 0.6 s
and that all photons that produce the hard E^-1.47 detectable component
are
emitted in the spike, then 0.73+0.6 = 1.33 s
We cannot assume a time
window less than
this value and with no loss on the MDF we can safely take a 1.5 s time
window
for this analysis.
More details can be found in J. Dumm’s talk.
SWIFT
GEOTAIL
