Data Reduction
Since there
are no spatial or
temporal cuts on the data, eliminating as much background as possible
becomes extremely important. Cuts have been developed using five
runs taken from throughout the year.
Real data in the plots below is taken from these five runs, which are
not to be included in the actual analysis in order not to violate
blindness.
Data reduction is performed in 3
steps. The first of these is the standard high energy filter,
which requires nhits for an event to be above 160 and at least 72% of
OMs with hits to have at least two hits. The second step is a
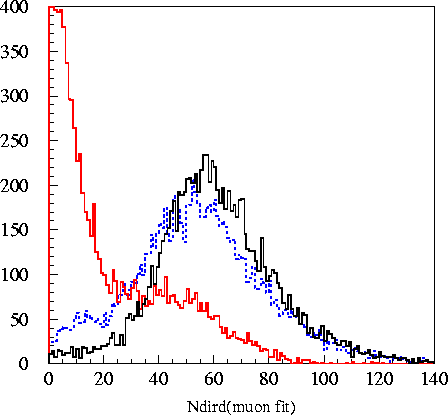
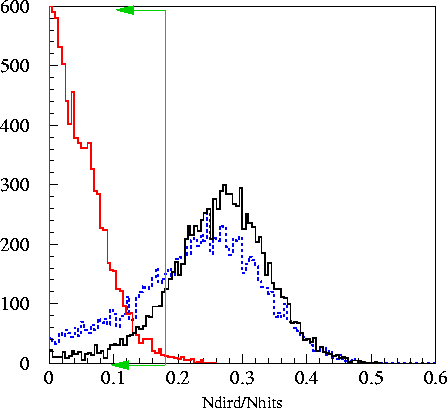
loose cut on the ratio ndird(muon
fit)/nhits. Plots below show ndird and the ratio of
ndird/nhits.
Obviously, the number of direct hits along the muon track is higher for
muonic background events than the cascade signal, allowing the
elimination of a significant (~93%) portion of the remaining
background. The advantage of taking the ratio over simply making
a cut on ndird
itself is that energetic signal events tend to have a large ndird value
simply because of their large total number of nhits. Dividing
by nhits moves this bump of higher nhits event back down, separating it
from background. While there is significant disparity between
Monte Carlo predictions
and the real data, the cut is taken far enough away from the signal MC
that even significant disparity between actual signal and the signal
Monte Carlo would not result in a loss of many signal events. The
cut at .18 is shown in green.
Legend: _______________ - real
data
(background) _______________ - Tea Monte Carlo
(cascade
signal) _
_ _ _ _ _ _ _ _ _ _ -
pCorsika
(background Monte Carlo)
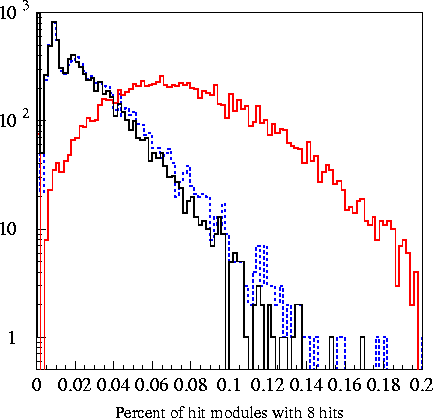
The final step in data reduction is a 6-variable
support vector machine. A support vector machine works in a
manner similar to a neural network, finding an n-dimensional cut based
on the signal and background input variables. The specific
software used was SVMlight.
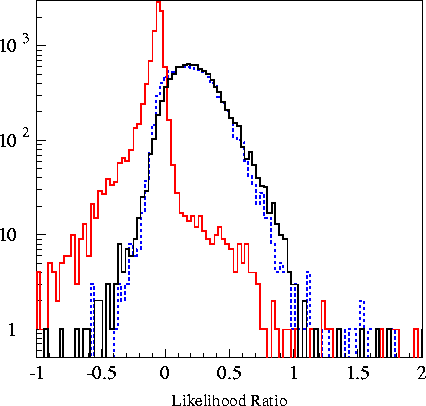
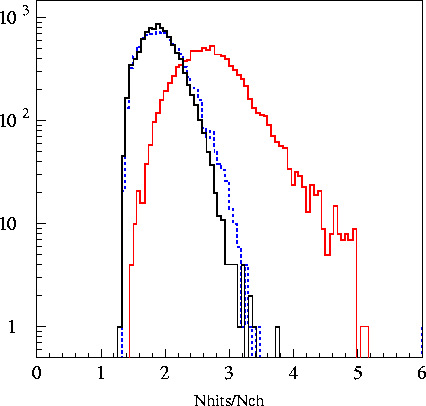
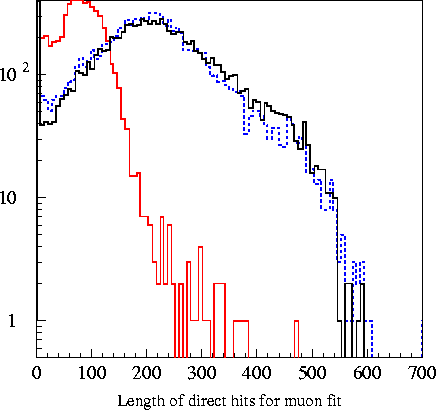
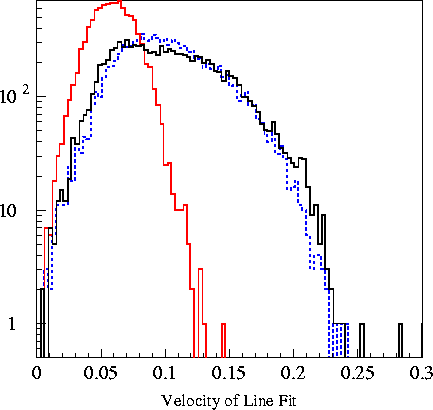
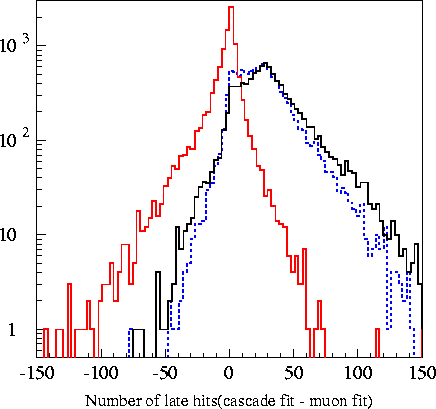
Plots of the 6
variables fed into the machine are found in the plots
below. The
Likelihood Ratio is the log-likelihood of an event being a
cascade minus the log likelihood of that event being a muon.
Legend: _______________ - real
data
(background) _______________ - Tea Monte Carlo
(cascade
signal) _
_ _ _ _ _ _ _ _ _ _ -
pCorsika
(background Monte Carlo)
The output for
a support vector
machine produced with these six inputs is shown below to the
left. In an SVM, one always cuts at 0 in the support vector
machine output
variable. Negative always means background, positive always means
signal. To cut tighter, one
decreases a variable called a "cost factor" (set to a value of 1 in the
sample SVM below) and re-trains the support vector
machine. The agreement between background MC and data
seems to be
better in the SVM output variable than in the six individual
variables. Optimization of the support vector machine cut is
discussed under Final Cut Selection.
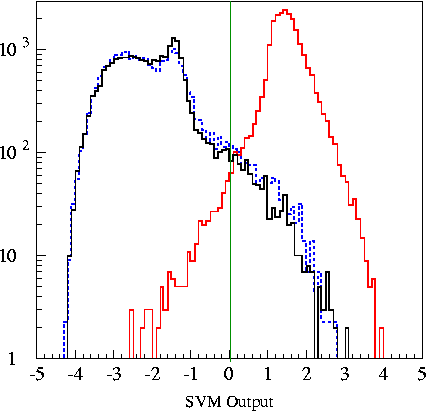
Legend:
_______________ Black - real
data
(background) _______________ Red
- Signal Monte Carlo
_
_ _ _ _ _ _ _ _ _ _ Blue
-
pCorsika
(background Monte Carlo)
Back
