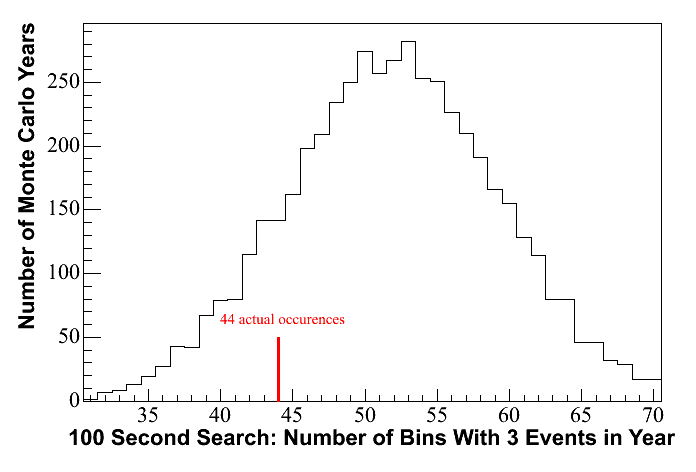
The maximum number of
events observed in any bin in the 100 second search was 3 events.
This is a slight downward fluctuation from expectation: the maximum
number of events in any bin is predicted to be 4 over 75% of the
time. There were 44 total time windows throughout the year with 3
events, which is well within the range of expectations. The plot
below shows the breakdown of the number of bins with 3 events in a year
according to Monte Carlo.

In the 1 second search,
the maximum number of events observed in any bin was also 3. The
most probable value for a maximum in this search was 2, but the odds of
getting 3 or more events just from background fluctuations in a bin are
20.1%, so this does not represent a statistically significant
fluctuation. The sole bin with 3 events occurs on April 29th, in
run 3202. This is neither in coincidence with a gamma-ray
detection nor with a bin containing 3 events in the 100 second search.
The upper limit on flux
from an ensemble of 667 bursts is ~2 X 10⁻⁶ Gev/cm2ssr
based on the 100 second search, before systematics are
taken into account.
Original Unblinding page:
Data
Processing and Cuts
Run Selection Criteria
Low Level Filtering
Data
Reduction
Flarechecking
A
Note on Reproducibility
Final Cut Selection
Additional Tests For a Significant Signal
Performance
of Analysis
Sensitivity
Checks and Comparisons on Sensitivity
Stability
Check Plots
Cascade
Effective Volume and Neutrino Effective Area
General Discussion
I am
proposing to unblind the 2001 data set to perform a rolling
search for a signal consistent with neutrino emission from a gamma ray
burst.
The
concept
of the rolling search is a
straightforward one: simply scan through all the data in a given
year and search for a significant signal above background during a
fixed time interval at any time
during the year. The proposed rolling search is to be done in
2001
using the cascade channel and optimizing on a Waxman-Bahcall broken
power law energy
spectrum with break energies at 105
GeV and
107 GeV, consistent with expectations for a
GRB neutrino signal from prompt emission. The signal Monte Carlo uses
neutral current
interactions for all three neutrino flavors and charged current
interactions for electron and tau neutrinos. The
specific method employed is to start at each event that survives cuts
and
check in a 100 second and 1 second time window following this event for
other
surviving events. Since a new search window is started at every
surviving event, it is guaranteed that one will not miss a significant
clumping of events. The significance of the largest cluster of
events occuring during the year for both analyses will be
evaluated. We will also check for two or three independent upward
fluctuations which achieve a considerable level of significance when
taken together,
and for coincidence of a large cluster of events coincident with IPN3
(third
interplanetary network) satellite
detections.
The
rolling
search is complimentary to other GRB
searches conducted with AMANDA. Because there are no temporal or
spatial constraints
for the rolling search as in the satellite-coincident GRB searches such
as those conducted by Kyler, Mike
and Ignacio,
multiple events within an individual fixed time window are required for
a detection, a
disadvantage compared to satellite-coincident searches. However,
it is
clear that the
satellite-coincident searches miss a very large percentage of GRBs
which occur. This is especially true in the post-BATSE era,
including 2001, the data set being used for this search, because the
remaining IPN3 satellites catch only a fraction of the bursts that
BATSE detected. Therefore, the set of GRBs for which the
rolling search can look is larger than is possible for a
satellite-coincident analysis. In addition to the possibility of
detecting
a GRB missed by the satellite network, the rolling search may be
capable of detecting gamma-ray dark phenomena, so
the possibility of discovering new physics exists. Examples of
phenomena
without detectable gamma-ray signatures include neutrinos from "choked"
gamma-ray dark
bursts and neutrinos from mildly relativistic jets in non-GRB
supernovae. Although both of these phenomena have neutrino energy
spectra predictions that peak below energies to which this analysis is
designed for, signal retention is still non-negligible for these
phenomena (about 20% as efficient as for prompt emission
spectra). In the future, it may be worth pursuing a new set of
cuts which is designed for these lower energy phenomena, but the
current analysis is optimized for high energy (~100 TeV) neutrino
emission.
We will
conduct two simultaneous searches, one with
a rolling time window of 1 second and one with a rolling time window of
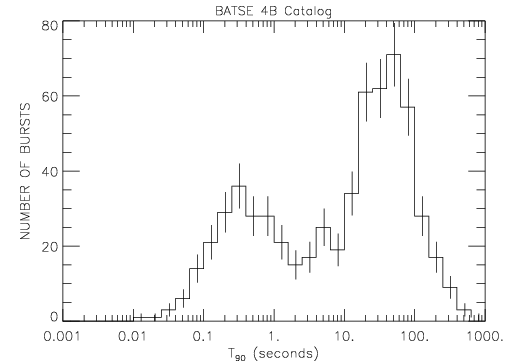
100 seconds. This is because the duration of gamma ray bursts
follows a bimodal distribution, with one peak at times below 1 second
for "short" bursts and the other, somewhat larger peak for "long"
bursts. This bimodal distribution can be seen below for bursts
from the BATSE catalog. Although a small percentage of bursts
have durations longer than 100 seconds, this length was found to be the
best trade-off between minimizing background and maintaining
signal.
I. 2 or 3 Separate Marginal
Detections
In the event that
we fail to detect a 5
sigma signal from an individual burst, we can also check for 2 or 3
independent "borderline" detections. These would result from 2 or
3 bursts happening at different times throughout the year which don't
generate enough events to be an unambiguous signal on their own, but
when taken together, have a large statistical significance.
Checking for these causes a
small reduction in the significance of an observation because it
increases the "trials factor". However,
making this check does
increase our odds of seeing something. An exhaustive pre-defined
list of the combinations resulting in greater than a 5 sigma
significance follows:
| combination of events (total
number of independent bursts in parentheses) |
chance probability due to
background fluctuation |
| 8 or more events in a single bin
in the 100 second search (1) |
1.12 X 10⁻⁷ |
| 5 or more events in a single bin
in the 1 second search (1) |
1.65 X 10⁻⁷ |
| One bin with 7 events and one
bin with 6 or 7 events in the 100 second search (2) |
5.15 X 10⁻⁹ |
| Two or more bins with 4 events
in the 1 second search (2) |
5.15 X 10⁻⁸ |
| One bin with 7 events in the 100
second search and one bin with 4 events in the 1 second search (2) |
1.97 X 10⁻⁹ |
| Two bins
with 6 events and one other bin with 5 or 6 events in the 100
second search (3) |
1.15 X 10⁻⁸ |
| One bin with at least 6
events and one bin with 5 or 6 in the 100 second search and one bin
with 4 events in the 1
second search (3) |
4.45 X 10⁻⁹ |
II. Comparison with IPN3
burst
detection times
In the
event that we obtain 7 events in a bin from the 100 second
search or 4 events in a bin from
the 1 second
search, we will then compare the time at which this upward fluctuation
occurs with the times of GRBs identified by the third interplanetary
network, IPN3 .
If the duration of the burst is found to overlap with
the duration of the time window with this high number of events, this
will
then be a statistically significant observation. The thresholds
of 7 events and 4 events were selected because the probability of this
many events in a time window occurring due to background fluctuations
and in coincidence with a satellite observation is sufficiently small
that we can claim 5 sigma significance if this occurs. For
example, in the 1 second search, the odds of getting 4 or more events
in a time window at some point during the year are 2.3 X 10⁻⁴.
The odds of this time window occuring in coincidence with a GRB
detection are 1.1 X 10⁻⁴, so the total odds of getting 4 or
more events
in coincidence with a GRB are 2.3 X 10-4 * 1.1 X 10-4
= 2.5 X 10⁻⁸, considerably below the 5 sigma threshold of 6
X 10-7. Lower numbers of events in coincidence
with a GRB do not meet this standard for significance, but assuming we
fail to make a 5 sigma discovery, we will check for a cluster of 6 or 5
events in the 100 second search coincident with a satellite detection,
as these would merit a significance
greater than 4 sigma or 3 sigma, respectively.
I have compiled a list of 78 detections
by the IPN network. Unfortunately, the majority of these triggers
are from the Konus-Wind experiment and do not have reliable durations
(or localizations, although this isn't a problem in my case). For
those bursts for which other information is not available, I have
estimated durations based on lightcurves provided by Konus-Wind.
These estimates are probably systematically lower than BATSE T90
times, based on comparisons with
the BATSE sample from Ignacio's analysis. The durations of many
of these bursts are probably not reliable enough for a
conventional satellite-coincident analysis, but will be used here as
they are the
only thing available. An OpenOffice spreadsheet
is available with burst times and approximate durations. A time
window
will be defined as in coincidence with one of these bursts if any
portion of the bin overlaps with any portion of the burst, allowing 1
second before the trigger.
| Scenario resulting in a
discovery of at least 5 sigma significance |
Chance Probability Due to
Background Fluctuation |
| 8 or more events in a single bin
in 100 second search |
1.12 X 10 -7 |
| 5 or more events in a single bin
in 1 second search |
1.65 X 10⁻⁷ |
| Combinations of 2 or 3 bursts |
0.75 X 10⁻⁷ |
| 8 events from 100
second search in coincidence with satellite detection |
0.08 X 10⁻⁷ |
| 5 events from 1 second
search in coincidence with satellite detection |
0.25 X 10⁻⁷ |
| Total |
3.85 X 10⁻⁷ |
The observation of any of the above scenarios would therefore
have a
significance of greater than 5 sigma (6 X 10⁻⁷probability)
after accounting for all trials. Of course, no discovery would be
claimed until after the events have been examined and are determined to
look like reasonable signal events. Similar charts for
significances of 4 sigma and 3 sigma can be found by clicking this link. While a statistical
significance of 3 or 4 sigma would not be sufficient to claim
discovery, it would at least be an interesting observation.
Sensitivity for this analysis is determined to be 2.7 X 10⁻⁶ GeV/cm2ssr, assuming a diffuse flux
resulting from 667 bursts, derived from the rate of observations by the
BATSE satellite, of which ~425 are during the on-time for
this analysis. This is an all flavor limit, assuming a flux
ratio of 1:1:1 at Earth. This result does not take into account
systematics,
although deadtime of 21.4% has been included. This
calculation also assumes an expected event rate that varies from burst
to burst according to the predictions in Guetta et al. For more
information on this "Guetta" distribution, click here. If one
assumes a "flat" distribution, with equal flux
per burst, one
obtains a sensitivity of 1.3 X 10⁻⁵ GeV/cm2ssr.
The improvement from using the more realistic distribution
results from the fact
that one is more likely to obtain a cluster of events from the same
total flux when a large percentage of that total flux is contained
within a few bursts than when it is spread out evenly. An
overview of the procedure used to do my sensitivity calculations can be
found here.
I
supposed that I
had a situation identical to Ignacio's year 2000 analysis: 74 bursts
with known durations and times, with total on-source time equal to
2822.5 seconds. This hypothetical situation allows a useful check
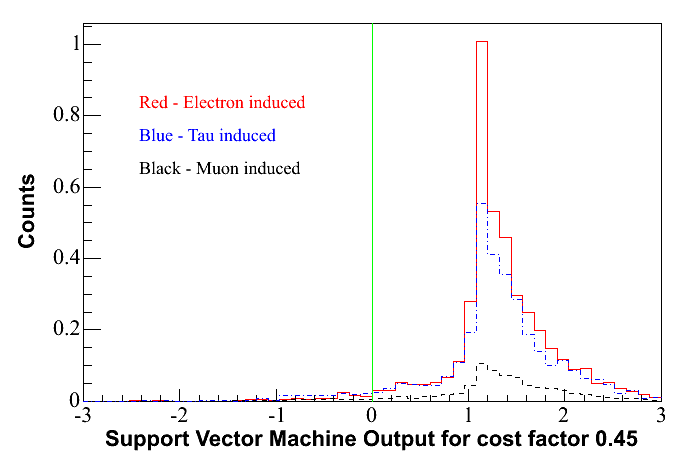
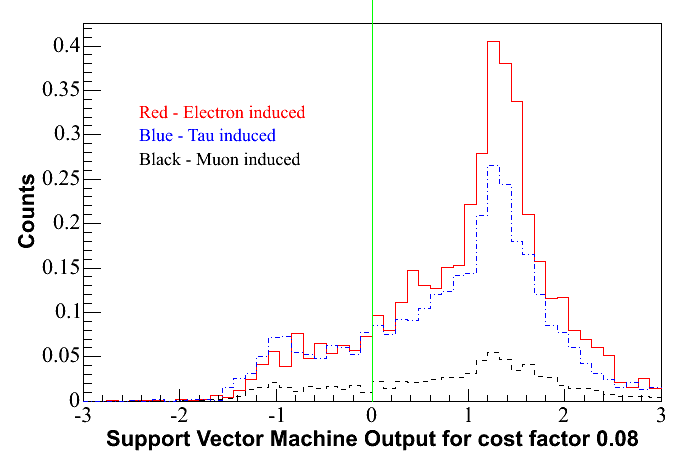
on my cuts and sensitivity calculations. I re-optimized my
support vector machine cut (using average background rates) but kept
the filtering the same, counting total events during all 74 periods,
rather than clusters as in my rolling search. Using my cuts, my
optimal sensitivity
was 6.2 X 10⁻⁷ GeV/cm2ssr (with deadtime
correction) for a satellite-coincident GRB search with 74 bursts.
Since Ignacio's sensitivity of 9.5 X 10⁻⁷ GeV/cm2ssr
is 30%
above his
optimal sensitivity (because he optimized for discovery) and because
one generally expects somewhat better sensitivities from 2001 analyses
compared to 2000 analyses due to the larger number of OMs that could be
used, these values are within the range of agreement one
would expect. My effective volume is considerably larger (even
adjusting for differences in year) because my cuts were explicitly
designed to maximize effective volume by utilizing uncontained as well
as contained events, but this also allows in considerably more
background, increasing my average upper limit, so the net
effect on sensitivity of choosing this method ultimately appears to be
fairly minimal, at least in this case.
II.
Back-of-the-envelope
sensitivity check
Mathematically, a 90% C.L.
sensitivity calculation is different than determining the flux at which
one has a 90% chance of seeing something above background.
However, one expects they should generally have similar values.
The following is a back-of-the-envelope check which calculates the flux
at which one has a 90% of seeing a fluctuation above background
assuming 425 identical
bursts, which should correspond roughly to the sensitivity of
1.3 X 10⁻⁵ GeV/cm2ssr which one obtains when
assuming equal flux for each burst.
To have a probability of .9
of
detecting a signal, one has a .1 probability of failing to detect
a signal. If there are 425 equivalent bursts, then statistically,
the odds of failing to detect any bursts is just the product of the
probabilities of the failure to detect each burst individually.
Thus:
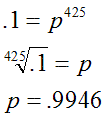


After correcting for
deadtime,
one obtains 1.3 X 10⁻⁵, identical to the sensitivity
determined for the flat model.
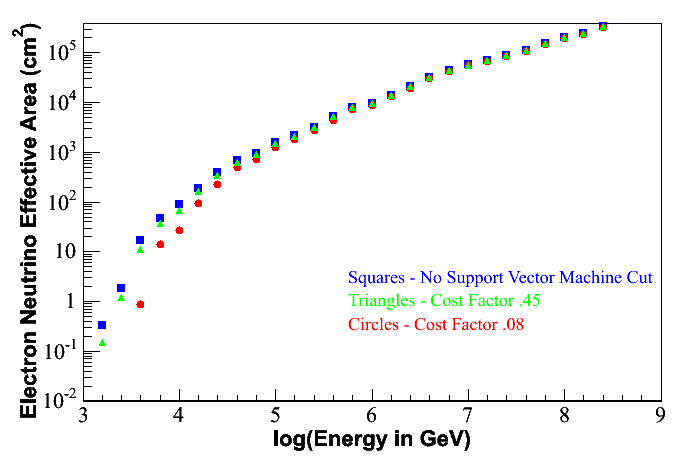
Cascade Effective Volume and
Neutrino Effective Area plots are shown below for electron neutrino
events. Plots for tau events are
also available, but they look very similar to the electron neutrino
plots. Muon neutral current events also
contribute, but these are a small percentage of the total signal.
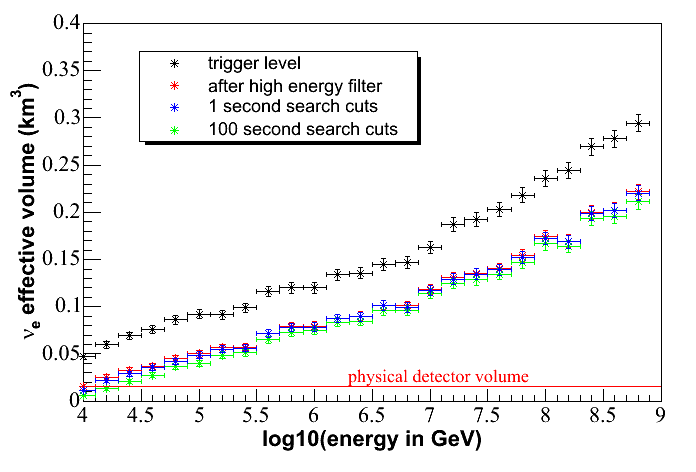
The effective cascade
volume plots demonstrate the
advantage of utilizing uncontained events, especially at high
energies.
