 equation 1
The observable in this analysis
in the largest number of events observed in any bin during the entire
year (Nlarge) rather than a simple number of signal
events. This
means that determining sensitivity is slightly more complicated because
one cannot use standard Feldman-Cousins look-up tables to determine
average upper limits. As in other AMANDA analyses, sensitivity
was calculated using the standard
 equation 1
where mu90-bar is
the
average upper
limit and ns is the expected number of signal events.
The average
upper limit was determined , exactly as the name implies, by the
formula
 equation 2

Based on
Monte
Carlo simulations, the probability of obtaining Nlarge of 3
is 21.3%,
the probability of obtaining Nlarge of 4 is 75.4% and the
probability
of obtaining Nlarge of 5 is 3.2%. Thus, the average
upper limit
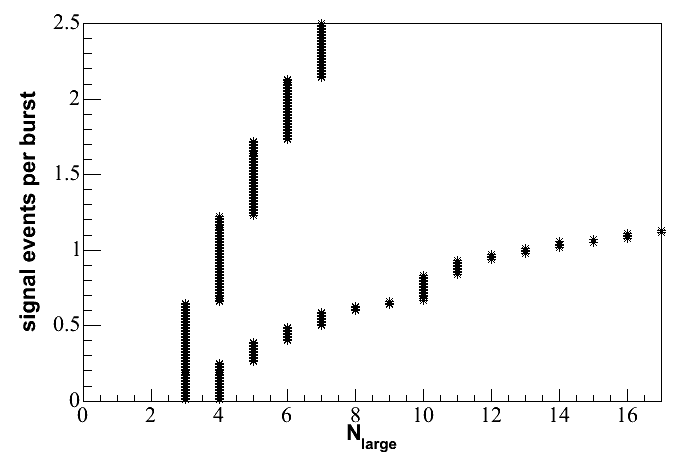
(equation 2) is approximately .213*.65 + .754*1.22 + .032*1.73 = 1.11
events per burst. (This is the probability for each Nlarge
multiplied by its corresponding upper limit from the above plot.)
This approximate calculation ignores the small contributions from
Nlarge of 6 and higher. As is typically done for
AMANDA analyses,
to obtain the sensitivity, one then simply finds the flux such
that the expected number of signal events (ns) matches the
average upper limit just obtained (mu90 = 1.11) so that the
fraction mu90/ns drops out of equation 1.