Stability
Plots
Demonstrating
the
Poissonian Nature of the background
The plots
below were created
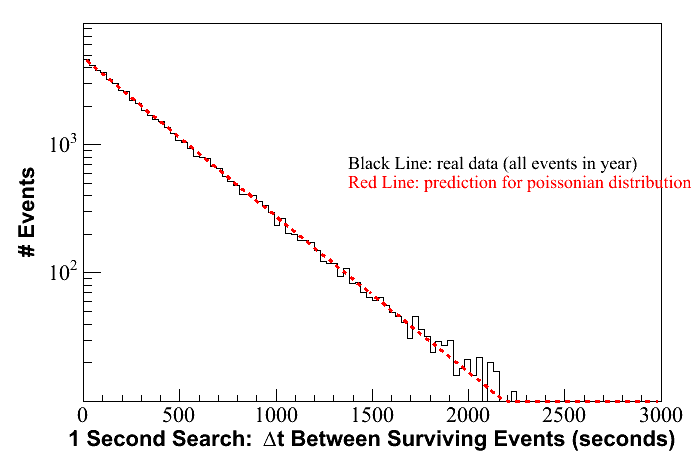
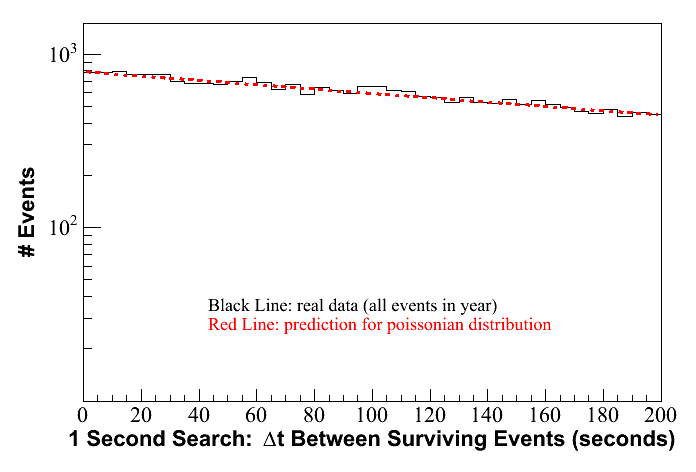
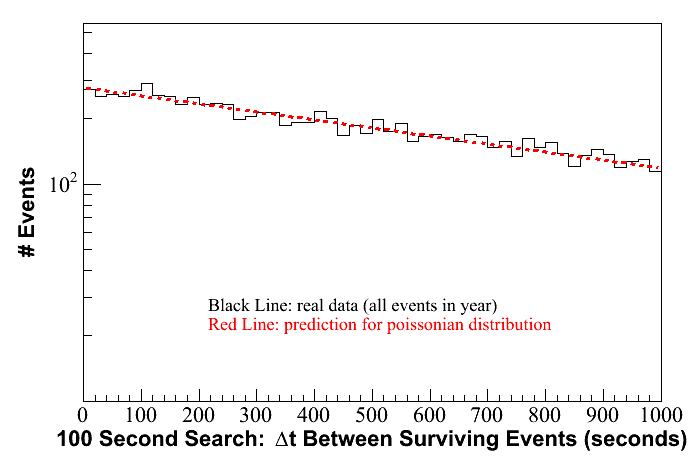
using the year 2001 data. Each plot shows the time between
each event that survives after all cuts and the previous surviving
event
for the full year of real data, plotted in black. This is
compared to the red line, which shows the predicted shape based
on a Poissonian model. In addition
to a large time scale spectrum to show that the overall shape is
approximately the same as the Poissonian expectation, plots showing the
distribtution for smaller time intervals are shown to demonstrate that
the number of events with the delta-t values revelant to this analysis
are roughly as expected.

Detector Stability
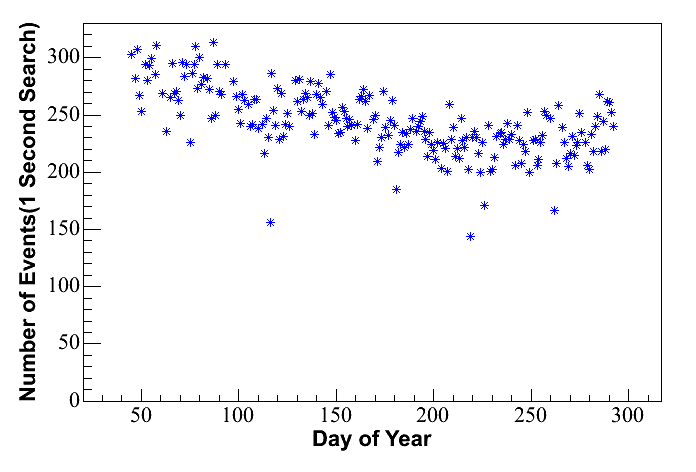
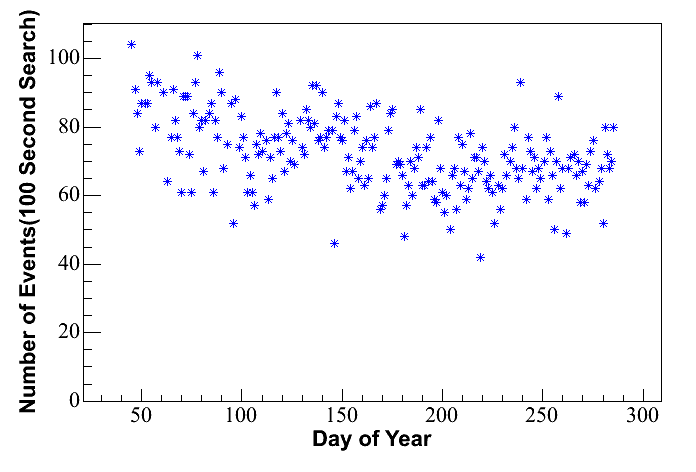
The plots below show rates
after cuts for both searches, demonstrating a reasonable level of rate
stability. Seasonal rate effects are visible in both plots.
Because of this variation in rates, whenever toy Monte Carlo was used
to make predictions, the year was divided into five periods and the
average rate for each period was used when generating MC for days in
that period.
Number of bins with two events
Poissonian statistics predicts that there
should be
bins with two events in them multiple times a
year in both searches. 10 000 years of toy monte carlo
were run
based on Poissonian event distributions. The distribution of the
number of
two-event bins in each year is shown in the plots below for the 1 and
100 second searches, with the number occuring in the actual experiment
marked in red. Both numbers are within the expectations based on
Monte Carlo. After unblinding, similar plots
will be produced for
triplets and higher multiples.
