Flarechecking

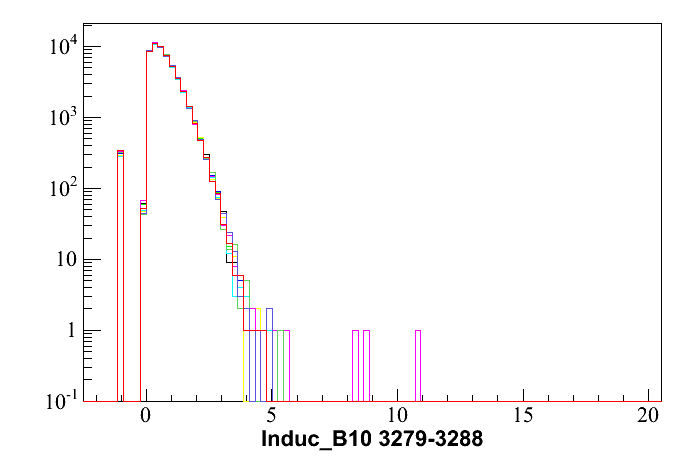
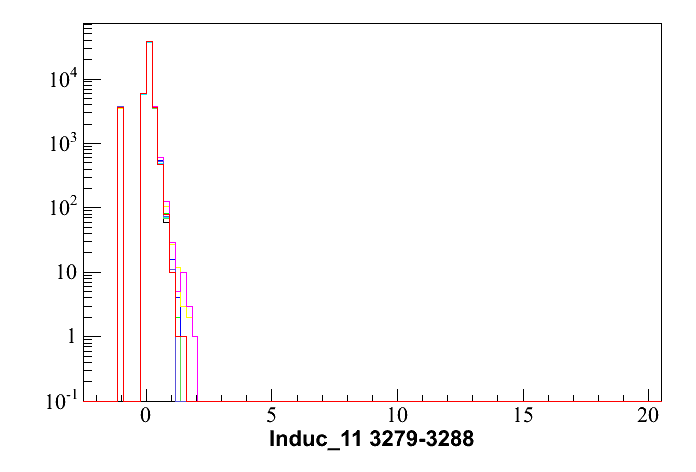
    Arvid Pohl's flarechecker has been run on all files to be used in this analysis.  Flarechecking was done at the high energy filter level, but before any other cuts.  Based on observation of the distributions, the flare cut applied will be Induc_B10<7 and Induc_11<5.  This follows Arvid's advice of starting with the most useful variable, applying a 1 dimensional cut safely beyond the normal distribution of events, and moving on to the next distribution until no flares appear to still be present.  After these two cuts are taken, no events clearly outside the expected distributions remain for the other flarechecker variables.  Results are consistent with previous observations that 2001 was a year with few flary events.   With the exception of run 3399, which shows abnormal behavior in Induc_B10, these flare cuts remove only 15-20 events from the high energy sample total for all runs used.  Due to its unusual flare rate, I will omit run 3399 from the analysis.  Flare checker results for the two variables used are shown below for nine runs superimposed.  Three events will be cut from run 3284 (the pink run), all other events are consistent with the expected distribution.  The rest of the plots are pretty similar, but for anyone curious these two variables are plotted for the whole useful data set roughly ten runs at a time here and here.


Inducb1.small.3279-3288.gif

Induc11.small.3279-3288.gif


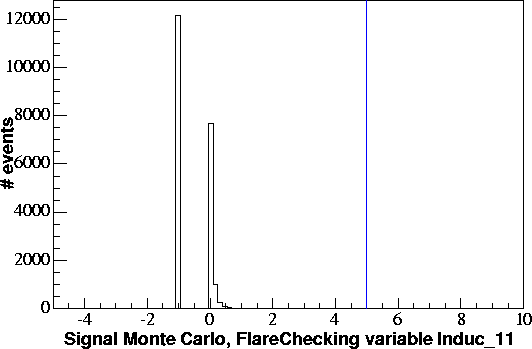
The two plots below show the flarechecker applied to signal Monte Carlo.  My flare cuts are indicated by blue lines.  Clearly, the Monte Carlo indicates signal is unlikely to be mis-identified as a flary event.  The values of -1 are events, generally high energy events, which the flarechecker cannot classify but are kept because they are not known to be flary. 
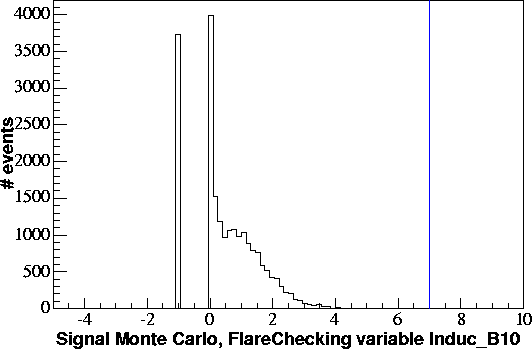
mc.indb10.gif     mc.ind11.gif

Back