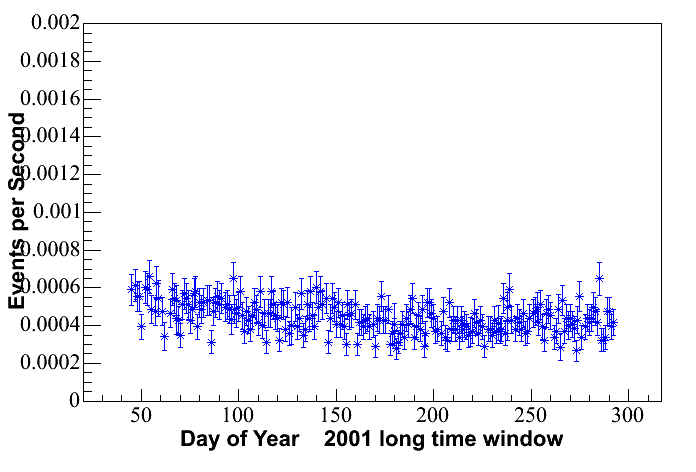
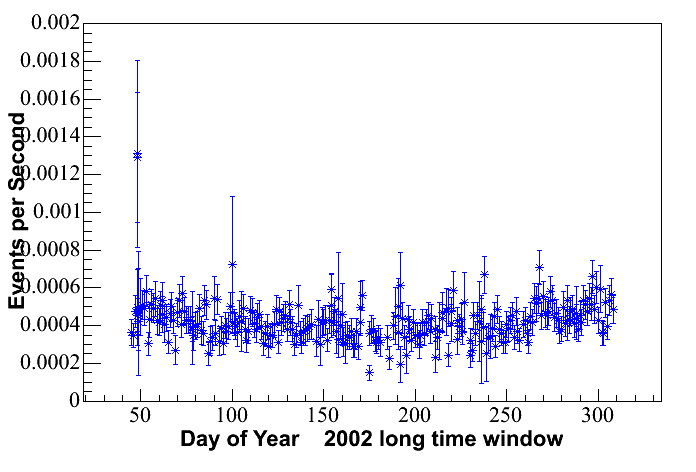
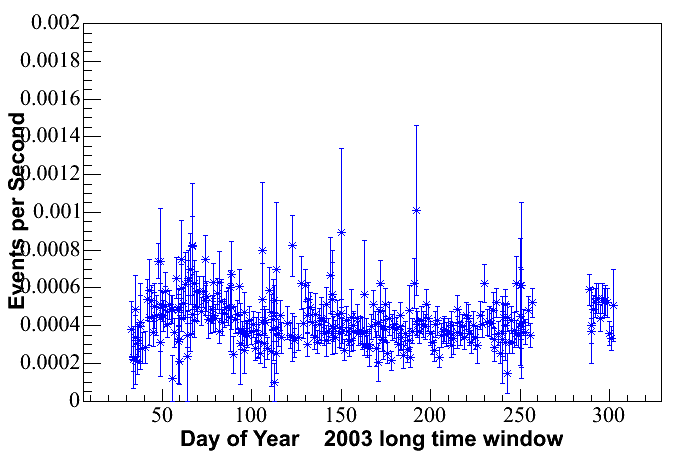
Background Rates For Long Time Window
The plots below show the event rate of events surviving cuts for
each run, showing good detector stability. Predictions based on
Poissonian
statistics split each year into 5 periods and use separate average rate
constants for each period to account for seasonal variations.


Home


