Unblinding Proposal For 2001-2003 Rolling Cascade Search

Unblinding Results

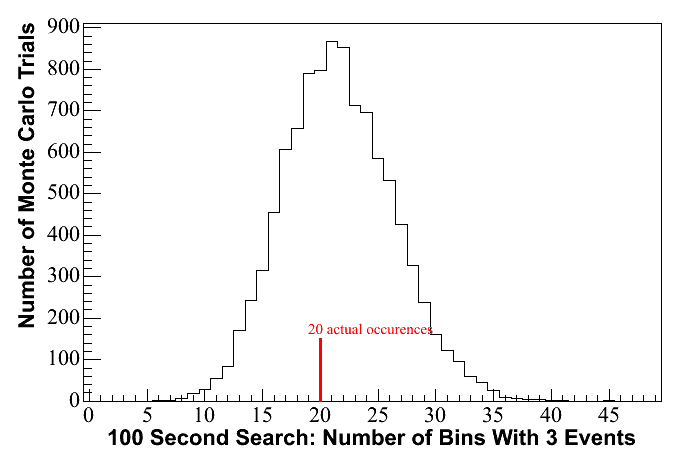
No signal was found.  The results of the 3 year unblinding are quite consistent with background expectations.  The maximum number of events in any bin in the 1 second time window search was 2, a result that was 70.1% probable assuming only background.  The maximum number of events in any bin in the 100 second search was 3, a result that was 75.3% probable assuming only background.  The total number of bins with 2 or 3 events is also quite consistent with the background rate assuming Poissonian statistics.


Short Window Search: Distribution of total number of windows with 2 events in full sample determined by 10000 cycles of toy Monte Carlo. Actual results are marked in red.
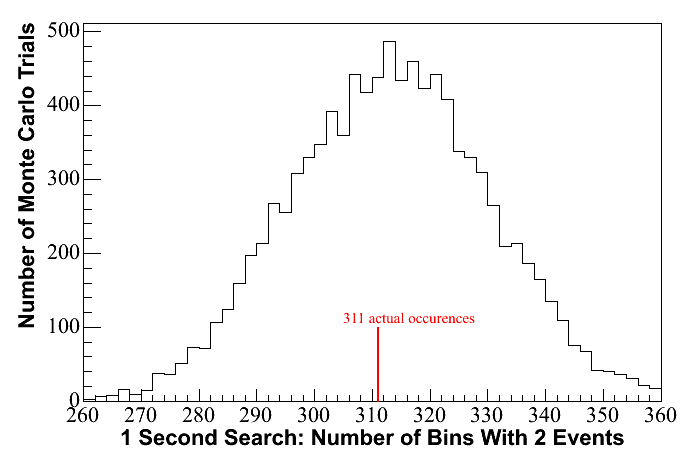
numberof23year1s.gif


Long Window Search: Distribution of total number of windows with 2 events or 3 events in full sample determined by 10000 cycles of toy Monte Carlo.  Actual results are marked in red.
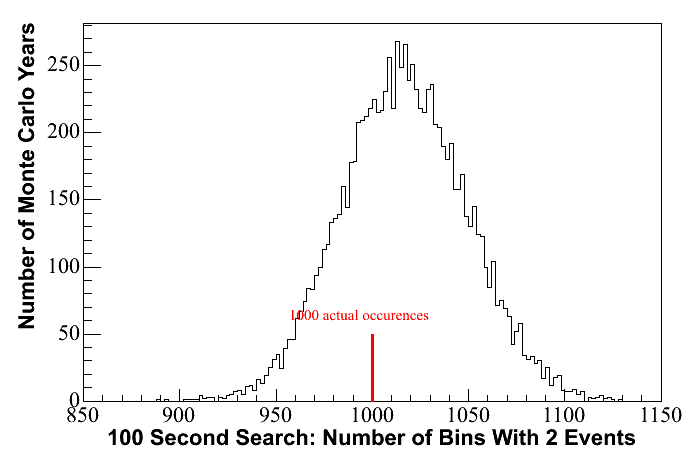
numberof23year.gif

numberof33year.gif


Menu

Overview
Motivation
Changes Between Previous Analysis and This One
File Selection/Filtering/Monte Carlo
Data Reduction
Flarechecking
Final Cut Selection
Stability Plots
Additional Tests for the Presence of a Signal
Total Probability of a False Detection


My original unblinding proposal for the 2001 data set is accessible here.  Longer discussions of several issues such as sensitivity and optimization for discovery are found there, and these principles have not changed for this analysis.  The current proposal, however, is intended to be self-contained, and is probably long enough by itself.  Links to plots and more details are available throughout.  Internal links are in blue, external links are in red.


Changes made since previous iteration of this proposal:

Time windows have been returned to 100 and 1 seconds and the support vector machine cut variables have been returned to the same values used in 2001.  This was done to avoid blindness issues arising from re-analyzing the 2001 data with different cuts.  The 2001 data now uses the same cuts as the previous unblinding.  The additional years, 2002 and 2003, use the same cuts except for a change in the definition of the direct hits cut (which is not a part of the support vector machine).  All plots and numbers now reflect these changes.

Proposal

I am proposing to conduct the search described below on the 2001, 2002 and 2003 data sets.

Overview


    The concept of the rolling search is a straightforward one: simply scan through all the data in a given year and search for a statistically significant signal within a fixed duration.  The proposed rolling search is to be done with the 2001, 2002 and 2003 data sets.  This is during the period after BATSE and before Swift, during which a large percentage of GRBs were undetected.  It uses the cascade channel and optimizes on a Waxman-Bahcall broken power law energy spectrum with break energies at 105 GeV and 107 GeV, consistent with expectations for a GRB neutrino signal from prompt emission. The signal Monte Carlo uses neutral current interactions for all three neutrino flavors and charged current interactions for electron and tau neutrinos. 
    The specific method employed is to start at each event that survives cuts and check in a 100 second or 1 second time window following this event for other surviving events.  Since each surviving event starts a new window, it is guaranteed that one will not miss a significant cluster.  The significance of the largest cluster of events occuring during these years will be evaluated for both time windows.  We will also check for two or three independent upward fluctuations which achieve a considerable level of significance when taken together, and for coincidence of a cluster of events with IPN3 (third interplanetary network) satellite detections.
    This analysis was performed on the 2001 data set in September 2005.  No signal was observed, and results were consistent with the expected background.  This unblinding proposal concerns the extension of this analysis to the 2002 and 2003 data sets.

Motivation

    Although the IPN3 satellite network was detecting GRBs during the period 2001-2003, the BATSE detector aboard CGRO ceased operations in early 2000 and the Swift satellite did not launch until late 2004.  It is clear that the majority of GRBs went undetected by gamma-ray detectors during this period, since the IPN3 network detects GRBs at a lesser rate than BATSE did (nominally about a GRB per week for the IPN3 network compared to about a GRB per day for BATSE), and BATSE itself had only ~2/3 sky coverage.  This search is therefore designed as a complement to satellite-coincident searches which looks for a transient neutrino signal without relying on a satellite trigger.  In addition to conventional GRBs, there is the potential to identify other transient phenomena which may be visible by neutrino detection but not via photons.  An example of such a phenomenon is the so-called "choked" GRB, which would emit neutrinos in a fashion similar to precursor neutrinos from a normal GRB, but would fail to actually become a gamma ray burst because the jet was unable to push through the stellar envelope.


Summary of Changes Between Previous Analysis and This One

The analysis remains conceptually unchanged from the previous unblinding, but there have been a few modifications:

1. Most obviously, there is 3 times as much data, which requires tighter cuts to keep the chance of upward background fluctuations sufficiently low.
2. Flarechecking cuts have changed.
3. Data reduction has been slightly improved by replacing the cut Ndird(muon fit)/Nhits with (Ndird(muon fit) - Ndird(cascade fit))/Nhits, which shows improved separation between signal and background.   This change  was made only for 2002 and 2003 in order to keep 2001 cuts the same as in the original unblinding.
   

Run/File Selection

Runs were required to be at least 4000 seconds long and taken only from the February to October period when the station was closed to avoid data spikes from human interference.  Bad files identified in the Zeuthen point source analysis's filtering page http://www-zeuthen.desy.de/%7Ebernardi/point/combined00-03/Processing.html were removed.  Runs 7219 and 7249 in the 2003 data set were removed entirely because of multiple gaps resulting from bad files.  Run 3399 was removed from the 2001 analysis due to abnormal behavior in the flarechecking variables.  The livetime used for 2001 is 183.4 days with 21.3% deadtime, the livetime for 2002 is 193.8 days with an average 15.0% deadtime and the livetime for 2003 is 185.2 days with an average 15.3% deadtime.

Reconstruction and Low Level filtering

The 2001 data uses the Madison filtering high energy stream.  The 2002 and 2003 data sets use Henrike Wissing's filtering at Zeuthen.  The same fits, including upandel muon and cascade fits, were applied to all 3 years. 

Monte Carlo

dCorsika was used as background Monte Carlo and ANIS and Tea were both used as signal MC.  Filtering matches that used on the real data as closely as possible.  Thus, the Monte Carlo for the 2002 and 2003 samples were filtered in Sieglinde, while the 2001 Monte Carlo was filtered in Siegmund, just like the real data sets, even though this makes essentially no difference in the end result.

Data Reduction

Data Reduction is accomplished in 3 steps.
1.  High energy filter:  Events are kept if they have at least 160 hits and 72% of fired OMs have 2 or more hits
2.  loose Ndird cut
3.  Six variable Support Vector Machine Cut:  SVMlight is used to train a Support Vector Machine using the following variables.  Click on a variable to see plots for all 3 years.
    Nhits/Nch
    Velocity of the Line Fit
    Ldirc (muon fit)
    Likelihood Ratio (cascade to muon)
    Nlate(cascade fit) - Nlate(muon fit)
    Frac8
   
Flarechecking

Flarechecking cuts used in this analysis are as follows:
For 2002 and 2003 the cuts are Induc_b10 < 16, Induc_11 < 8, Missing < 14.   For 2001 the cuts are Induc_b10 < 16, Induc_11 < 8, and short_m < 14.  Plots showing cuts for all the flarechecking variables are available for 2001, 2002 and 2003

In addition, the top 1% of values were removed from the five distributions which did not show any selection effects at higher cut levels as per Arvid Pohl's flarech
ecking proposal.  Distributions for extended flarechecking cuts are available for 2001, 2002 and 2003.

Final Cut Selection

The analysis was optimized for discovery rather than sensitivity.  This was defined as determining the lowest possible neutrino flux such that there was a 90% chance of observing an event cluster with at least 5 sigma significance (the Model Discovery Potential method.)  As in the previous iteration of this analysis, the distribution of neutrino events per burst is modelled according to the predictions in Guetta et al

The support vector machines were trained independently for each year, since each year is slightly different.  A large number of support vector machines with varying cut tightness were trained for all 3 years, then matched to each other such that each year has the same average rate of surviving events.  The percentage of signal retained is no more than a few percent different for each year when this is used as the standard.

For the 100 second search, the optimal cuts result in an average background rate of 1 event per 2404 seconds and the percentage of signal retained by the support vector machine cut is 67% for 2001, 63% for 2002 and 65% for 2003 (weighted average of all 3 flavors).   For the 1 second search, the average background rate is 1 event every 427.5 seconds and the signal retention rates for the support vector machine cut are 92% for 2001, 90% for 2002 and 91% for 2003.  (Note that these signal retentions are just for the support vector machine cut stage, which must be multiplied by an additional factor of ~.64 to get signal retention relative to trigger level.)  A 5 sigma detection would require a cluster of 7 events in the 100 second search or 5 events in the 1 second search.

Happily, both of these choices are very close to the optimal sensitivity.  The sensitivity for this analysis is 1.62 X
10-6 GeV/cm2ssr for all flavors, assuming a rate of 667 GRBs per year based on the BATSE rate of detection and a 1:1:1 flavor ratio.  This number is consistent with the expectation of a 1/sqrt(3) improvement over the previous analysis resulting from a data sample roughly 3 times as large.  MDF and MRF plots for both the short and long searches are available here.

Stability Plots

The following plots demonstrating the stability of the data are available for each year in the 3 year sample:
Delta-t plots compared to Poissonian predictions:  long time window  
short time window
Background rates after cuts:                                 long time window   short time window

Additional Tests For the Presence of a Signal

I.  Marginal detections

Since GRB signals tend to be dominated by a few spectacular bursts, the analysis is setup to look for a single significant event.  However, we will also check for 2 or 3 separate clusters which are not themselves significant, but have a combined significance greater than 5 sigma when taken together.

In the absence of a discovery, we will also check for clusters with more marginal significance (3 or 4 sigma).

Click here for a complete list of scenarios.


II.  Coincidence with IPN bursts

If there is a larger-than-expected cluster of events, we will also check against the occurences of GRBs detected by the IPN3 network.  Any part of the GRB overlapping with the time window is counted as a coincidence in our calculations.  The set of bursts to be checked against includes roughly 80 to 90 bursts per year, many of which do not have well-determined durations.  For the majority of these bursts, the duration was estimated (by me) from the light curve obtained by the Konus-Wind satellite and is not guaranteed.  Where possible, the durations used in Kyler's IPN analysis are also applied here.   This is not a full-fledged satellite-coincident analysis, just an additional check made after obtaining the rolling search results.


The following checks for coincidence with a gamma ray detection will be made:

-A 6 event cluster from the 100 second search in coincidence with a GRB would have a significance greater than 5 sigma.
-A 4 event cluster from the 100 second search in coincidence with a GRB would have a significance greater than 4 sigma.

-A 4 event cluster from the 1 second search in coincidence with a GRB would have a significance greater than 5 sigma.
-A 3 event cluster from the 1 second search in coincidence with a GRB would have a significance greater than 4 sigma.

Total Probability of a False Detection

Summing the chance probabilities for all of the checks for discovery results in a probability below 6.2
X 10-7 (5 sigma significance)

scenario
probability
7 events in long time window
2.0 X 10⁻⁷
5 events in short time window
2.0 X 10⁻⁷
2 or 3 event combinations
1.2 X 10⁻⁷
IPN3 coincidence
0.2 X 10⁻⁷
Total
5.4 X 10⁻⁷

The odds of any of these scenarios overlapping given just background events, for example 7 events in a 100 second window which include 5 events in a 1 second time window, are sufficiently small that it is approximately correct to simply add the probabilities to obtain the total.
Similarly, the chance probability of any scenarios specified for 4 sigma significance totals 2.9 X 10⁻⁴ and the probability for any 3 sigma significance totals 8.7 X 10⁻⁴.