John Kelley, UW-Madison, May 2005
![]()
This analysis uses the same data set as the Zeuthen point-source analysis — 2000-03 AMANDA-II data with cuts optimized for sensitivity to an extraterrestrial muon neutrino flux from below the horizon. These cuts were specifically not optimized to an E^{-2} spectrum, and so is still appropriate for the softer spectrum hypothesized in this analysis.
This data set has been described in detail on the following web pages at Zeuthen:
Combined 2000-03 point source analysis [ifh.de]
Normalization and final cuts [ifh.de]
To replicate the final data set here, the level 4 data was copied from Zeuthen, and then the following steps were performed:
| Likelihood ratio | Jkchi[bayes64] - Jkchi[pandel] > (34 + 25 * (1
- Theta(x-0.15)) * (x-0.15)) |
| Smoothness | (abs(S_phit[pandel]) < 0.36) && (S_phit[pandel] != 0) |
| Paraboloid fit error | (180 / PI * (P08err1 * P08err2)^(0.25) < 3.2 - 4 * Theta(x-0.75) * (x-0.75)) && (P08err1 >= 0) && (P08err2 >= 0) |
| Flare variables | Flrshrtm + Flrndcb1 + Flrndc11 < 10 |
| Stability period | year 2000: (Gpsday >= 47) && (Gpsday <= 309) |
where (x = sin(Dec[pandel])) and Theta() is the unit step function.
The data sample was verified to be correct by comparing a list of event numbers with the official data sample from Markus Ackermann.
The livetime for each of these periods, as provided by Zeuthen, is:
Year / period |
Livetime (days) |
2000p1 |
58.9 |
2000p2 |
86.5 |
2000p3 |
51.6 |
2001 |
193 |
2002 |
204 |
2003 |
213 |
Table 2.2: Livetime for the combined 2000-03 analysis.
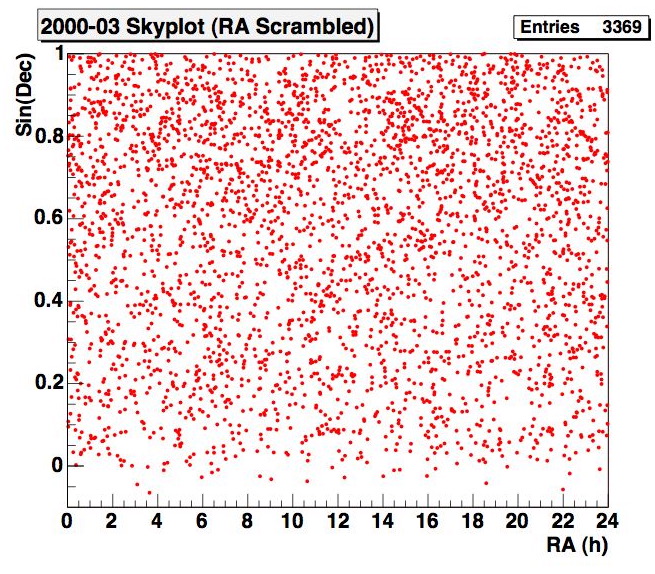
Here is a skyplot of the scrambled data:

Figure 2.1: Scrambled skyplot of 2000-03 data.
Level 4 nusim Monte Carlo files for each of the six periods above were also obtained and processed to the final cut level with the above procedure, excluding the flare cuts (shown not to affect our nusim) and stability period cuts.
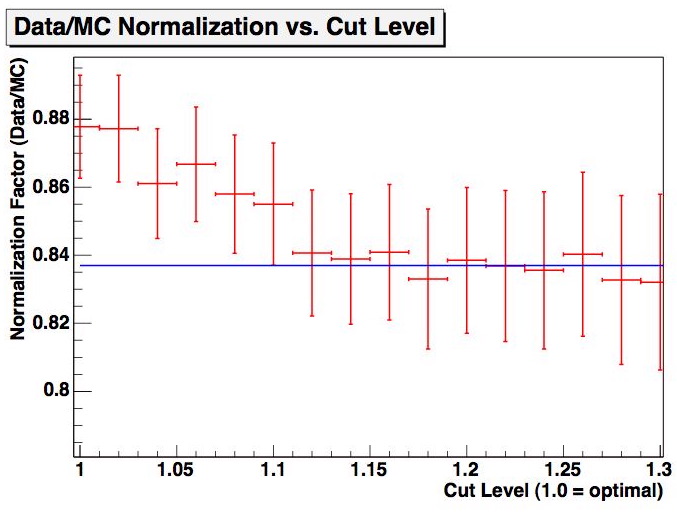
To check my nusim files and my weighting, I performed the standard data/MC normalization procedure — cuts on smoothness, likelihood difference, and paraboloid errors were gradually tightened until the data/MC ratio flattened out:

Figure 2.2: Data/MC normalization factor as a function of cut level.
My data/MC normalization factor was found to be 0.837, which is close to the value Zeuthen used of 0.83. This factor has been applied to both signal and atmospheric Monte Carlo for this analysis.