John Kelley, UW-Madison, May 2005
![]()
As mentioned in Section 1, the signal hypothesis being tested is a line source from the galactic equator (b=0) which is isotropic in galactic longitude. In order to leverage the existing Level 4 nusim production, a method was developed by myself and David Steele (galaxy-sim.pl) to modify and reweight existing nusim events to the desired distribution. The exact procedure is somewhat detailed, so I have written a separate document describing all the steps involved:
Reweighting procedure (pdf, 111K)
In essence, though, there are two steps:
Each of these procedures has been verified to work as described. To check step 1, we can simply check the reconstructed galactic latitude, which should be centered around zero:
Figure 3.1a: Signal MC and data as a function of galactic latitude (high normalization). |
Figure 3.1b: Signal MC and data as a function of galactic latitude (realistic normalization). |
Two normalizations of the signal are shown — one quite high to see the distributions (1.0e-3, arbitrary), and one more realistic (6.8e-6, the prediction from Ingelman and Thunman for an average column density of 0.7e22 cm-2).
Checking the longitude distribution is a little more involved, because although the events are generated to be isotropic in galactic longitude at generation, the detector zenith-angle response is folded with this. Thus the longitude distribution is not quite flat at the final level:
Figure 3.2a: Signal MC and data as a function of galactic longitude (high normalization). |
Figure 3.2b: Signal MC and data as a function of galactic longitude (realistic normalization). |
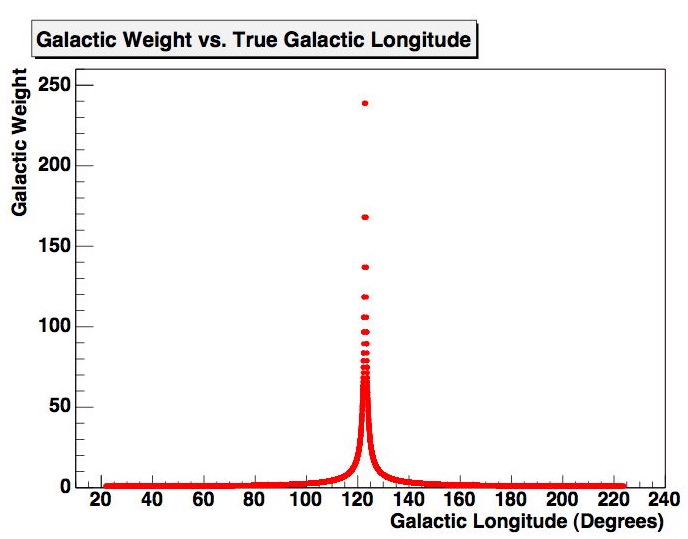
However, the shape has been checked with smaller amounts of raw nusim to verify the distribution. The only unexpected feature in the reweighted longitude distribution is an effect of a singularity in the weighting function at the point of highest declination:

Figure 3.3: Galactic weight as a function of longitude.
This necessitates using relatively high statistics (about 700K raw signal events) to smooth out the effect, as there are a small number of raw events at this point with a high weight, which means statistical fluctuations get blown up at this point. This effect is minimized by the fact that the highest declination band covers around 25 degrees in galactic latitude, which tends to wash any remaining fluctuations out.
The following plots show the final neutrino energy spectrum of signal and atmospheric Monte Carlo. Both an artificially high signal normalization and a pessimistic normalization are shown:
Figure 3.4a: Signal and atmospheric MC neutrino energy spectra (high normalization). |
Figure 3.4b: Signal and atmospheric MC neutrino energy spectra (realistic normalization). |
The slope of the tails is marginally different between the spectra, but the crossover point depends of course totally on the normalization.
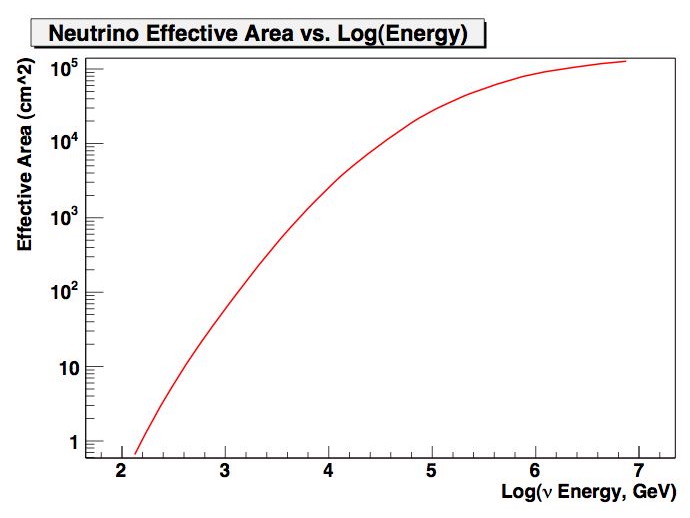
This plot shows the zenith-angle-average neutrino effective area of the detector after the optimized point source cuts, calculated from the signal Monte Carlo:

Figure 3.5: Zenith-angle-averaged neutrino effective area as a function of neutrino energy
Next (optimizations and sensitivity)