IceRay Integration 2007
at the University of Hawai'i — Manoa
John Kelley, October 2007
1. Introduction
This is a non-comprehensive collection of documents, plots,
and photos from the IceRay prototype testing and integration at the University
of Hawai'i in October 2007. All the real work was performed by Peter Gorham,
Gary Varner, Bob Morse, Larry Ruckman, Christian Miki, Patrick Allison, Hagar
Landsman, and assuredly several others.
2. Test Setup
-
DOM-MB setup
- Rev1 DOR card
- External daisy-chained power supplies (98V)
- 3 km cable emulator
- Custom iceboot (new commands)
- Power setup
- External power supply (96V)
- 10 Ohm / 10W load resistors on +/-
- 5V / 12V generated in Vicor power distribution box
- Power consumption: load+ICRR+TRACR, 22W; 1 amplifier module, +10W.
- Amplifier test setup
- Channels BAT1, BAT2 connected to surface antenna amplifiers (input terminated)
- Channels BAT5-8 connected to RFCM antenna amplifier module (input terminated)
- All other channels unconnected (terminated at ICRR input)
Photos of various components and the test setup can be
found here.
3. Results
All integration tests to this point have passed, with the following notes /
caveats:
- During early integration, rare mainboard hard resets were observed, as if
power were interrupted. This behavior could not be reliably reproduced and
stopped after the first couple of days.
- Occasionally the ICRR-MB transfer will lose an event byte (approximately
1 out of 2E7 bytes).
- Due to firmware / interface timing issues, ICRR DAC channels must be written
in a particular order.
- The calibration pulser has not been integrated / fully tested yet.
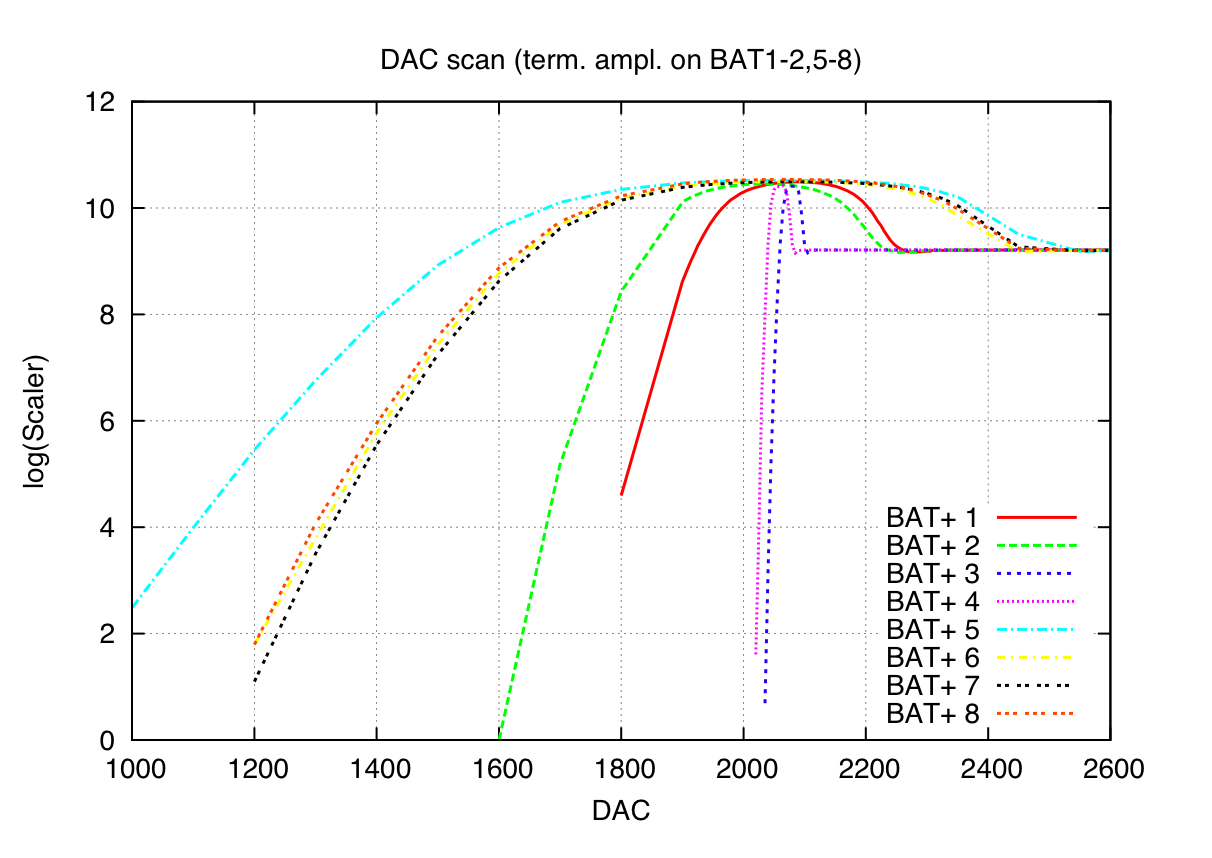
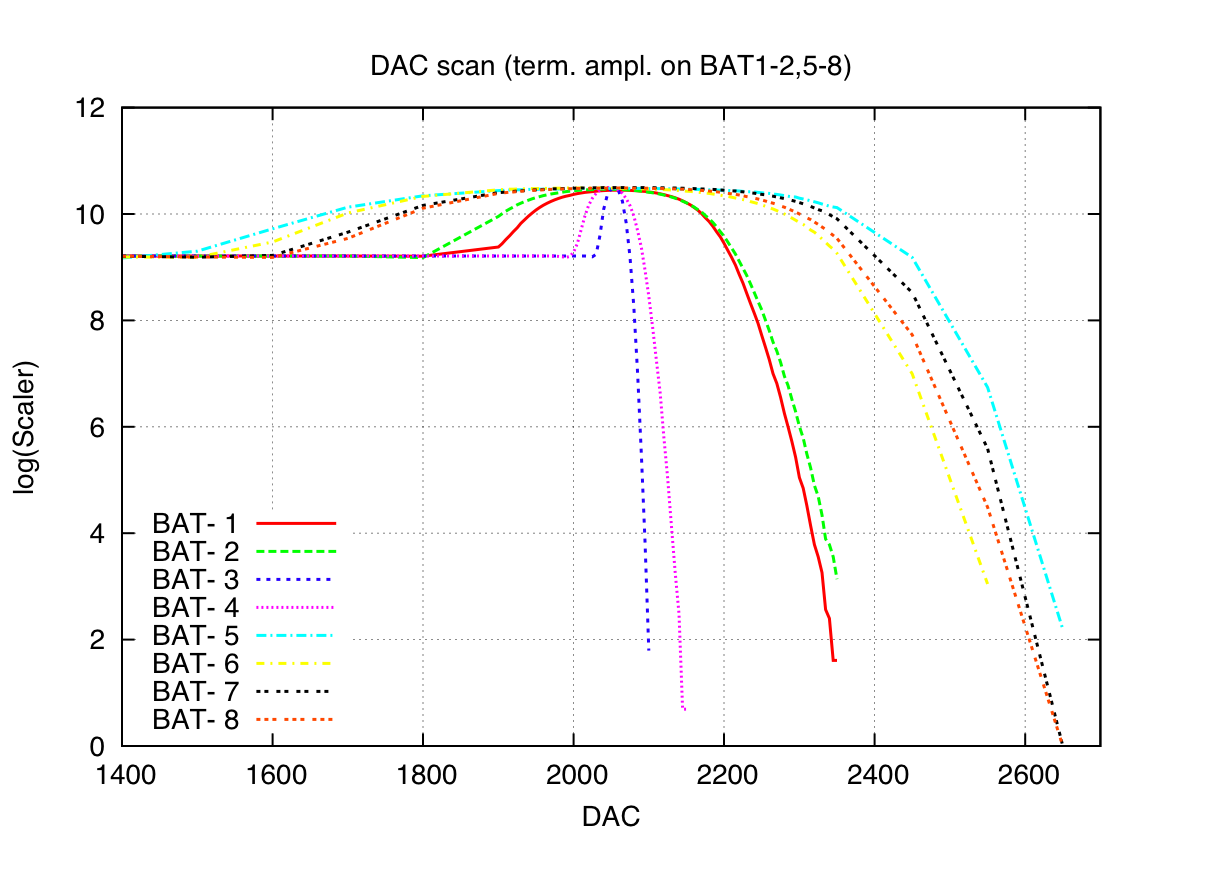
The following plots show a DAC threshold scan. The difference between the various
input configuration and their gains result in the different threshold curves.
Figure 1: Threshold scans for BAT channels (both polarities).
BAT4, BAT5 are unconnected to amplifiers.
Forced-trigger waveforms were also acquired and examined. Waveform
analysis is extremely primitive, with no proper pedestal subtraction or time-base
correction performed (see figure 2).
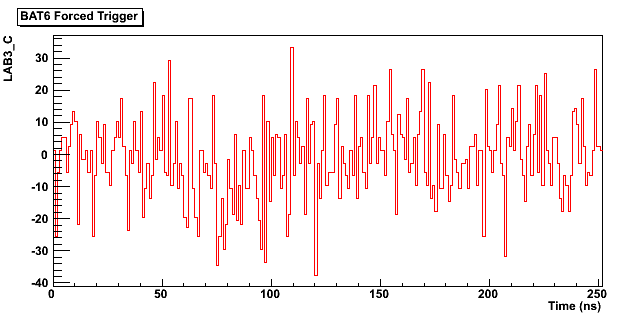
Figure 2: Sample waveform (no calibration other than rough baseline subtraction).
Even so, the band-pass characteristics of the filters on the amplifier
chains can be seen by coadding the FFTs of the noise, as shown in figure 3.
Figure 3: Frequency spectra of BAT1 and BAT8 channels under
test.
BAT1 surface amplifiers have a pass band of 25-300 MHz, BAT8, 100-400 MHz.
All RFCM and surface amplifier test channels (BAT1-2, and BAT5-8)
show the expected bandpass structure. The unconnected BAT3, BAT4 spectra are
relatively flat. The 40MHz clock input to BAT9 can be seen clearly in the FFT
for that channel in Figure 4:
Figure 4: BAT9 frequency spectrum, showing 40 MHz clock peak.
Here are the scripts used to produce these plots:
- ROOT script for waveform parsing, plotting, and FFT
using wf.bin files from IceRay.py
- Gnuplot script for DAC scan plots from headers.txt
file from IceRay.py
4. DAQ
The DAQ components consist of a custom iceboot (to interface with
the ICRR), driven by a Python script (an extension of Kael's ibidaq library).
We have successfully captured ICRR events (noise waveforms digitized by the
Labrador ASICs on the ICRR + header information, like scalers and DACs), including
a long run of 100K events over 9.5 hours (about 3 Hz). The data readout is not
optimized (uncompressed), so the speed could improve there, but we need to add
ATWD data and the mainboard header to the events, which will increase the event
size.
A mini-HOWTO explaining how to run the proto-DAQ testing software,
IceRay.py, can be found here (PDF).
Still to do:
- Add ATWD readout and mainboard headers
- Integrate RapCal / timing calibration
- Add cal pulser functionality
- Optimize readout speed
5. Document Collection