AMANDA Monte Carlo Updates
AHA, PE Distributions, OM Sensitivities, and more...
John Kelley, September 2007
1. Introduction
This page describes various tests to determine the optimal electrical
parameters to use in AMANDA Monte Carlo simulation, in conjunction with the
new AHA ice
model. These tests are still in progress; results and conclusions will
be added as they are available.
UPDATE, 13 Sept. 2007: Some of the preliminary
conclusions on this page were erroneous because of an 30% error in the MC
normalization (reweighting problem). This has been fixed and the discussion
updated accordingly.
2. PE Distribution
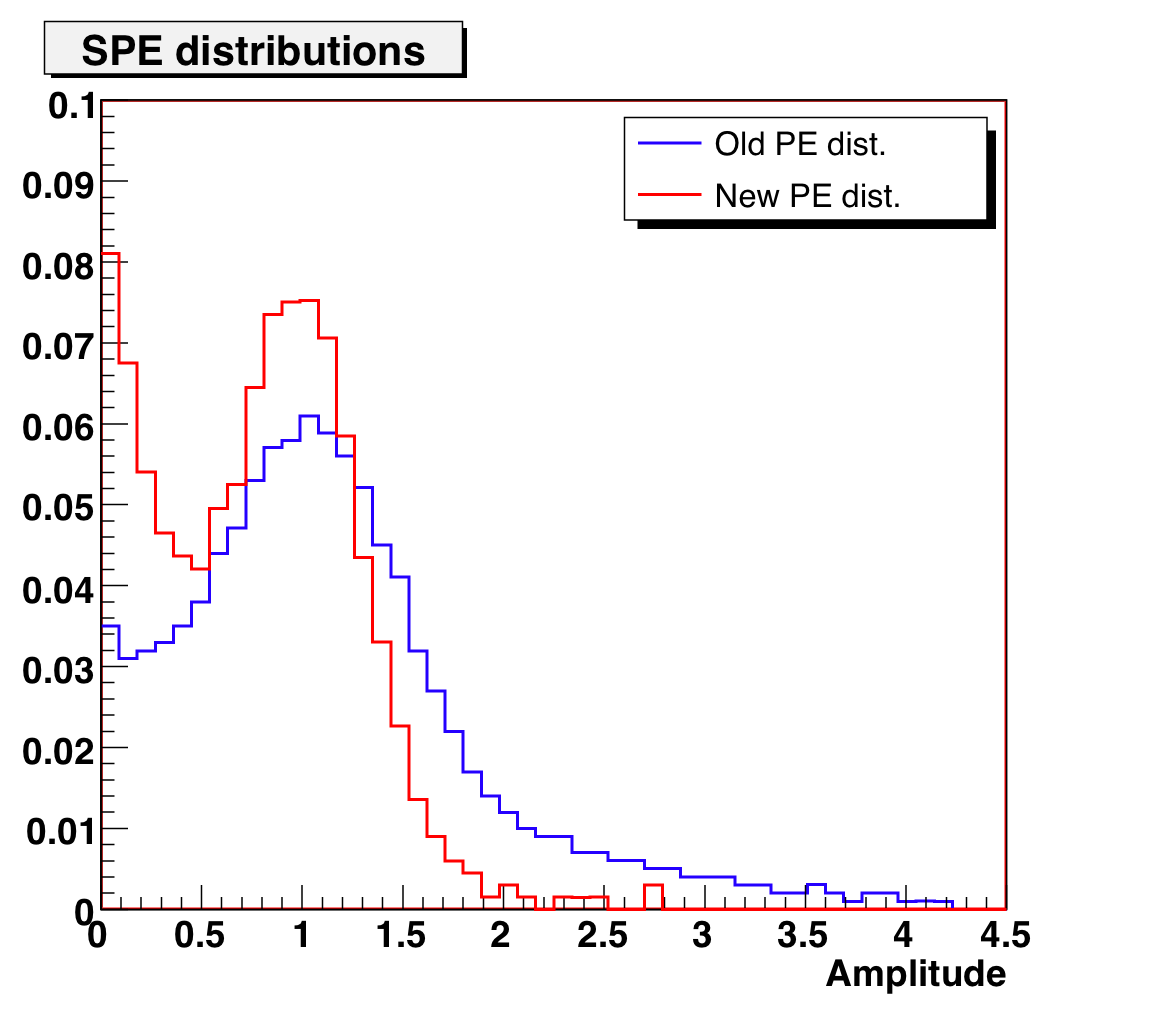
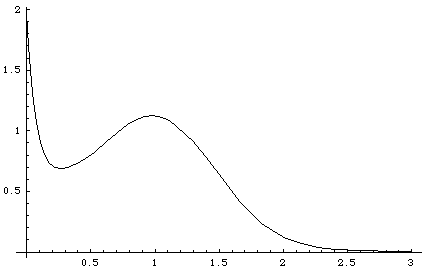
A new AMANDA SPE distribution was circulated by Stephan Hundertmark
which featured a narrower SPE peak and larger exponential component, compared
to the standard AMANDA SPE distribution. I investigated these properties with
lab measurements and using AMANDA monitoring
data and found:
Using these findings, I also created a new PE distribution to test. The three
PE distributions are shown below:
Figure 1: AMANDA SPE distributions for MC
(LEFT: original OM3 (blue), SH variant OM6 (red); RIGHT: JK dual exponential
variant OM8)
The inverse CDF tables for use with Amasim are here:
The proof is in the pudding, however, so MC simulations with each of these
have been performed for comparison with 2005 data. The following parameters
were fixed for this test:
- MC: dCORSIKA 6.6 + SIBYLL HE interaction model + Hoerandel spectrum
- canonical OM sensitivities (0.85 for B10, 1.0 others) unless mentioned
- Amasim aluminum-opt5
- AHA, Millennium, and PTD (mamint) ice models used as noted
- minimal 2005 filtering used (bad OM and modified xtalk cleaning, JAMS reconstruction,
no quality cuts unless mentioned)
- 0.8 days of data filtered
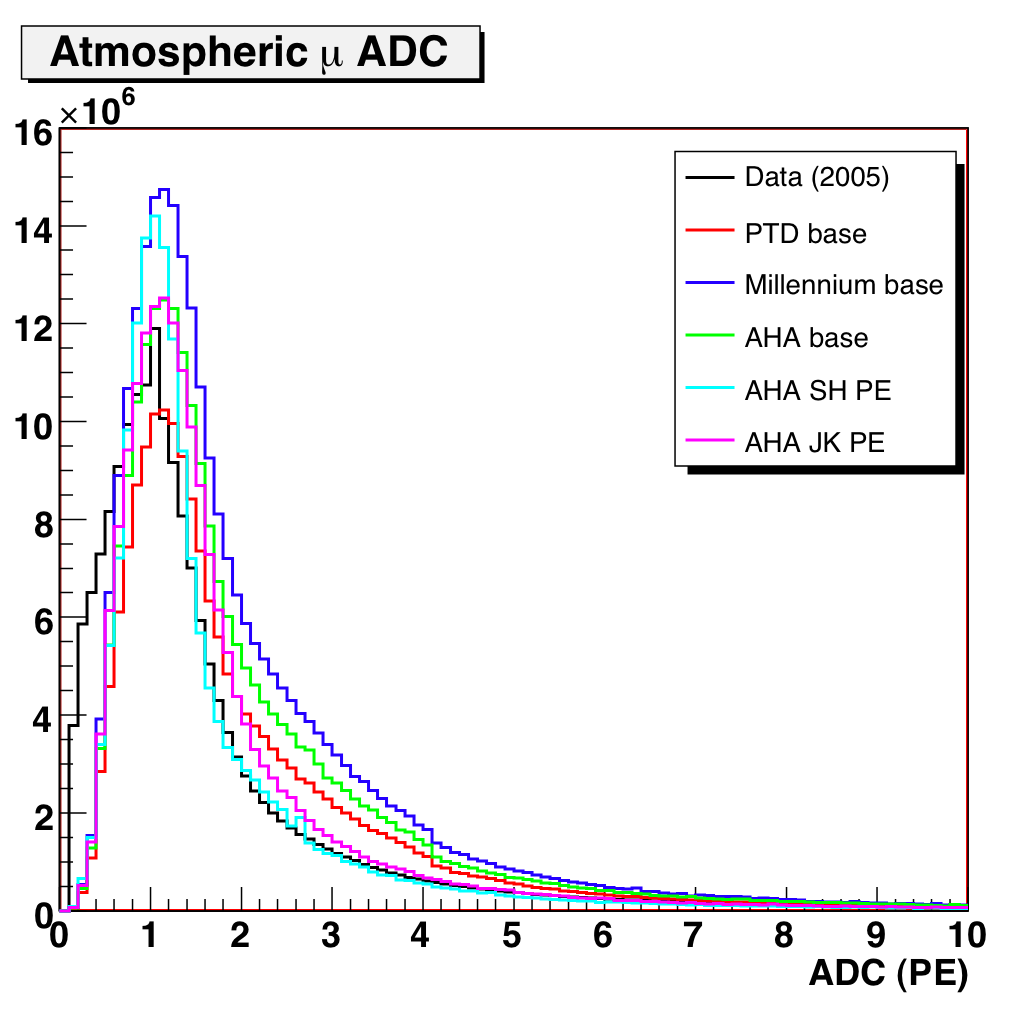
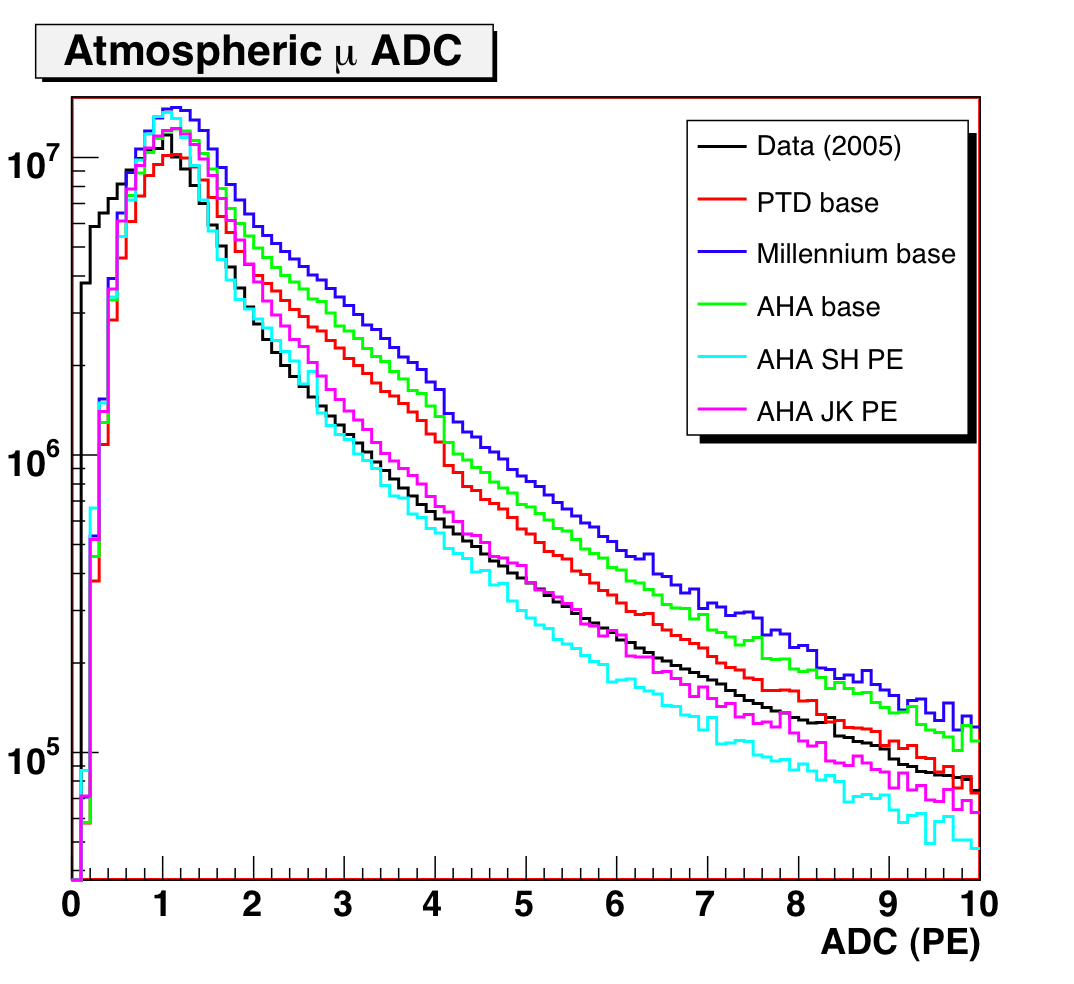
Some comparisons with downgoing data are shown below.
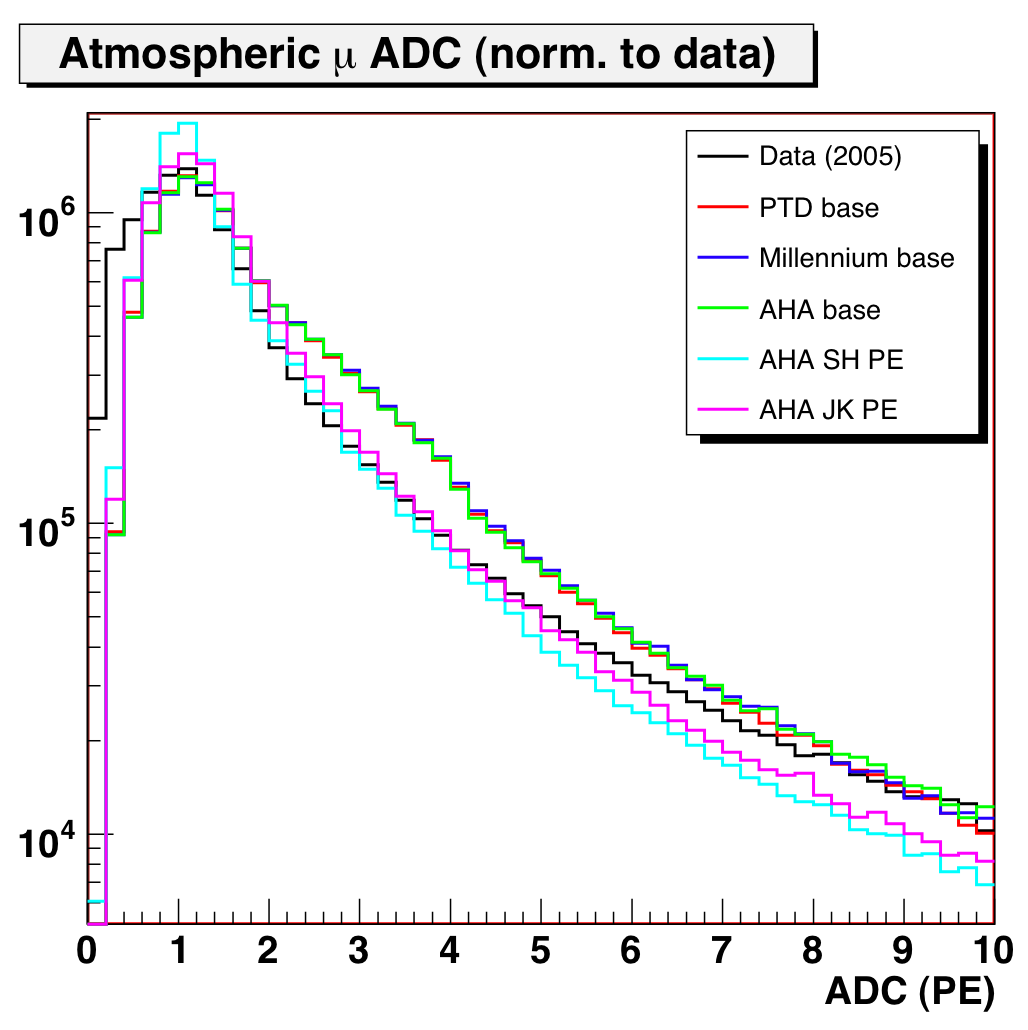
Figure 2: Downgoing muon ADC for 2005 data and MC. Left and
center plots are normalized to livetime;
right plot is normalized to data to compare shapes.
Several things are notable about this comparison:
- No MC PE distribution reproduces the ADC spectrum of the data particularly
well, especially at low amplitude
- The variant distributions (JK and SH) both look to be an improvement:
SH does well in the 1.5-4 PE region, and in JK the peak shape is a little
close to data (more rounded).
- The closest overall in shape is probably the JK variant (normalized plot
on far right) — but it diverges at high ADC
- The shape of the ADC distribution is largely independent of ice
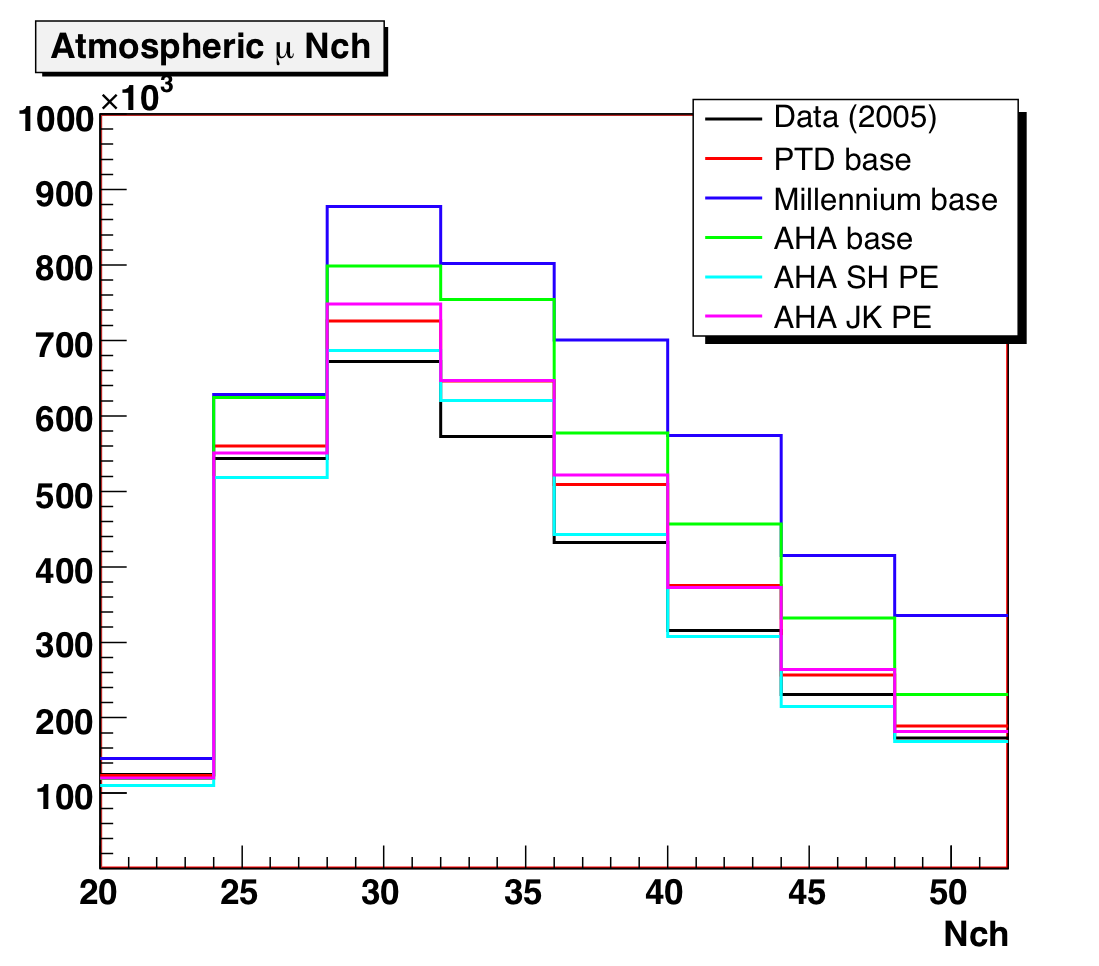
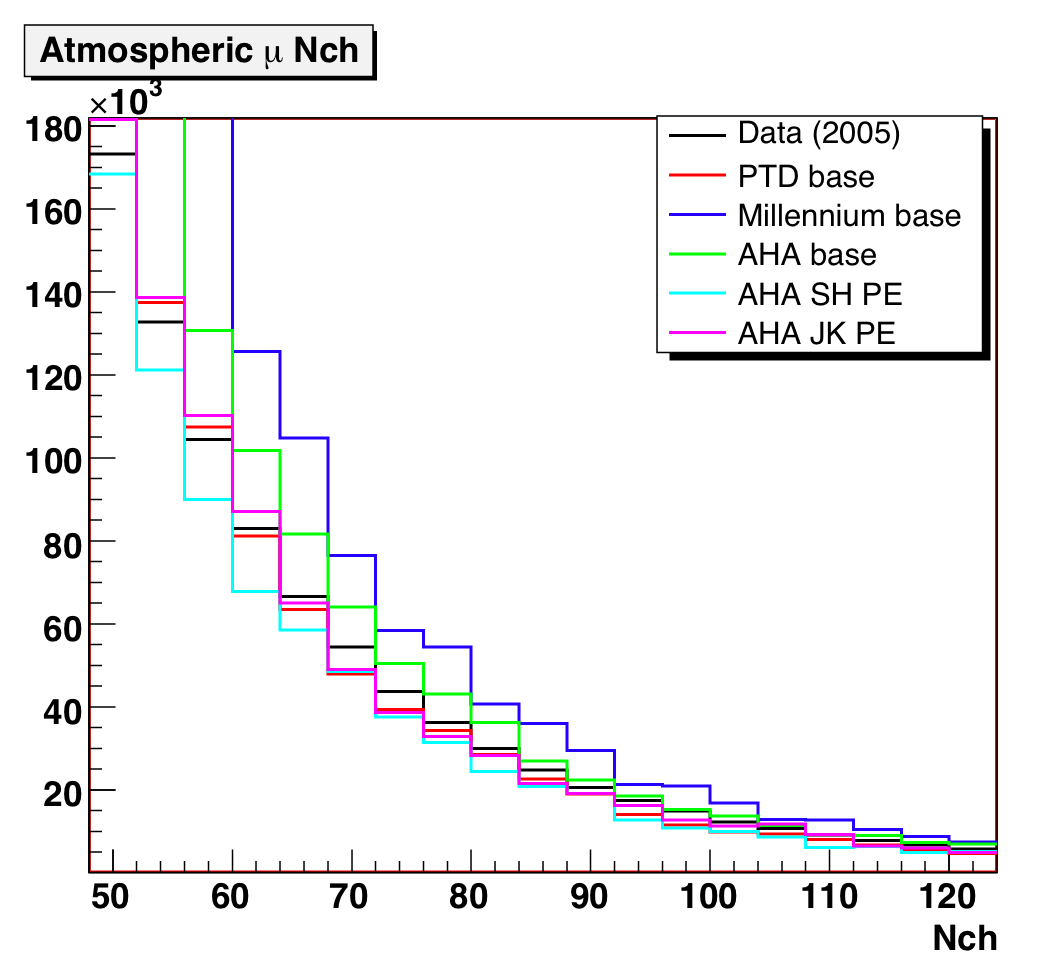
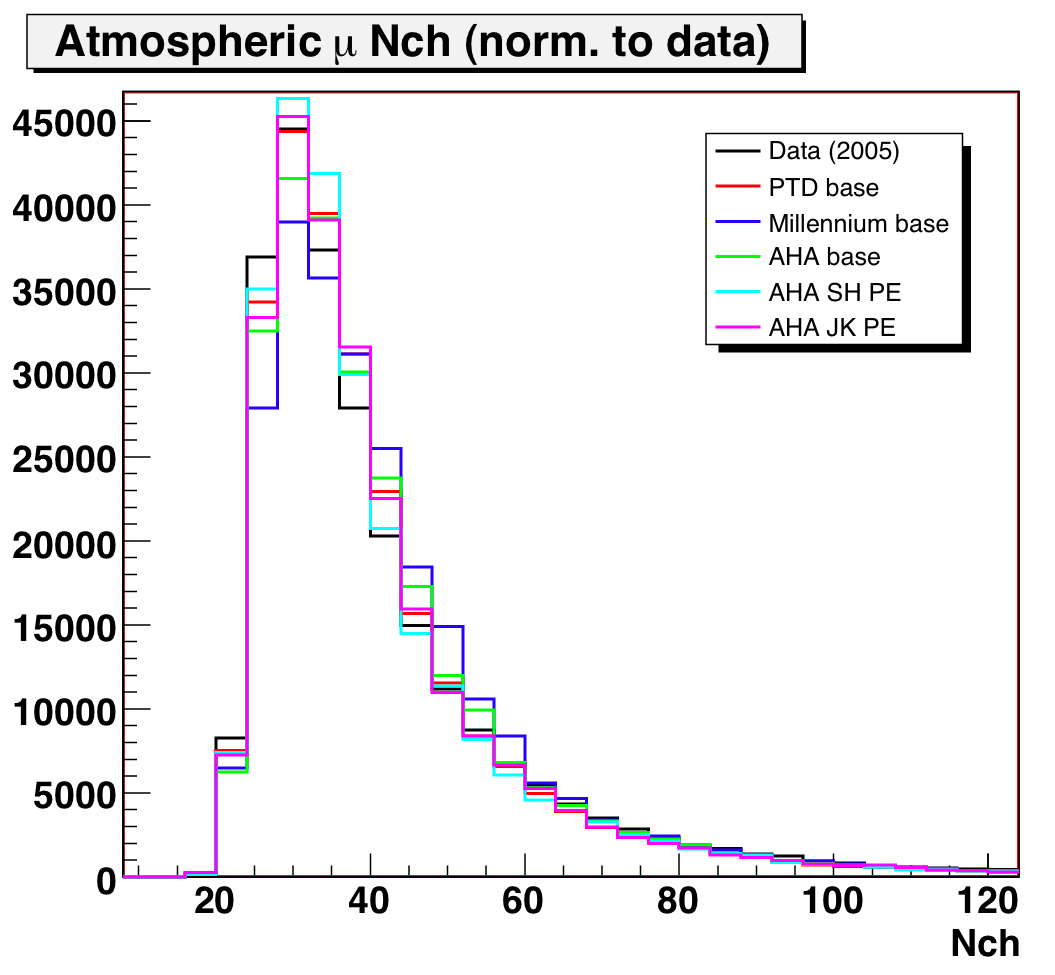
Here we plot the number of OMs hit, along with the weighted event counts:
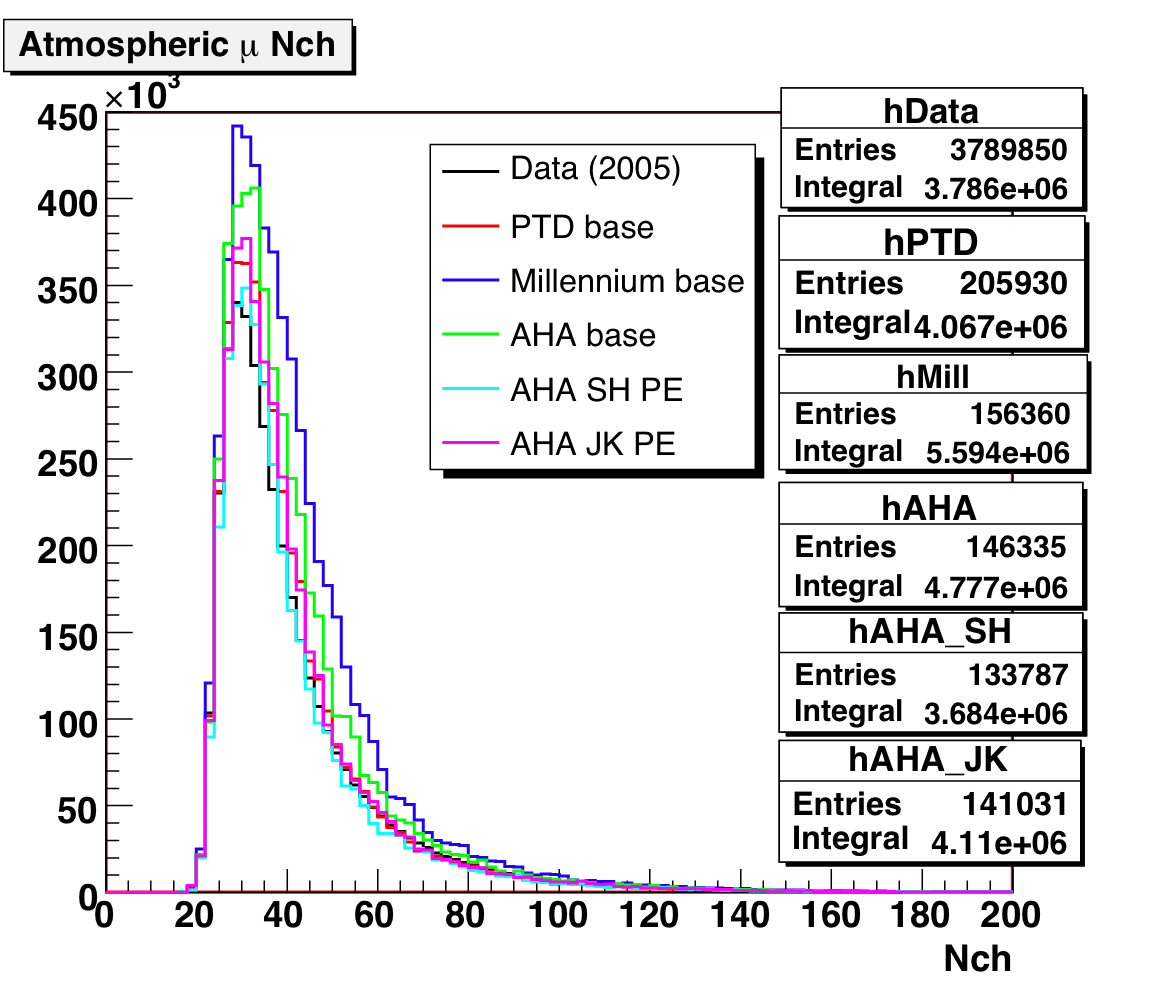
Figure 3a: Downgoing muon Nchannel data/MC comparison, for different
ice and PE distributions.
Figure 3b: Downgoing muon Nchannel data/MC comparison (linear
and log scales).
Left and center plots normalized to livetime; right plot normalized to data.
AHA with the SH PE distribution and old OM sensitivities is the
closest to data in normalization: however, the initial negative slope seems
to be a bit off. The JK PE distribution is next closest in normalization.
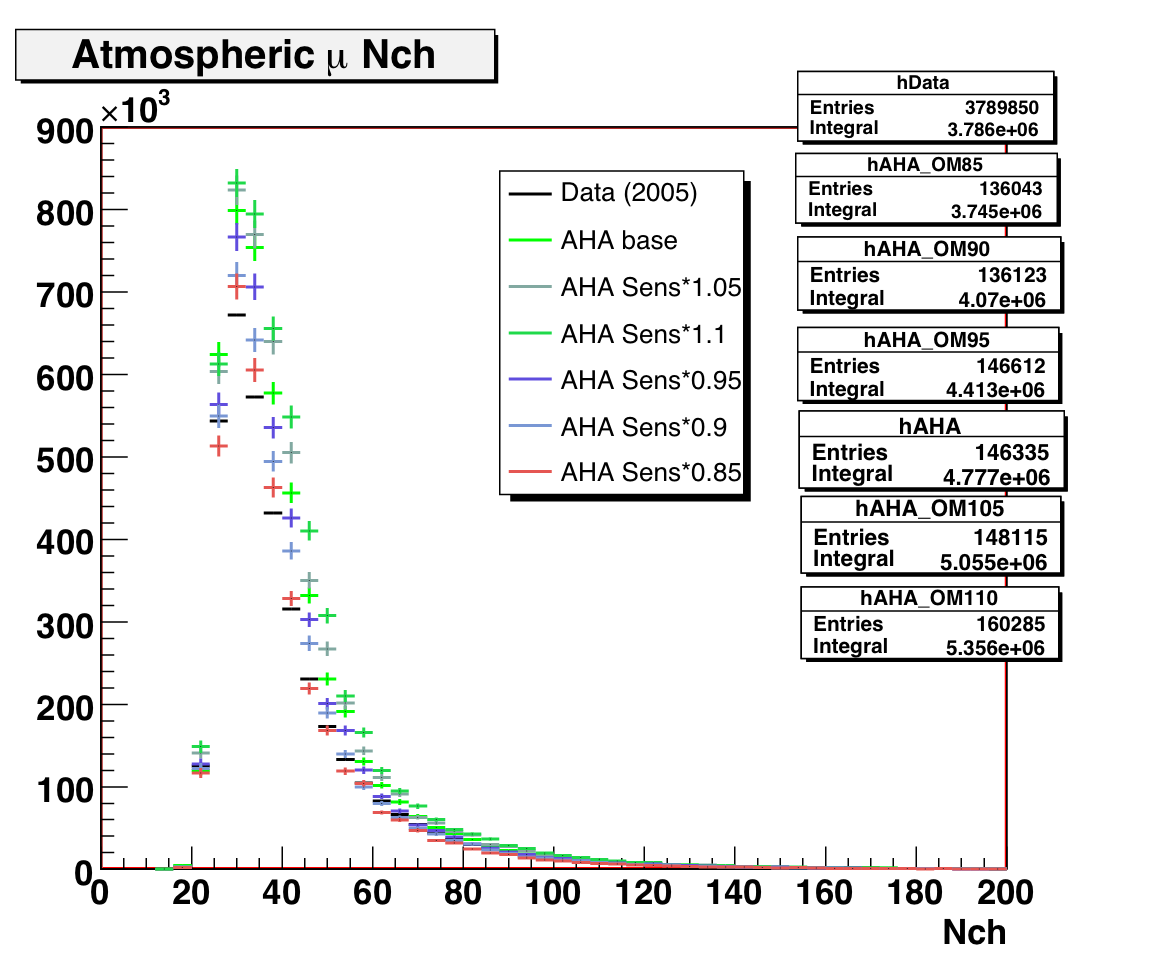
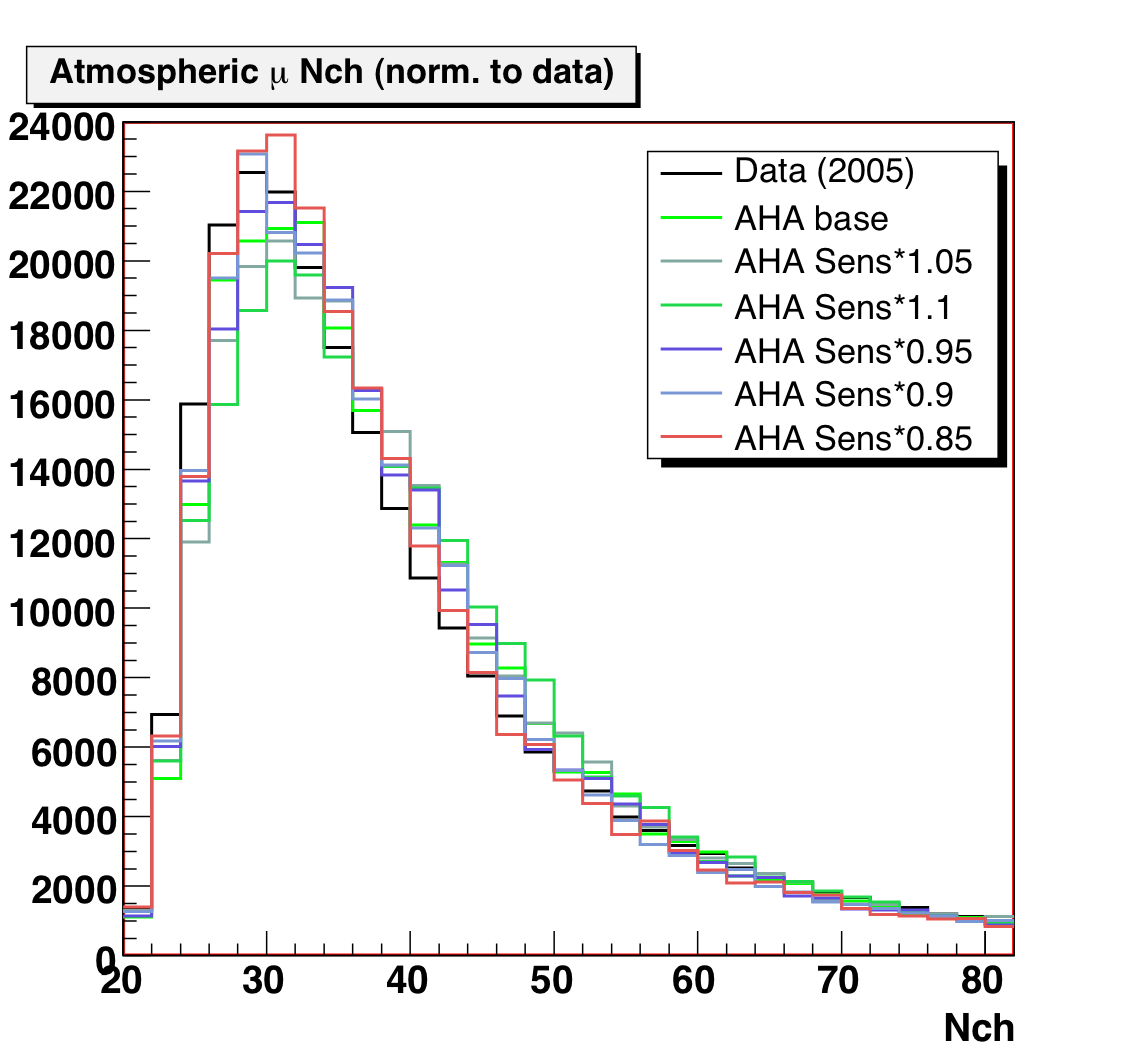
3. OM Sensitivity
We have also generated AHA dCORSIKA with a spread of OM sensitivities
(changing the normalization, not tuning the individual OMs). Some results are
shown below. Matching the peak position and low-Nch shape, as well as the normlization,
suggests reducing the OM sensitivity. We will also tune the individual OM relative
sensitivities with downgoing muons.
Figure 4: Downgoing muon Nchannel data/MC comparison for different
OM sensitivities (linear and log scales).
Left plot normalized to livetime; right plot normalized to data.
A plot of reconstructed zenith angle is shown in figure 5. The
shape (and normalization in previous plots) appear most consistent for 85% sensitivity,
but no model matches the vertical events well (perhaps tighter cuts are needed).
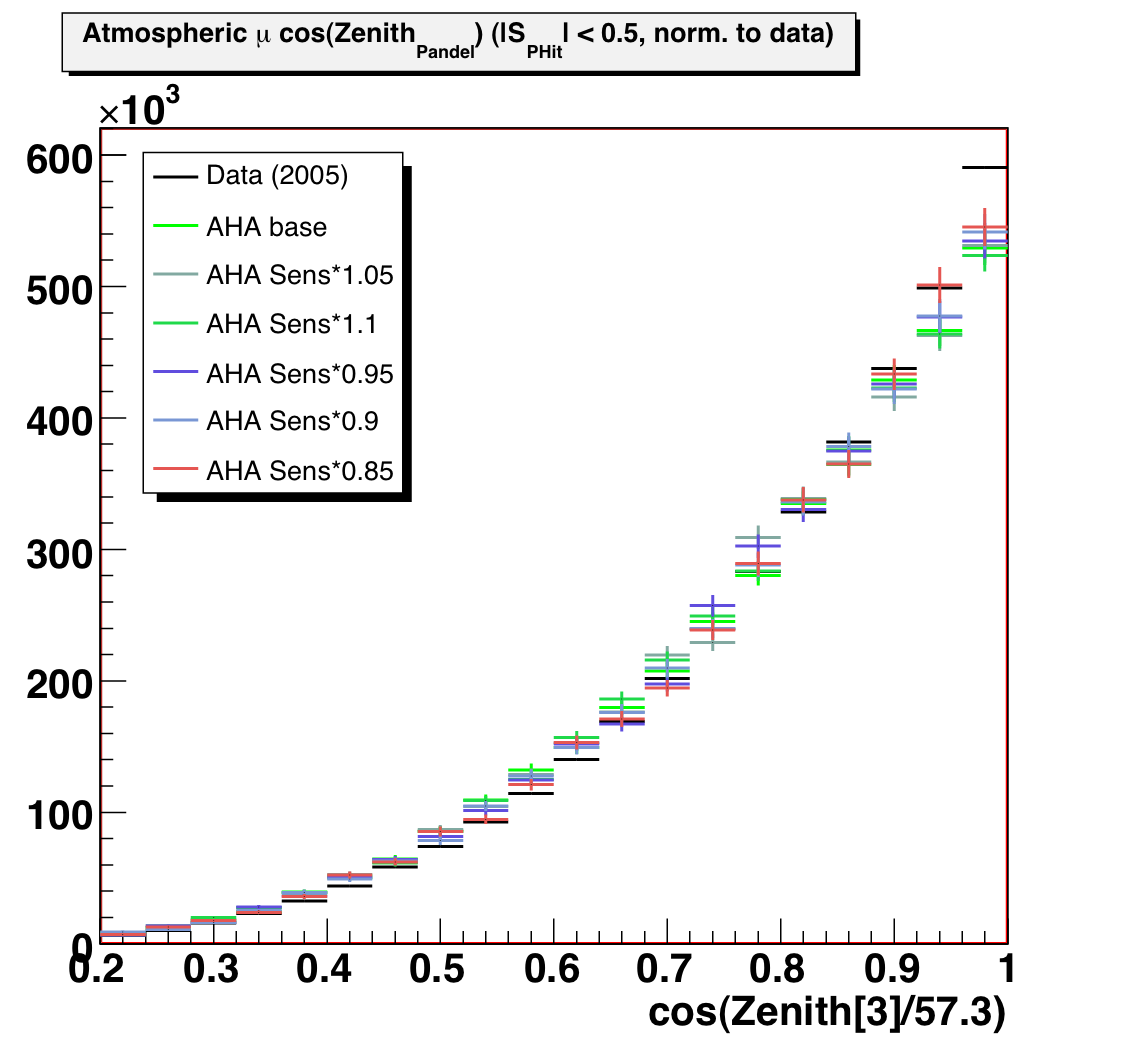
Figure 5: Downgoing muon reconstructed zenith angle, with a loose smoothness
cut.
MC normalized to data for shape comparison.
I have also tried modifying the OM sensitivity and the PE distribution
(JK PE with lower OM sensitivity). In this case, a 95% OM sensitivity is closest
in normalization. The Nch plot does not seem to indicate a preference over this
vs. old PE + 85% sensitivity, but I am continuing to investigate other variables.
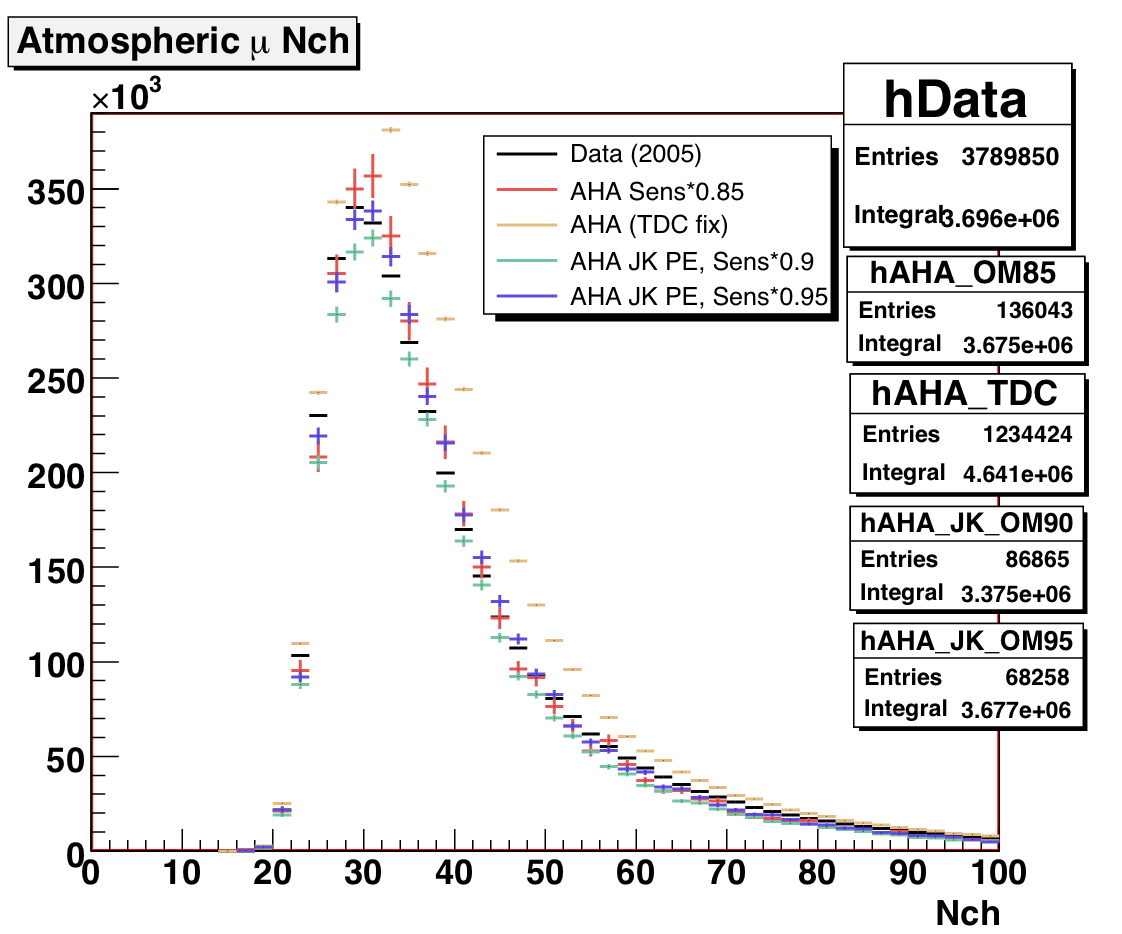
Figure 6: 2005 atmospheric muon MC at trigger level, Nch distribution for JK
PE distribution and various OM sensitivities.
4. TDC and Trigger Time
The data/MC comparison of TDC indicated an offset in the trigger
time in 2005 MC. This is possibly just a units confusion issue, as the correct
trigger time for the Amasim steering file is found to be (0.96*10773 [old value]
= 10342). 0.96 is the conversion from TDC channels to ns (or
vice versa, I'm not sure).
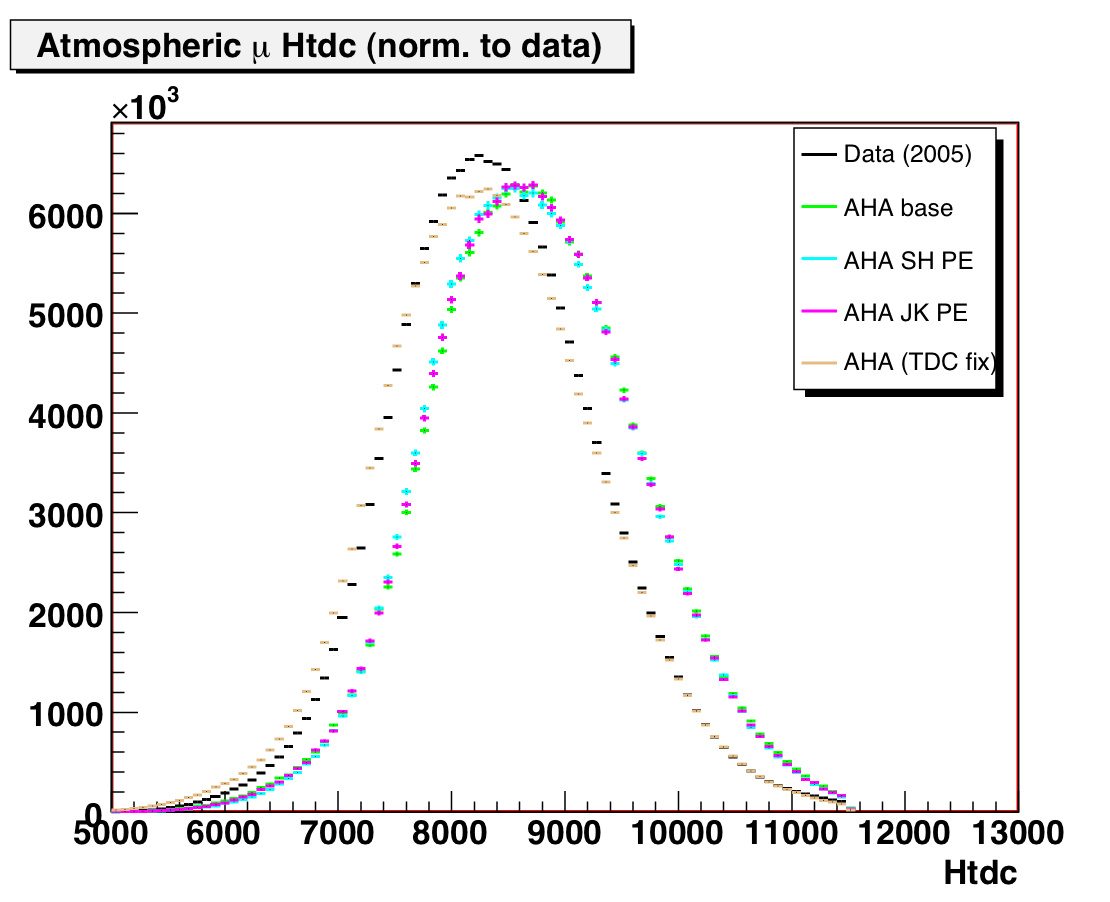
Figure 7: TDC for data/MC at trigger level. Corrected MC has a trigger time
of 10342.