Reco of spice data
Relatred doc. DB1768, DB1793, DB1784, DB1865, DB1951, DB1876,
Reconstruction of SPICE core showed if vertex (or pulser) located below -25 degree of elevation angle, detector is not able to trigger the signal
Fig. 147 A2. Reconstruction of SPICE core measurement. Dec. 26 drop
Fig. 148 A3. Reconstruction of SPICE core measurement. Dec. 26 drop
Passed simulated event
Based on this measurement we decided to exclude simulated Neutrino event that located below -25 degree from trigger level
Fig. 149 Simulated Neutrino event in RZ map. Red dashed line is -25 degree of elevation angle
Fig. 150 A2 passed event after implementing spice core cut
Fig. 151 A3 passed event after implementing spice core cut
Summary of backgound estimation and S/B cut
Same S / S_up method was performed with signal simulation including spice cut
Fig. 152 A2 VPol. signal background saparation cut in two parameter space
Fig. 153 A2 HPol. signal background saparation cut in two parameter space
Fig. 154 A3 VPol. signal background saparation cut in two parameter space
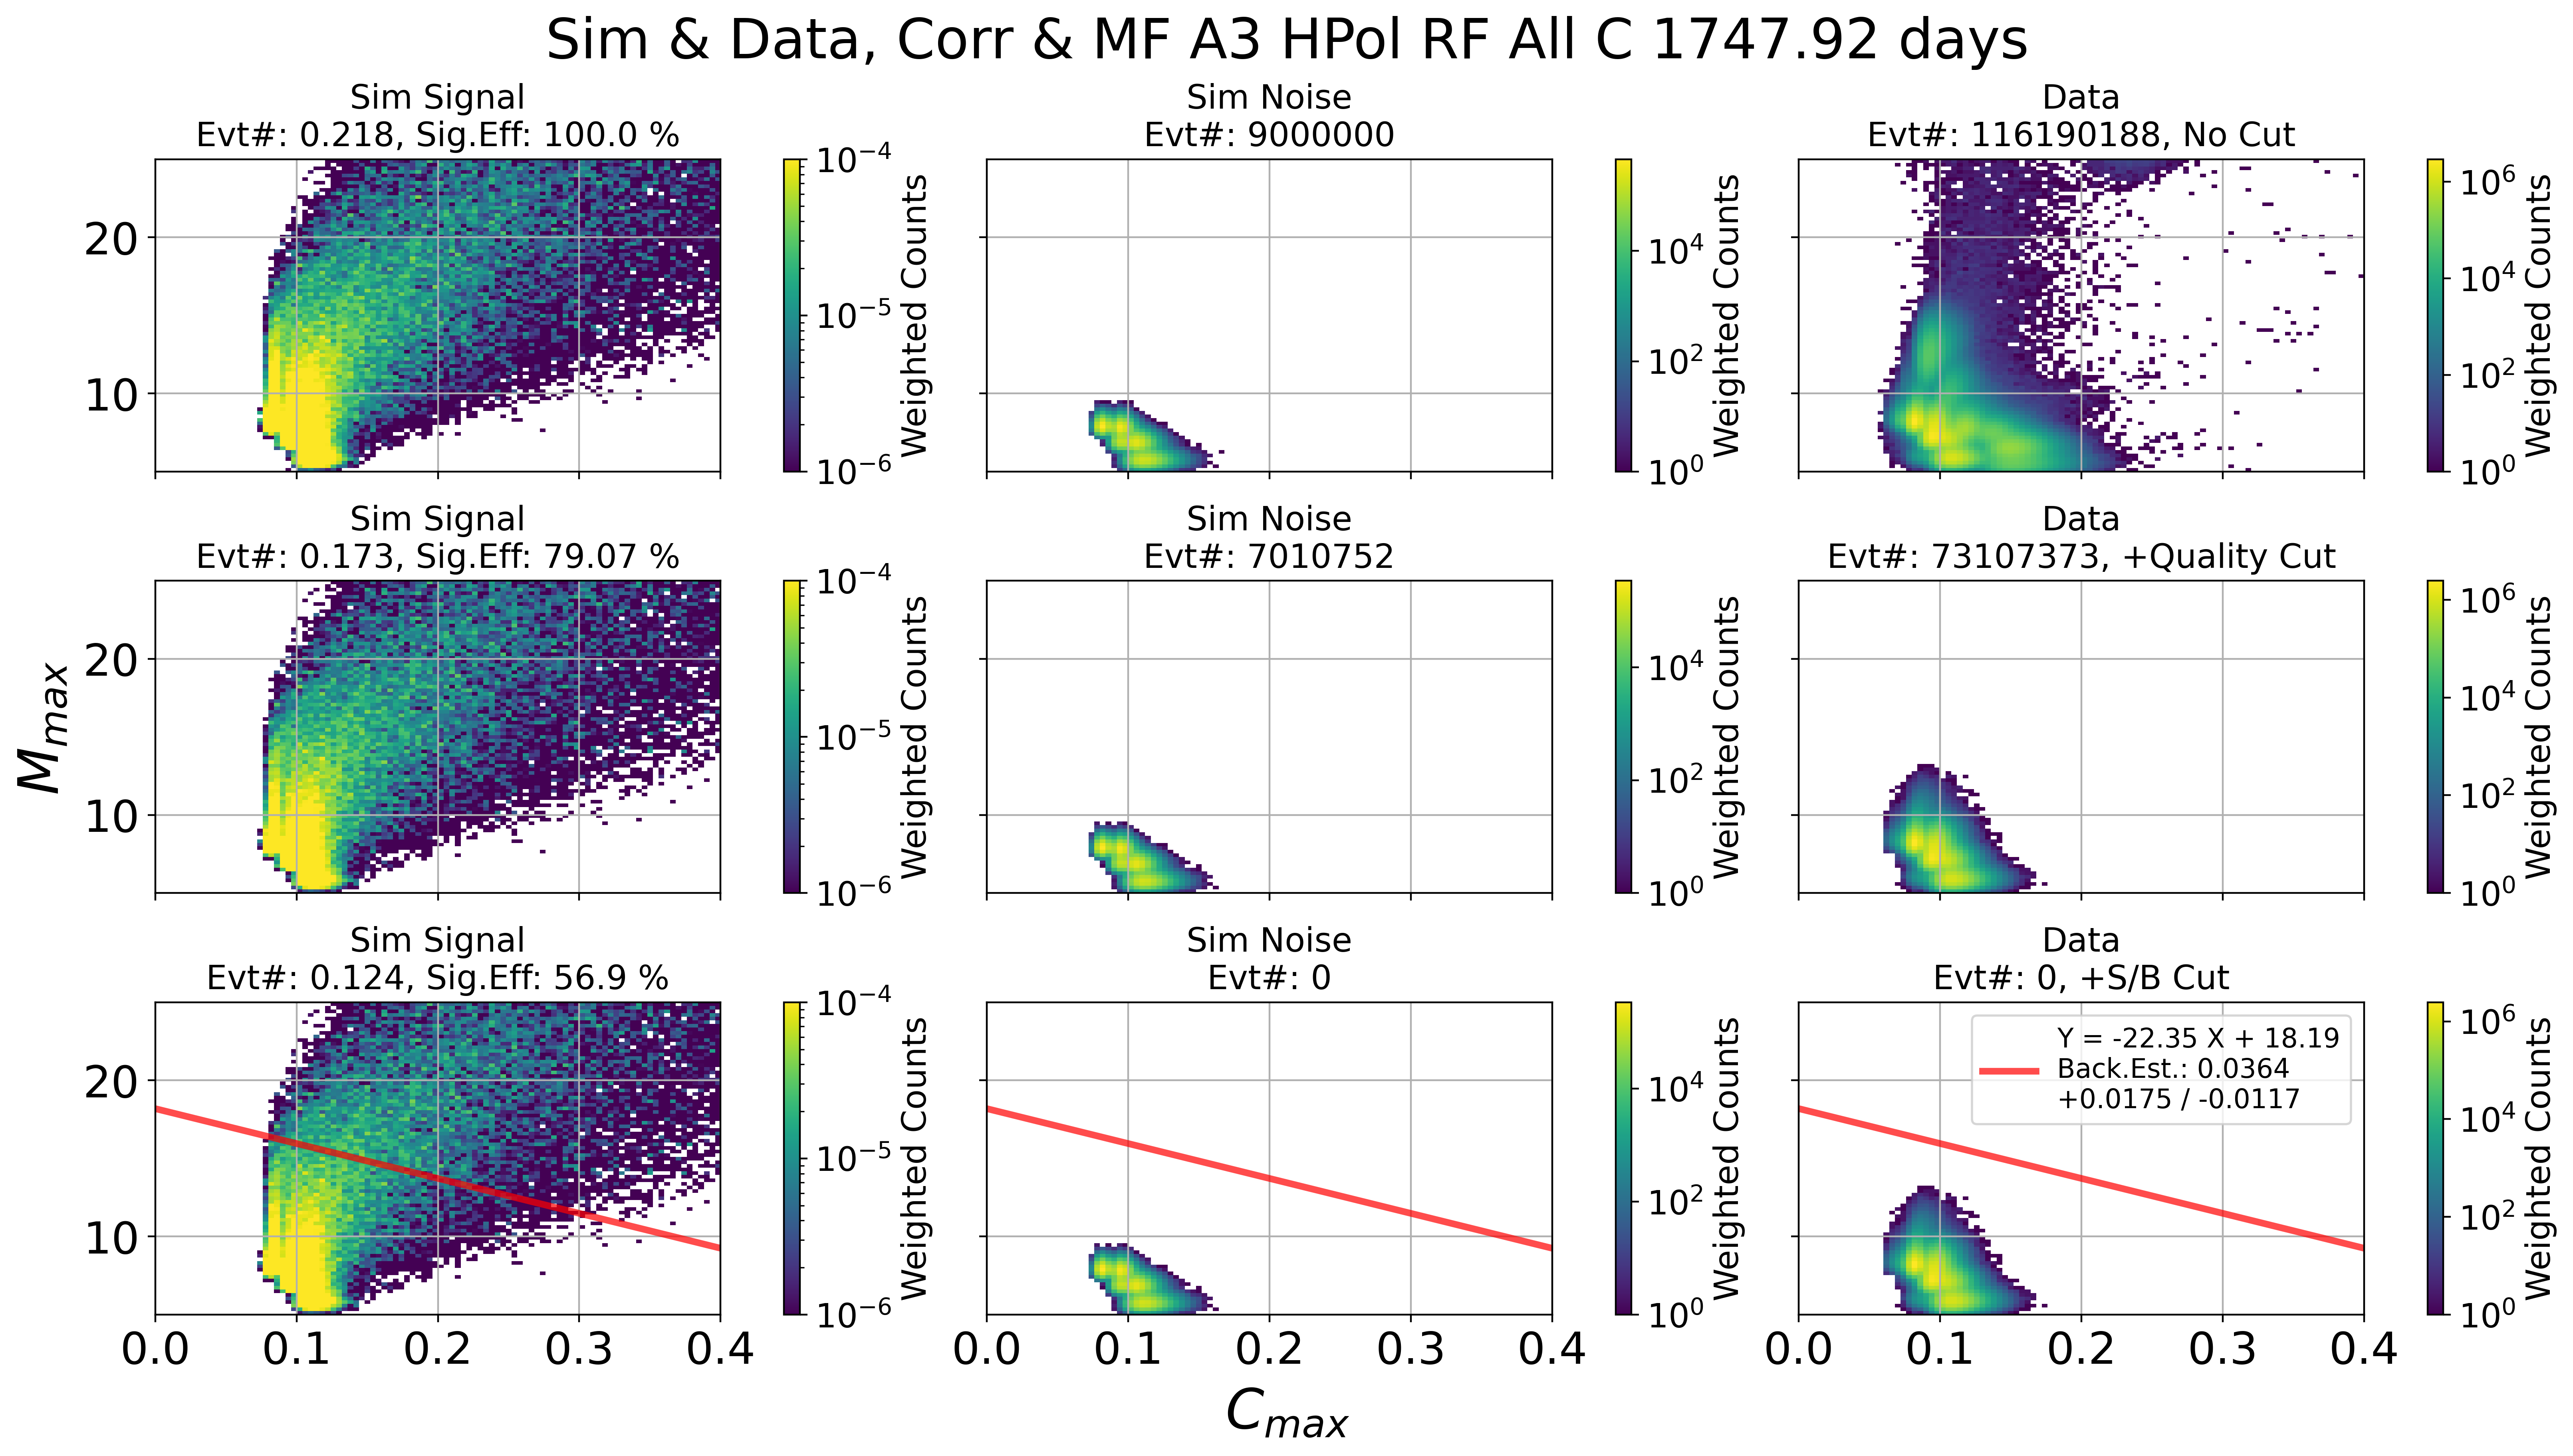
Fig. 155 A3 HPol. signal background saparation cut in two parameter space
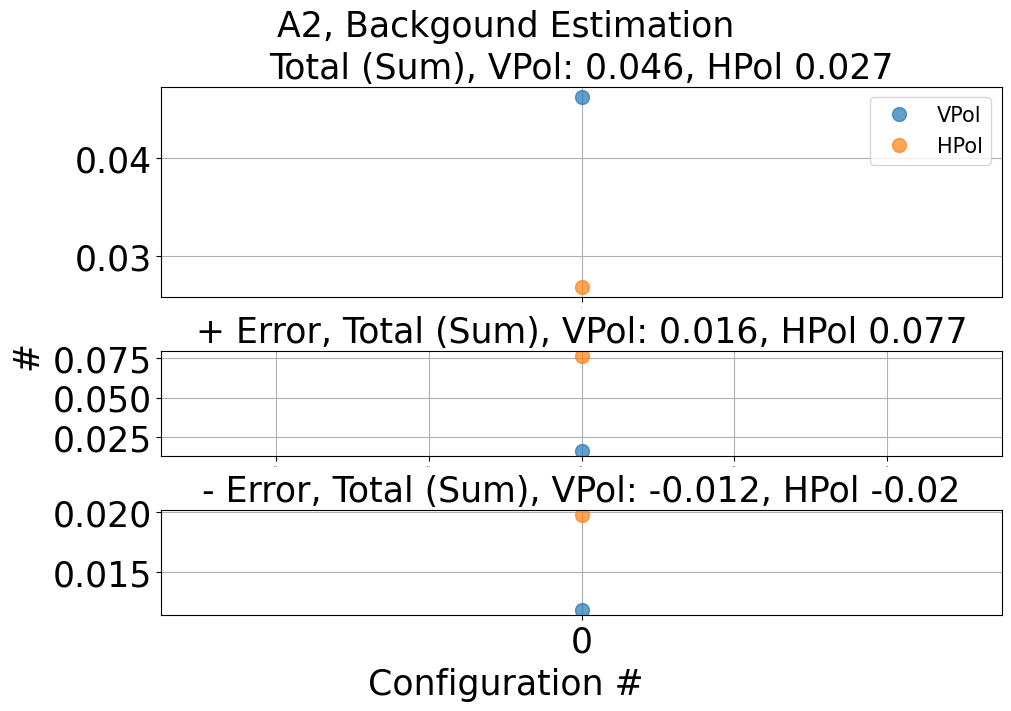
Fig. 156 A2. estimated background number
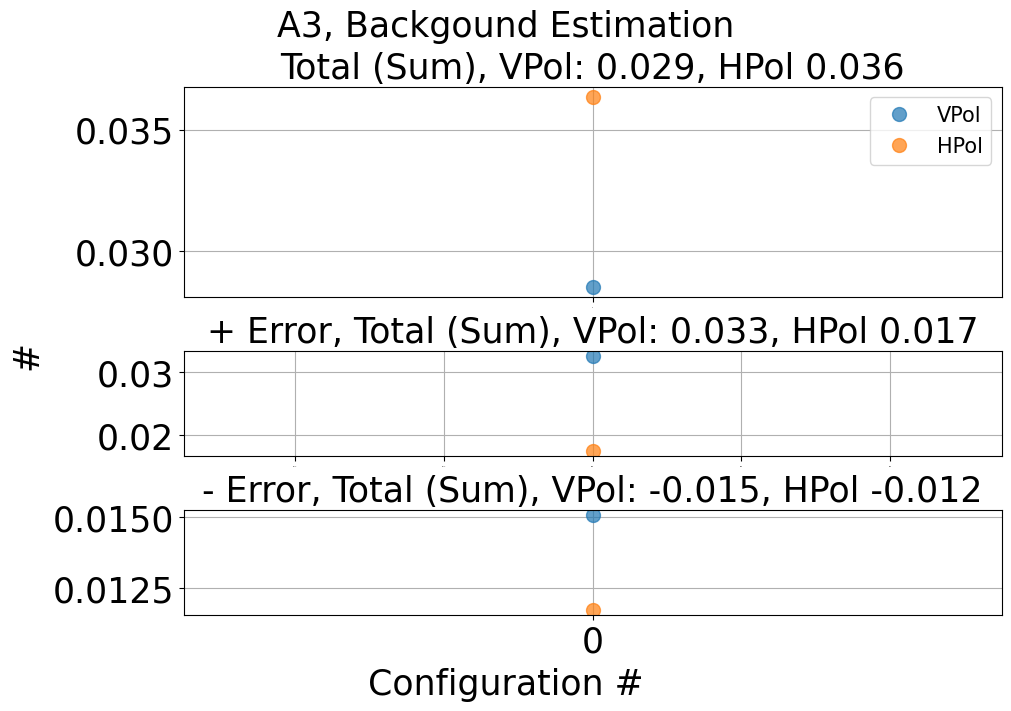
Fig. 157 A3. estimated background number
A2 Effective area and Signal efficiency
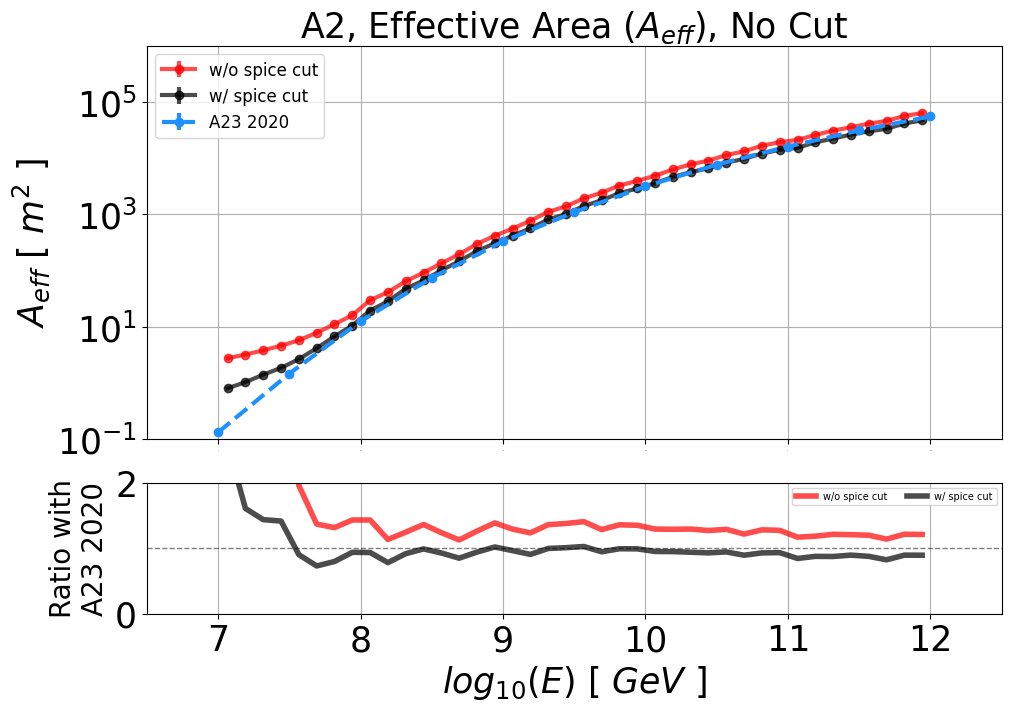
Fig. 158 Effective area in trigger level
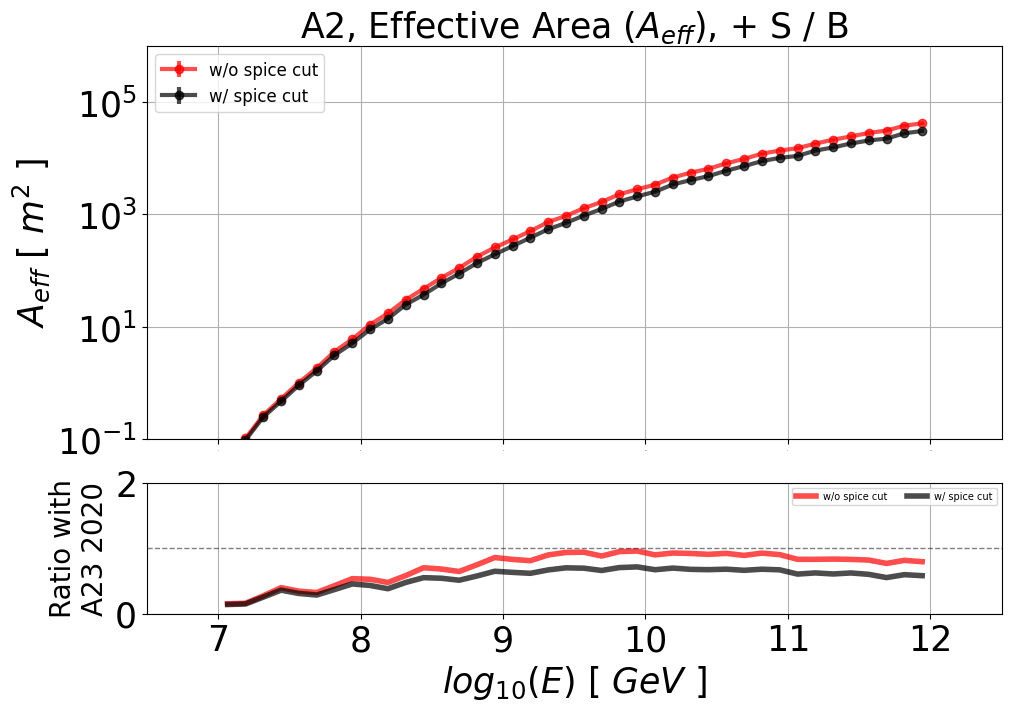
Fig. 159 Effective area in after all cuts

Fig. 160 Signal efficiency of each cut
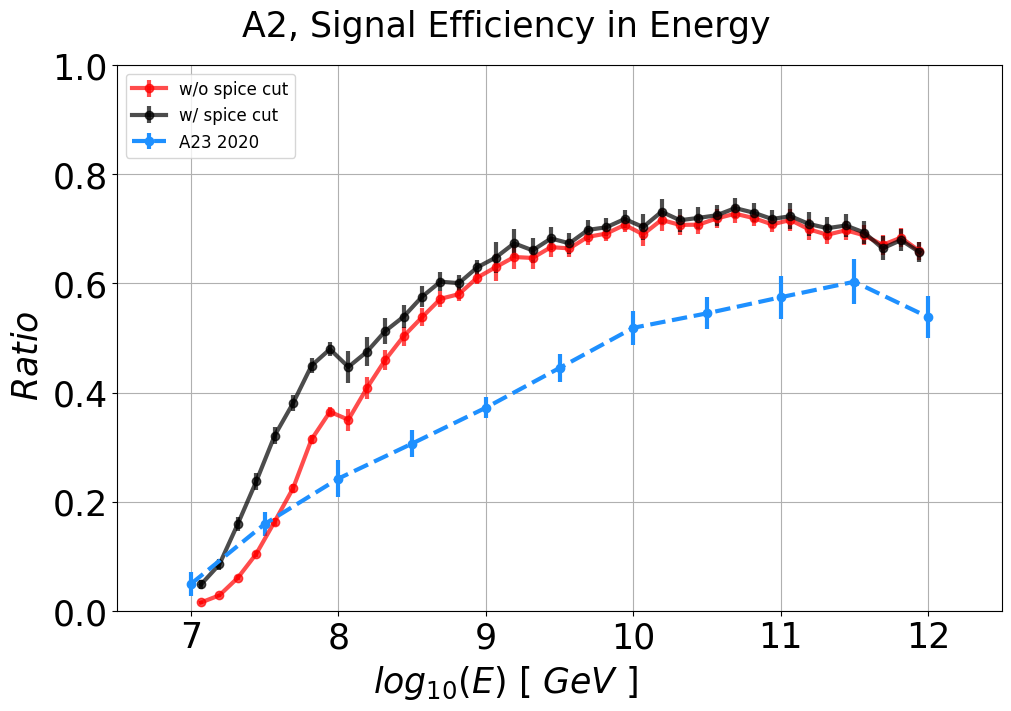
Fig. 161 Signal efficiency in energy
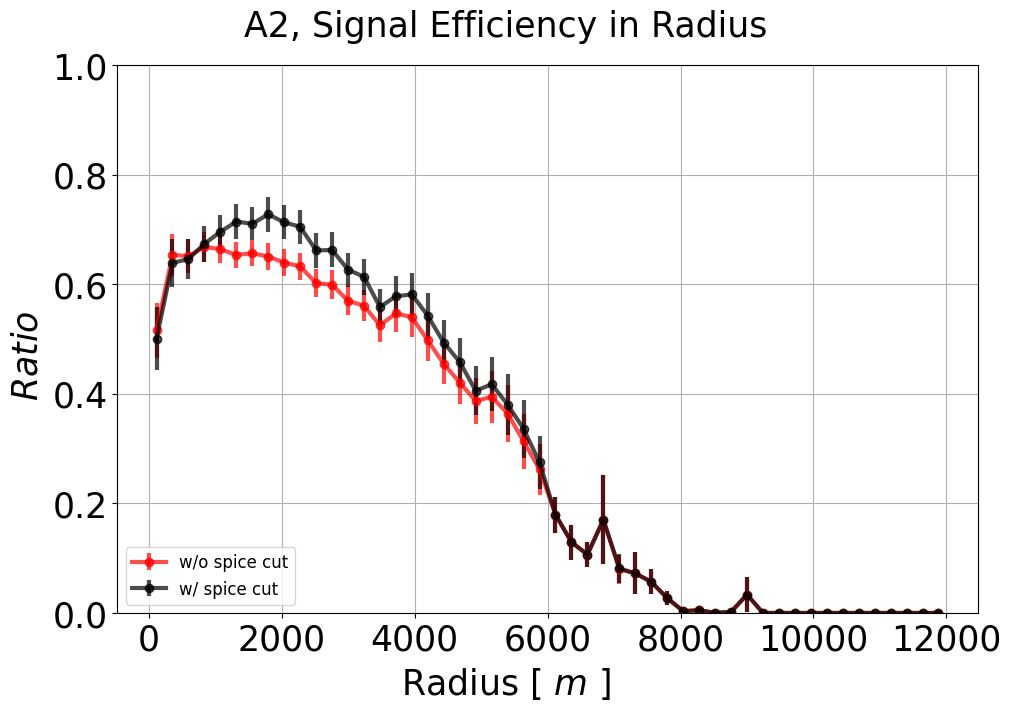
Fig. 162 Signal efficiency in Radius
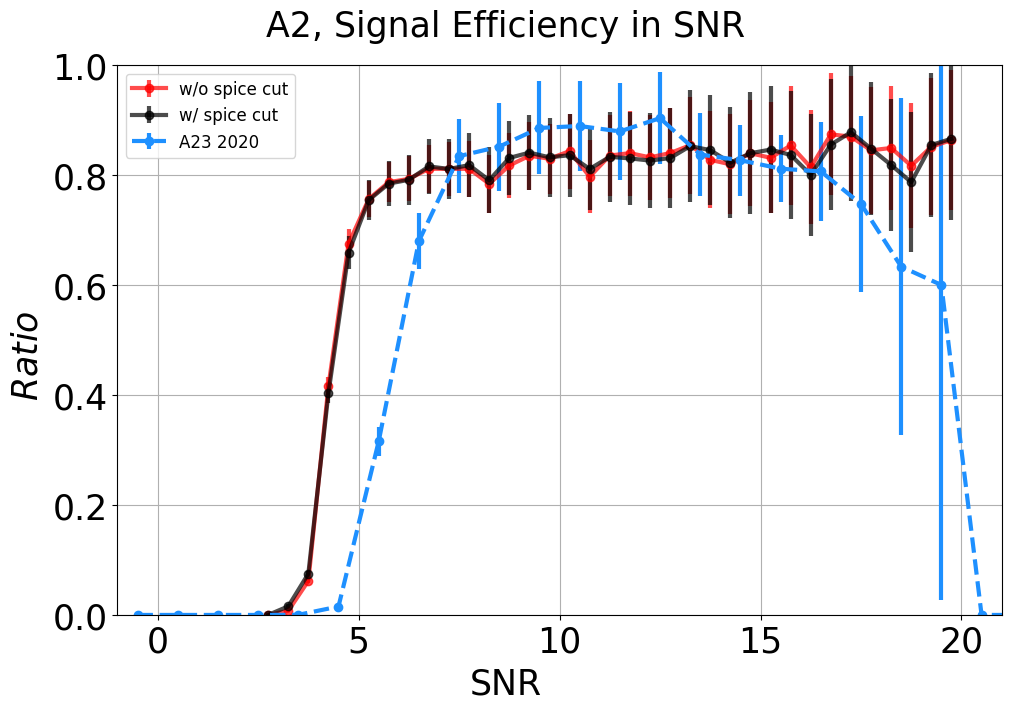
Fig. 163 Signal efficiency in SNR
A3 Effective area and Signal efficiency
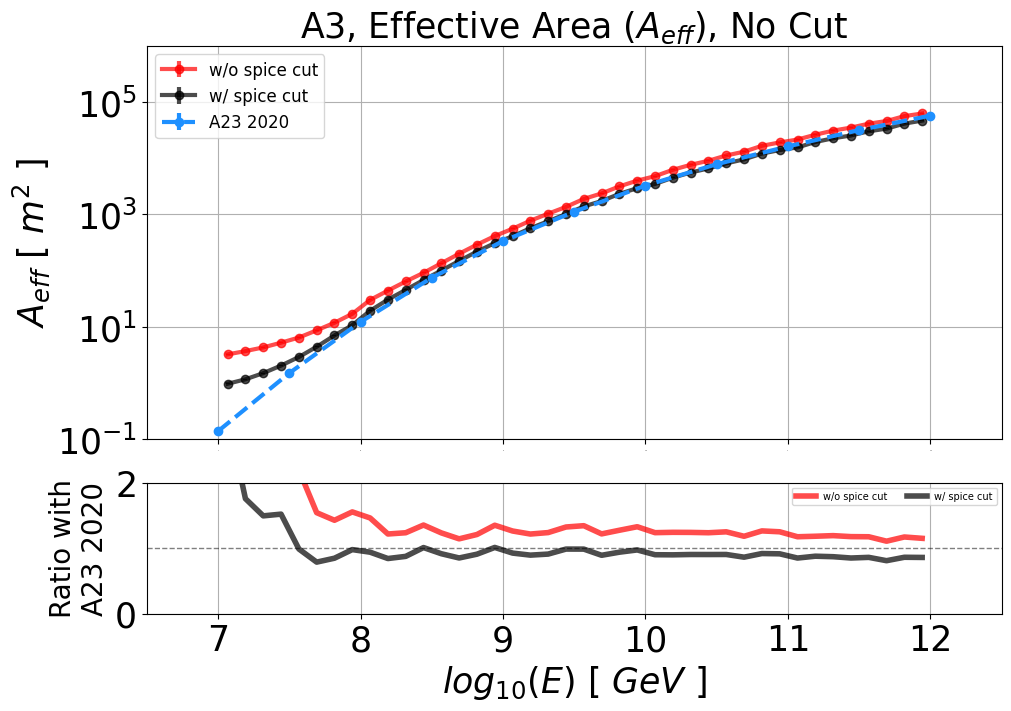
Fig. 164 Effective area in trigger level
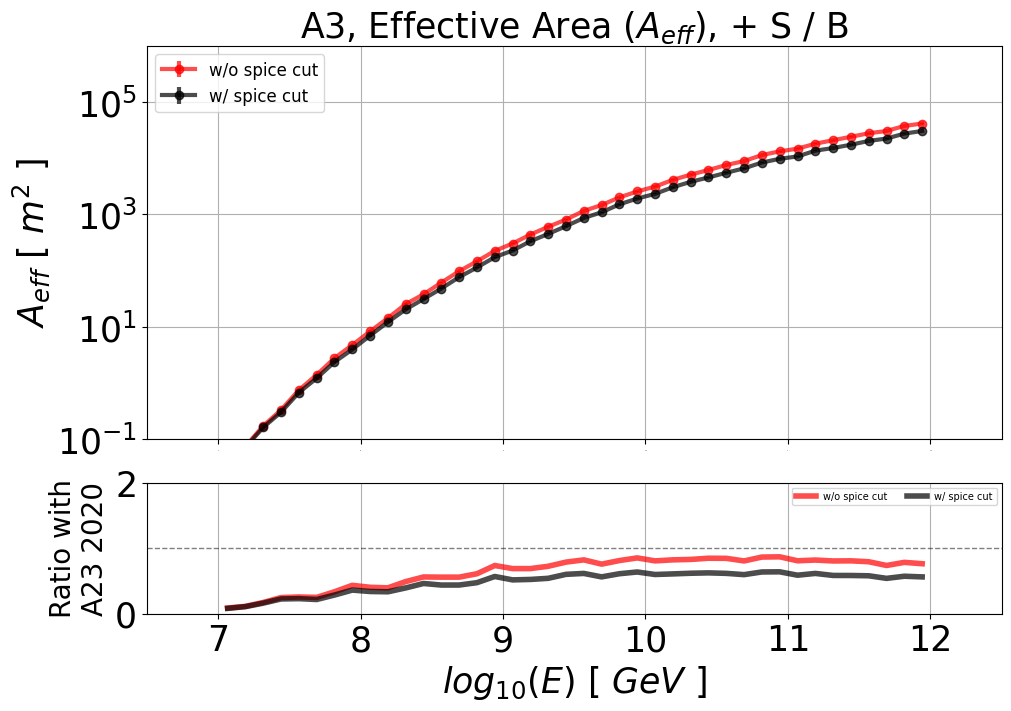
Fig. 165 Effective area in after all cuts
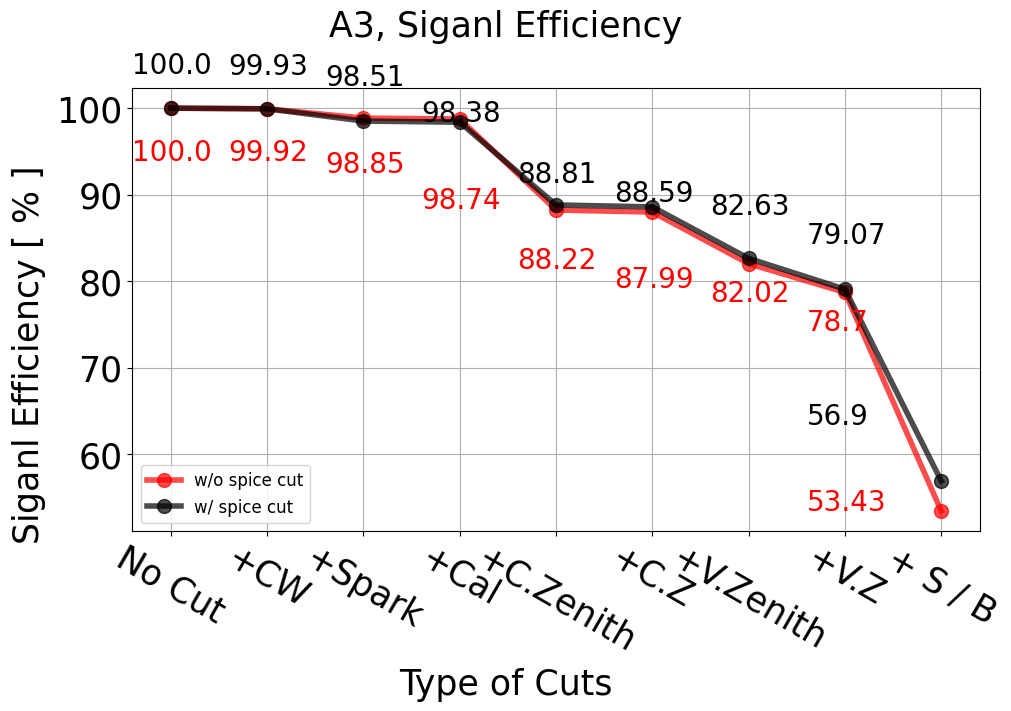
Fig. 166 Signal efficiency of each cut
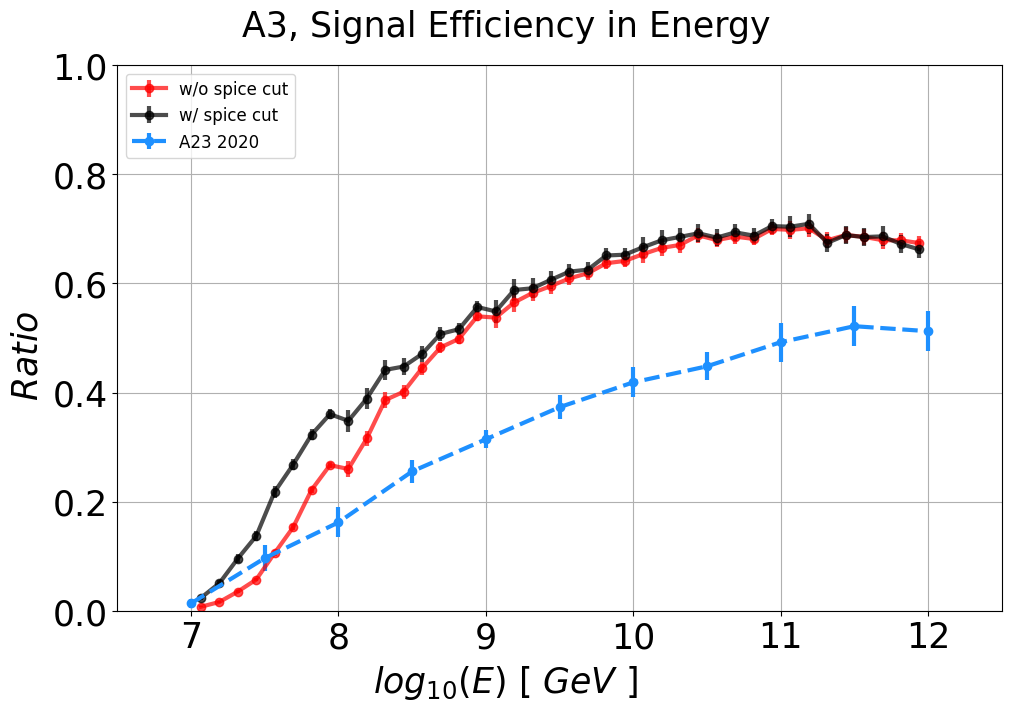
Fig. 167 Signal efficiency in energy
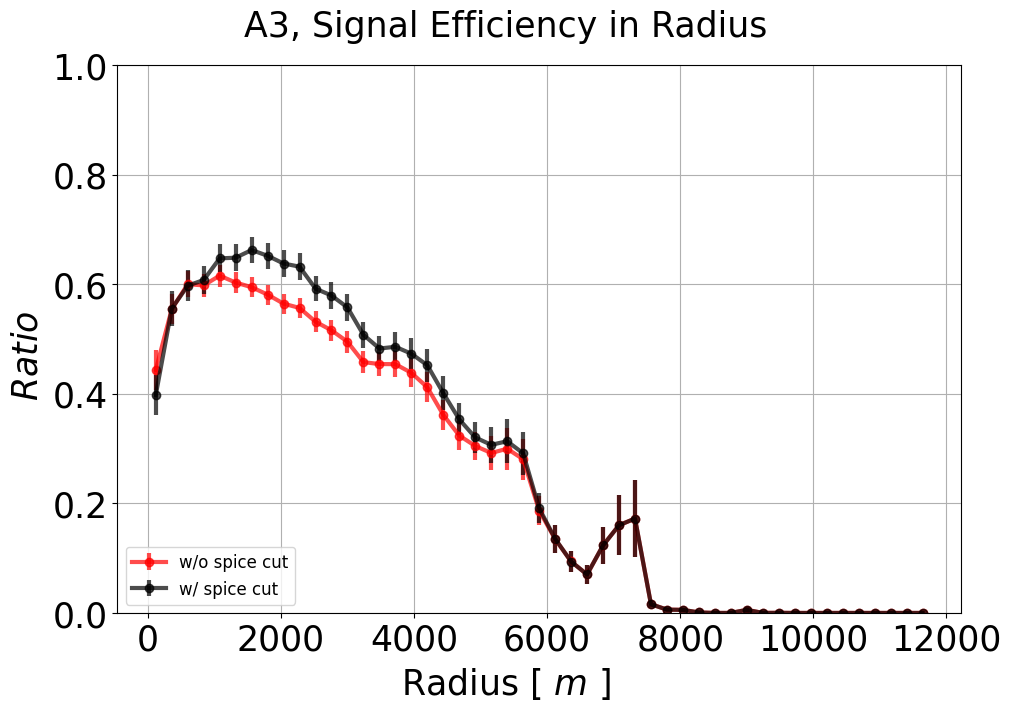
Fig. 168 Signal efficiency in Radius
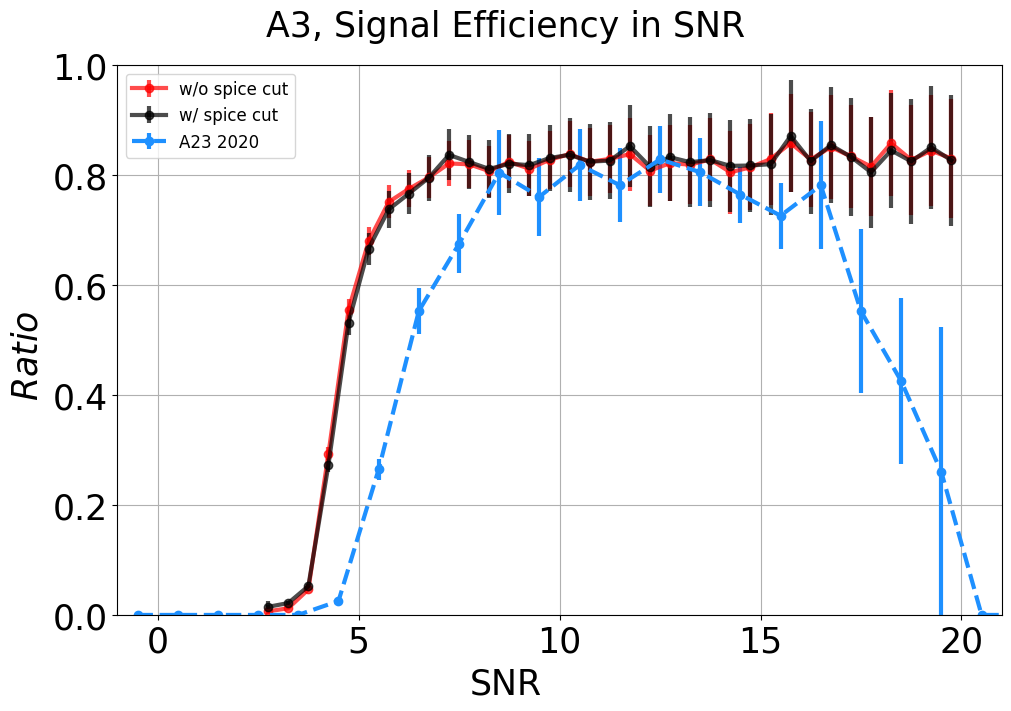
Fig. 169 Signal efficiency in SNR
Event rate
Because of SPICE core cut event passing rate is go down to 0.27 from 3.35

Fig. 170 A2. Event rate
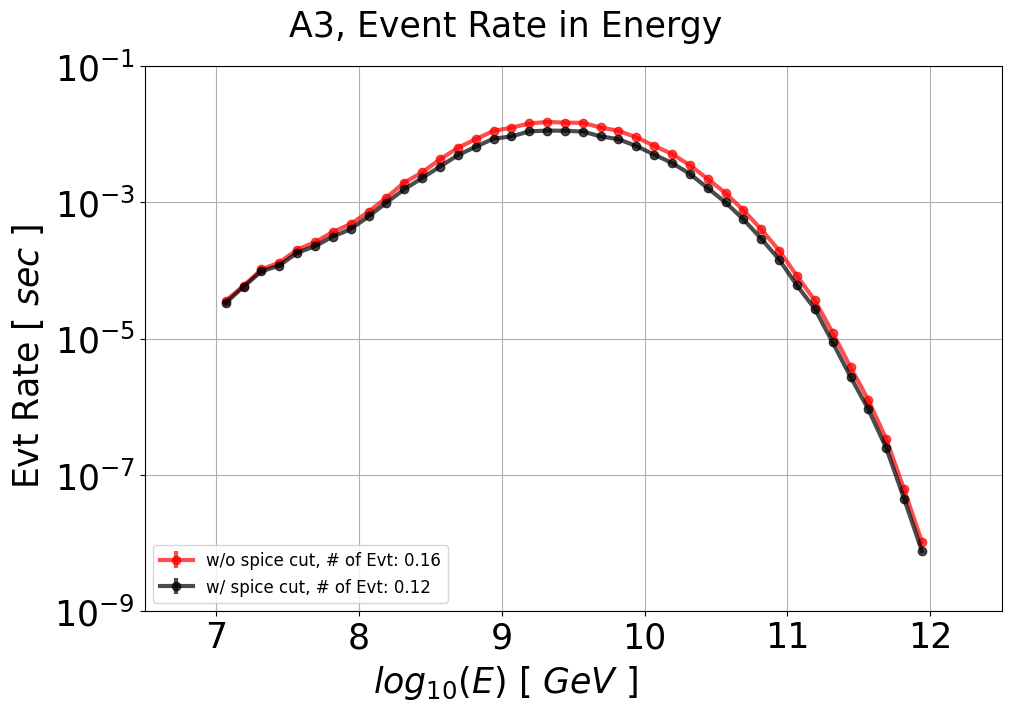
Fig. 171 A3. Event rate
Sensitivity
Block solid line is final sensitivity of detector after applying spice cut. Red dashed line is without spice cut
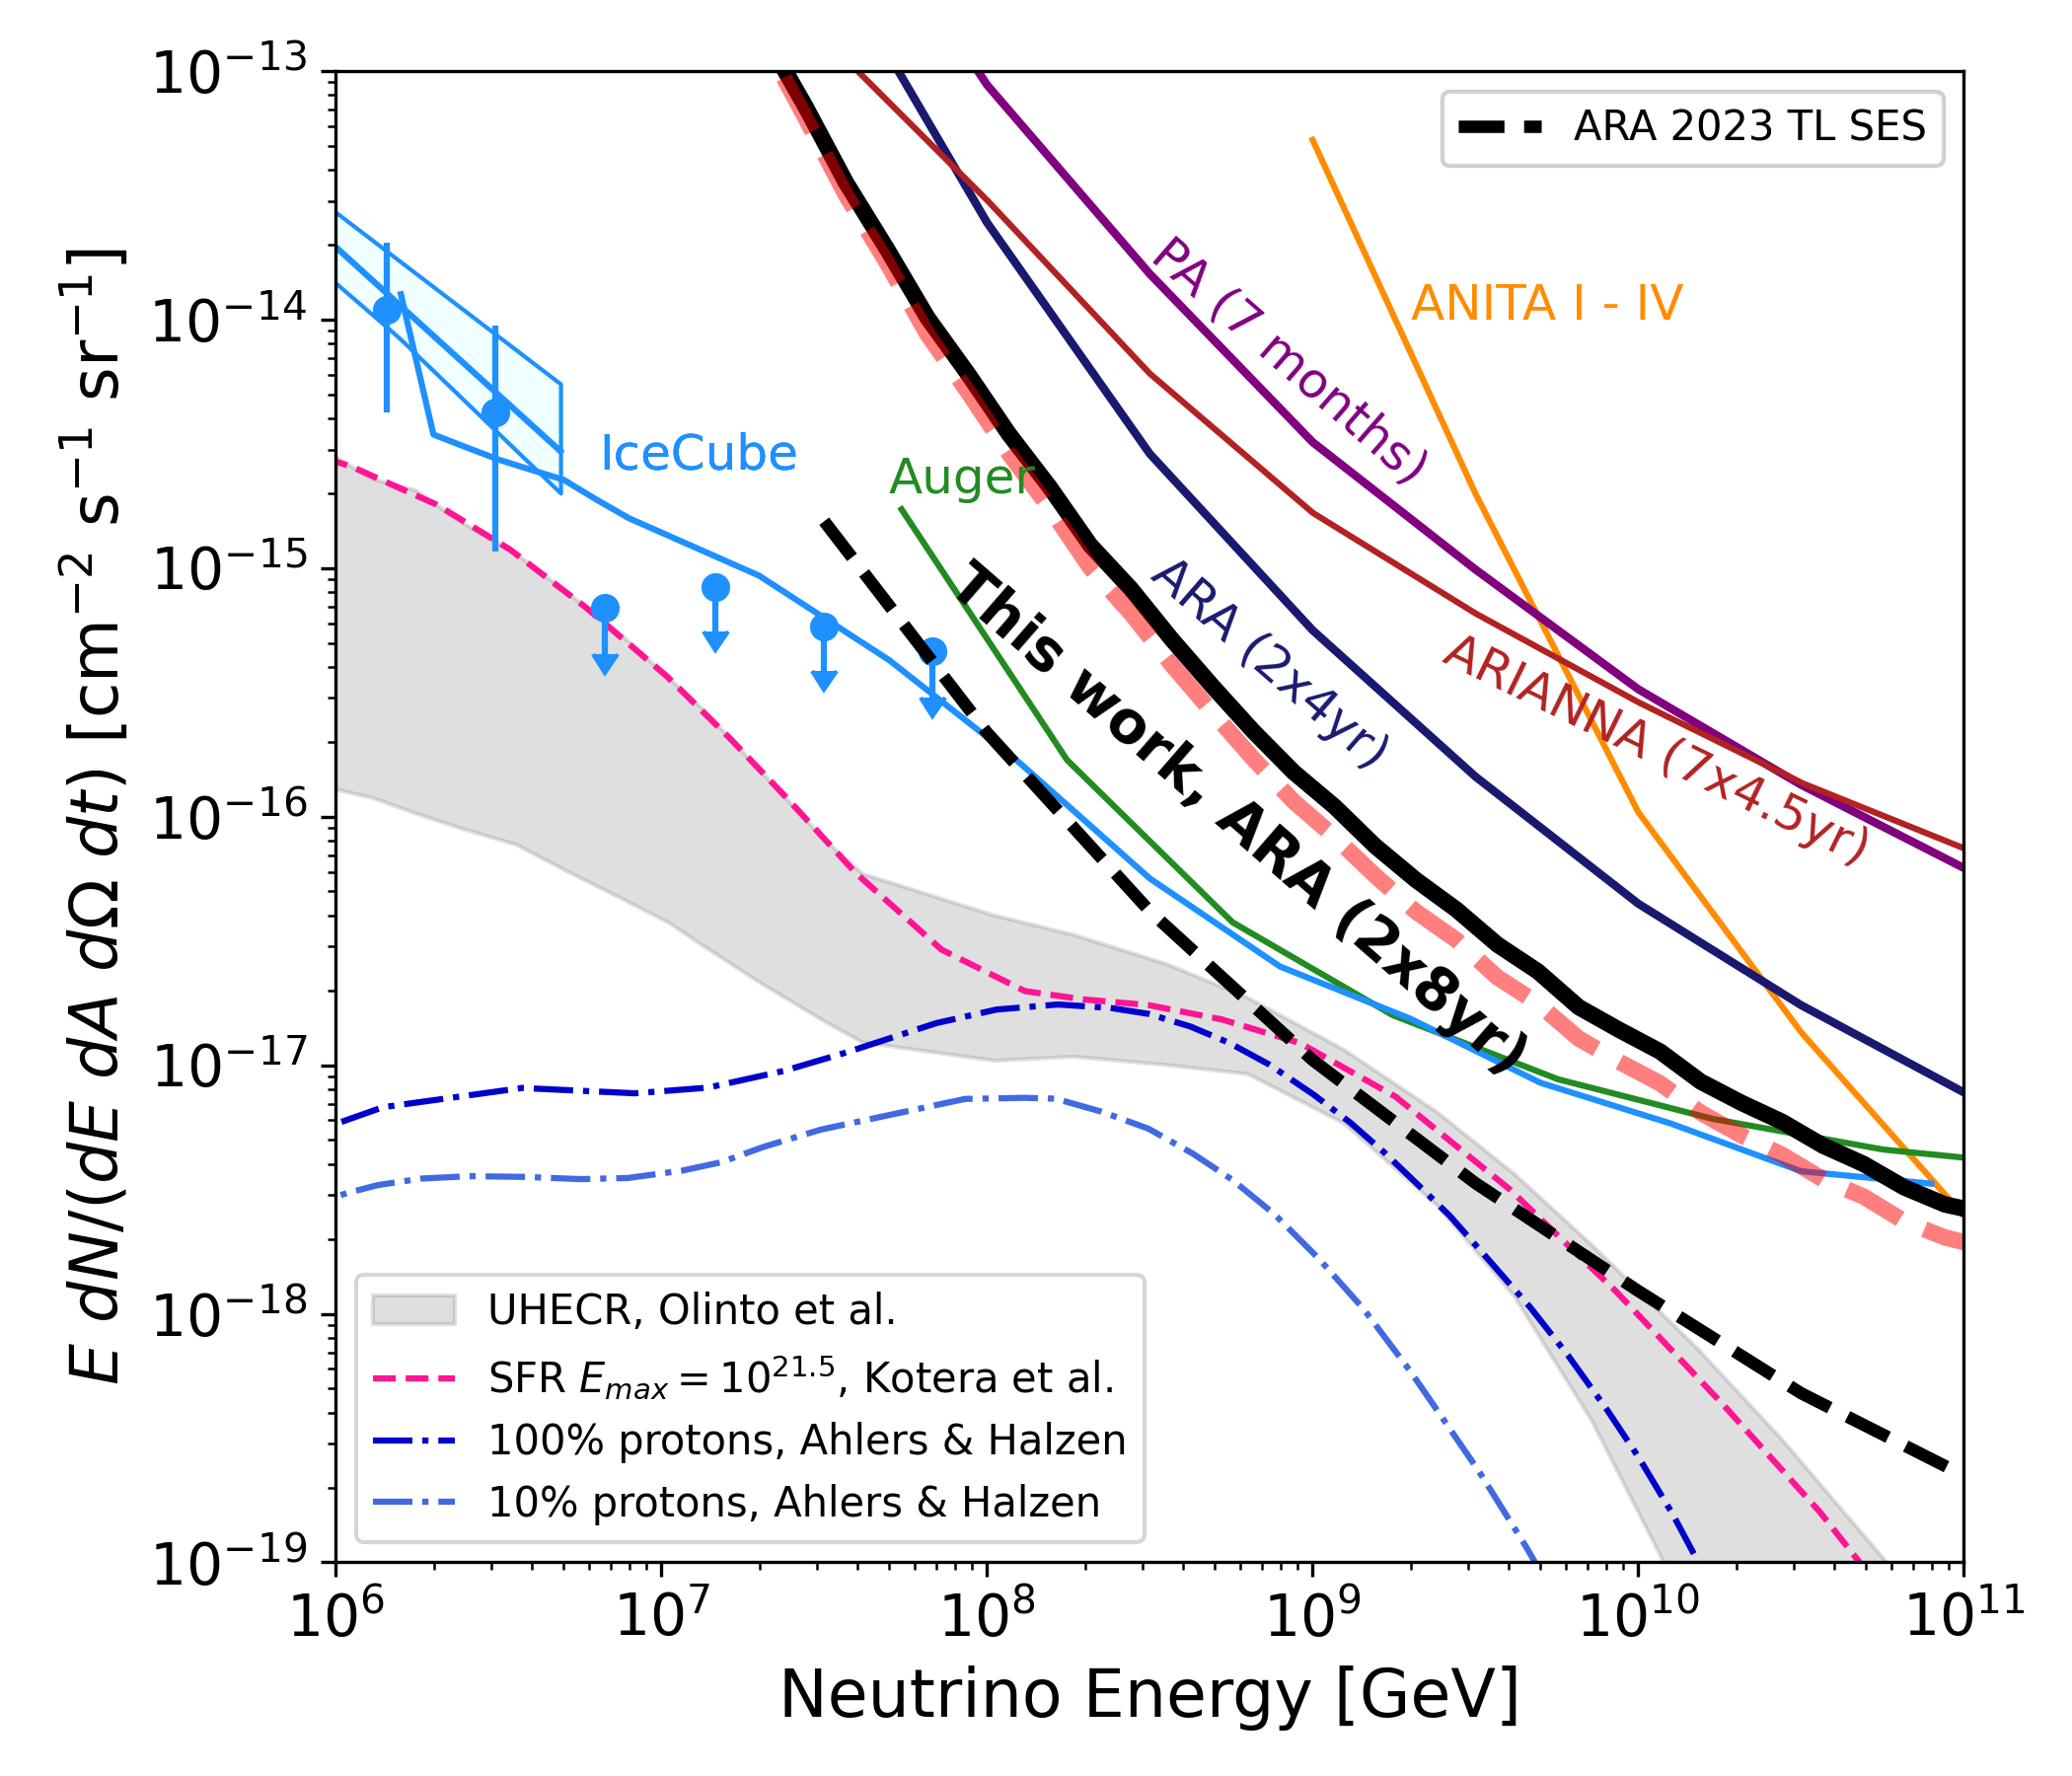
Fig. 172 Sensitivity in E2
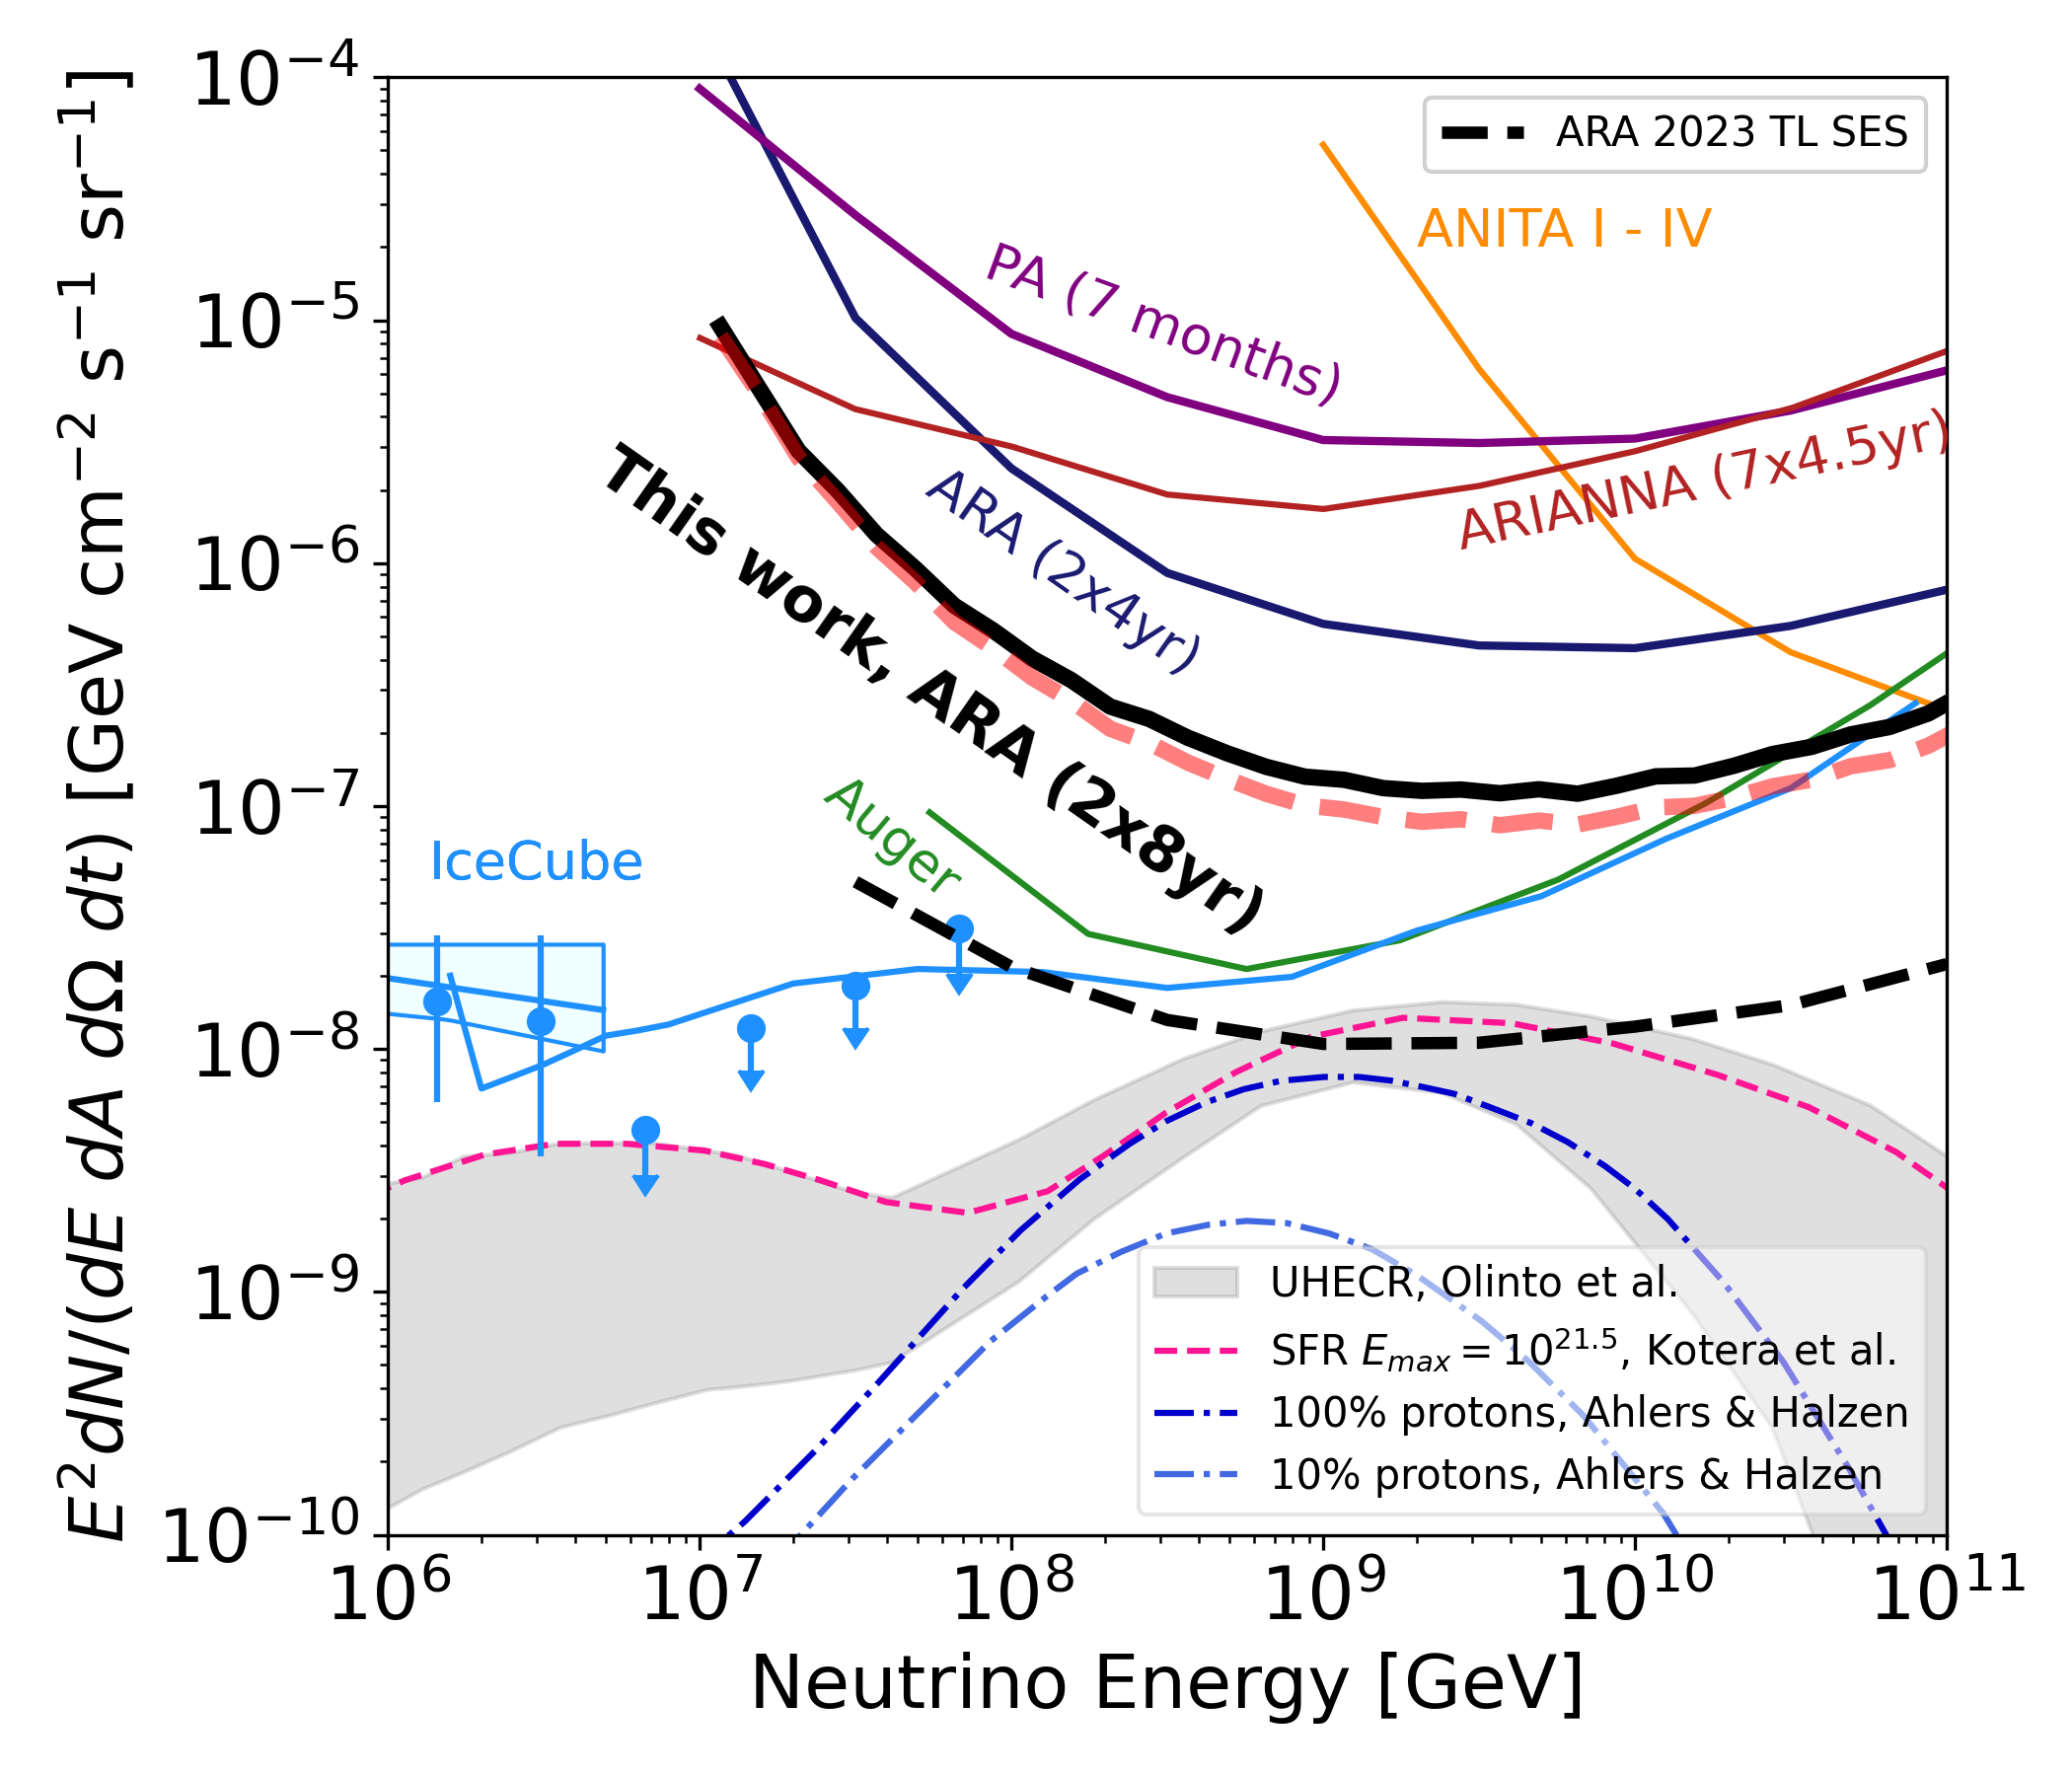
Fig. 173 Sensitivity in E1