Effective Area
Aeff, efficiencies, and event passing rate are done by Check_Sim_v36.7_aeff_sig_eff_evt_rate_combine_old_compariosn_w_err_total_w_edge
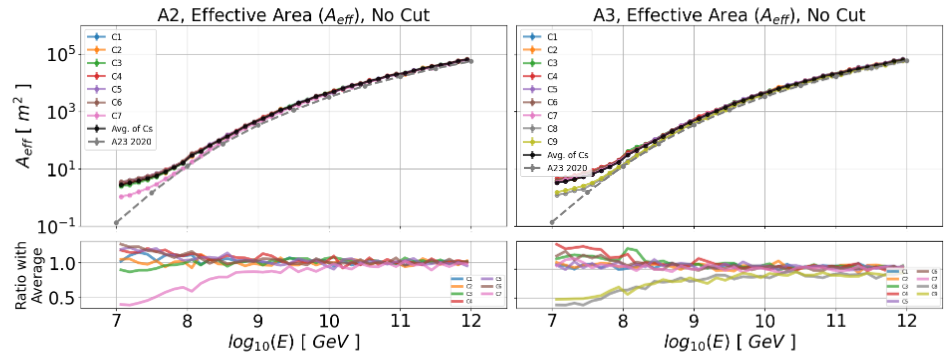
Fig. 137 A23 Aeff
Effective areas of corresponding simulation set: 7 set for A2 and 9 set for A3
Applied new gain model (antenna / signal chain)
A2: config 7 and A3: config 8/9 are have low area because of less # of channels (75 %) are contributed for triggering detector
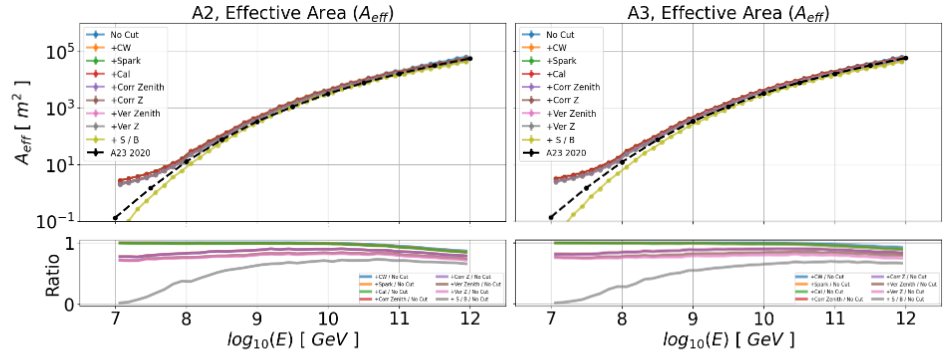
Fig. 138 A23 Aeff with all cuts
+CW: cw ratio cut, +Spark: spark event, +Cal: calpulser cut, +Corr Zenith & +Corr Z: surface cut by interferometry, +Ver Zenith & +Ver Z: surface cut by AraVertex
Plus in the legends mean it is including previous cuts
All the cuts are clustered in the trigger level except surface (corr) and signal/background cuts (S / Ba)
Dashed line is trigger level area from previous A23 analysis
A2 Signal Efficiency in Energy
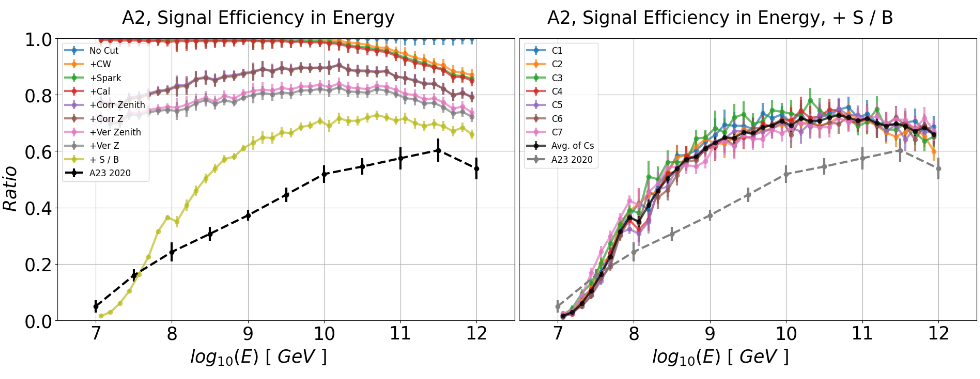
Fig. 139 A2 Efficiency in Energy
CW Cuts are taking out high energy signal
unfortunate mis-filtering of strong amplitude signal
Total surface cuts took out ~20% of efficiency
A3 Signal Efficiency in Energy
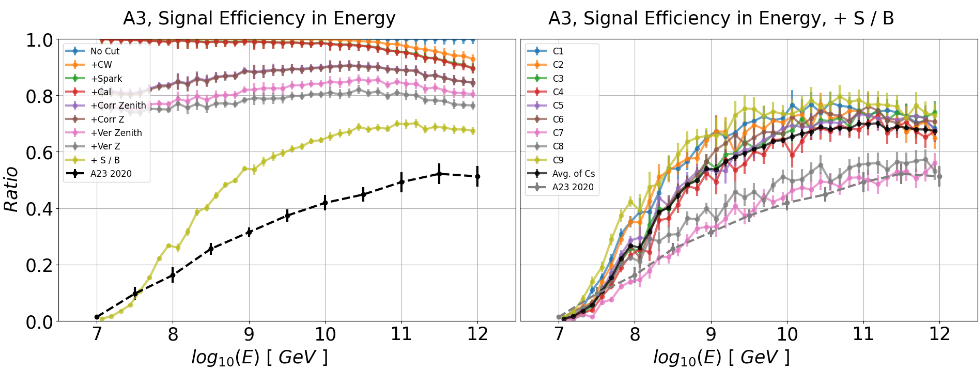
Fig. 140 A3 Efficiency in Energy
CW Cuts are taking out high energy signal
unfortunate mis-filtering of strong amplitude signal
Calpulser cut also had contribution in high energy because of large cut region
Total surface cuts took out ~20% of efficiency
Config 7 & 8 have a lower efficiencies because of the lack of accuracy of reconstruction by only using 4 channels per polarization
A2 Signal Efficiency in SNR
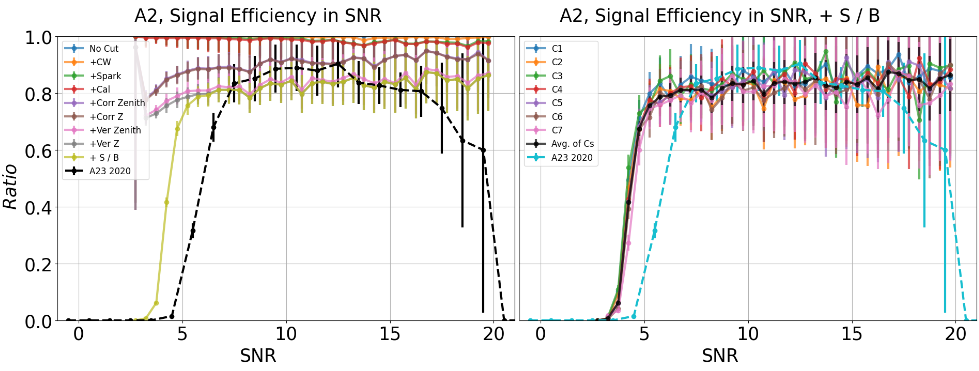
Fig. 141 A2 Efficiency in SNR
SNR is calculated in ‘banila’ status
No CW/band-pass filter
RMS is avg. of software trigger
P2P is same as FFTtools method
3rd highest SNR among the channels are selected to represent the efficiency
A3 Signal Efficiency in SNR
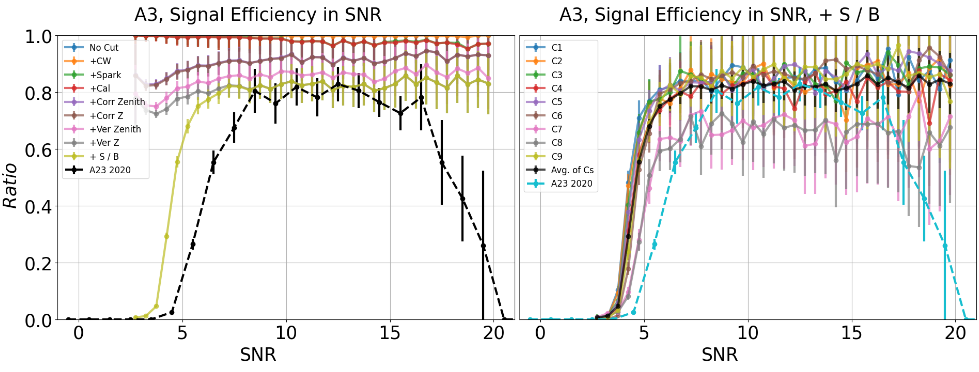
Fig. 142 A3 Efficiency in SNR
SNR is calculated in ‘banila’ status
No CW/band-pass filter
RMS is avg. of software trigger
P2P is same as FFTtools method
3rd highest SNR among the channels are selected to represent the efficiency
A2 Signal Efficiency in Radius
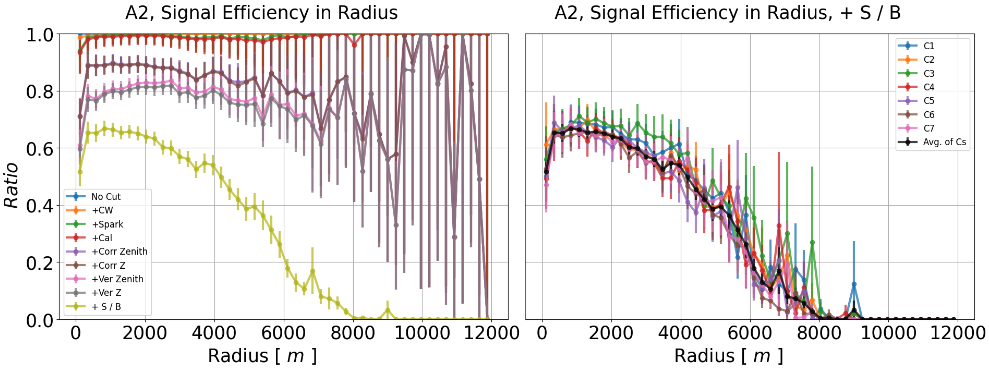
Fig. 143 A2 Efficiency in Radius
A3 Signal Efficiency in Radius
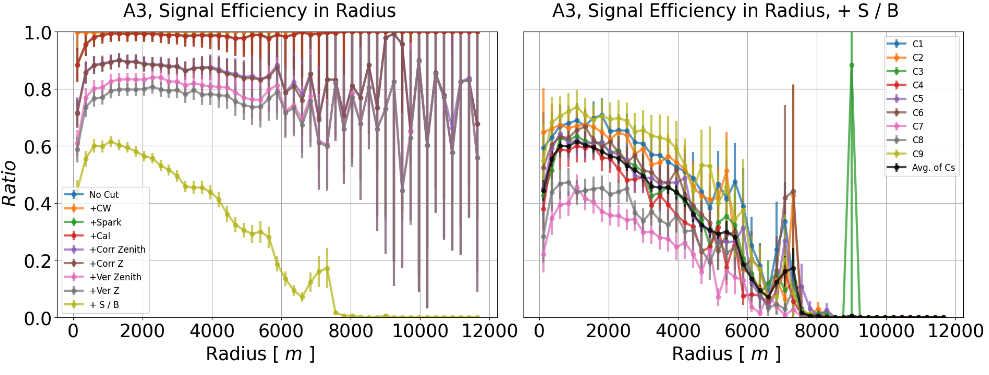
Fig. 144 A3 Efficiency in Radius
Event rate
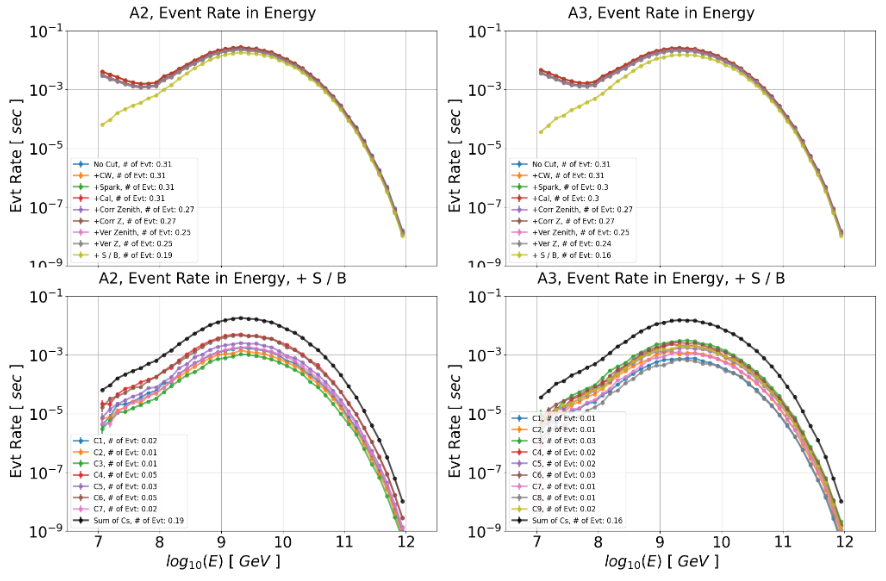
Fig. 145 A23 event rate
GZK Kotera model is used
Total ~0.35 events (A2: 0.19, A3: 0.16) are expected based on livetime and analysis
Sensitivity
This is done by Check_Sim_v37_sensitivity_total
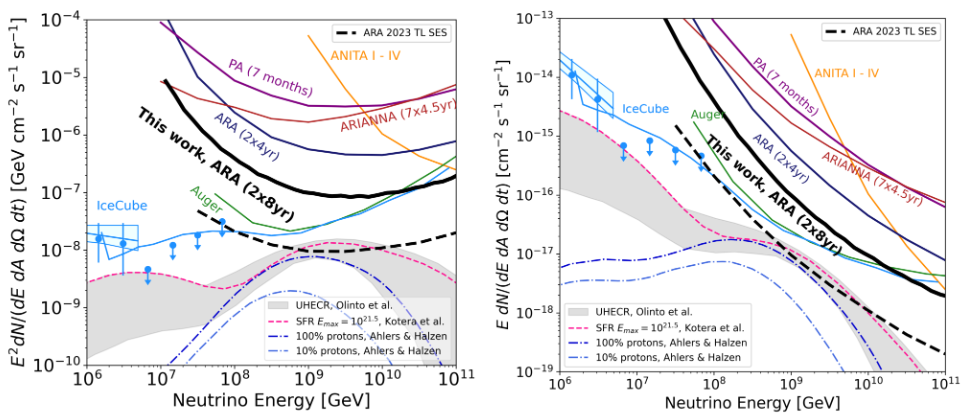
Fig. 146 A23 Sensitivity
Factor ~4 improvement from previous A23 analysis (2 x 4 yrs)
1.7 from increased livetime and 2.3 from new gain model and analysis
Dashed line is projection of single event sensitivity in 10 years with all 5 stations
Only A23 data is updated. other stations are same as previous analysis