Atmospheric Neutrino Unblinding Proposal
AMANDA-II 2000-2006
John Kelley, UW-Madison, May 2008
5. Simulation
To simulation our atmospheric neutrino prediction, we have generated nine
periods of MC (2000p1, 2000p2, 2000p3, and each year from 2001 to 2006) with
the following settings:
Generator |
nusim |
Spectrum |
E^-1.5 |
Zenith range |
80-180 |
Energy range |
10 GeV to 100 PeV |
Detector MC |
Amasim aluminum-opt5 |
Photon propagation |
Photonics 1.54-caustic |
Ice |
AHAv1, finely binned |
Furthermore, to model the systematic effects of OM sensitivity, we have generated
each of these nine periods with seven different OM sensitivities
(existing sensitivities scaled from 70%-100% in 5% increments), for
a total of 63 MC sets. At the final cut
level, after reweighting to an atmospheric spectrum we have approximately 60 years
of effective livetime for each
OM sensitivity.
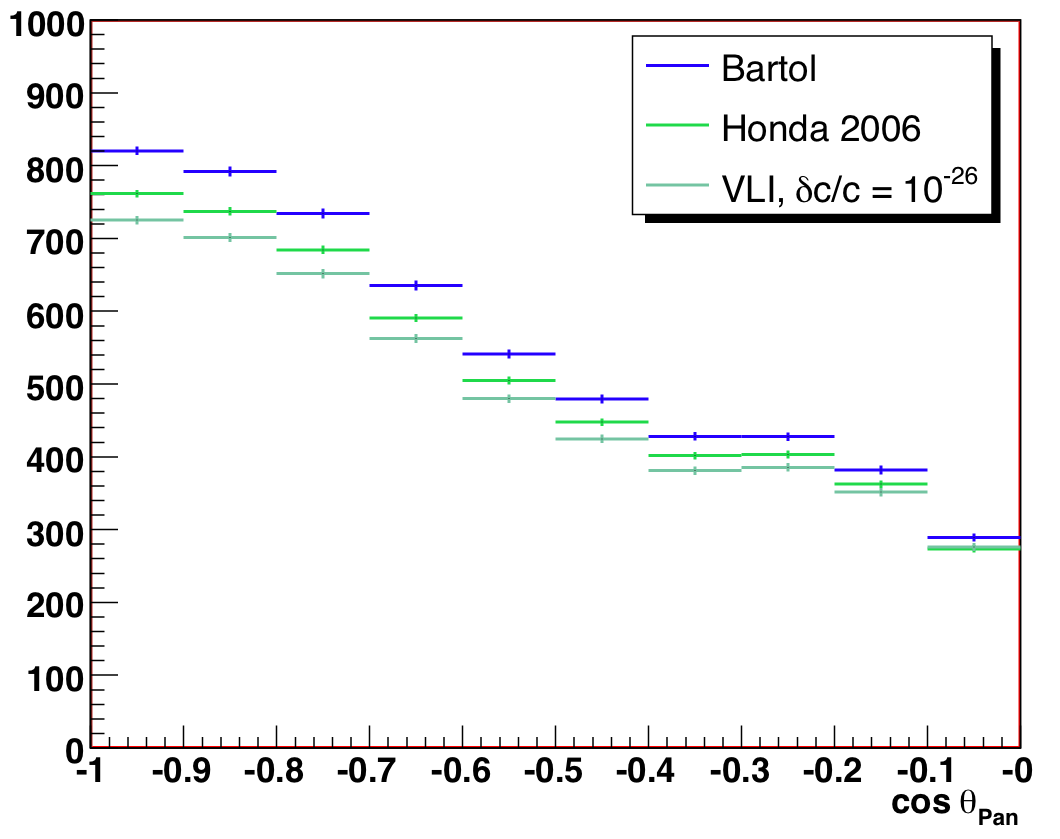
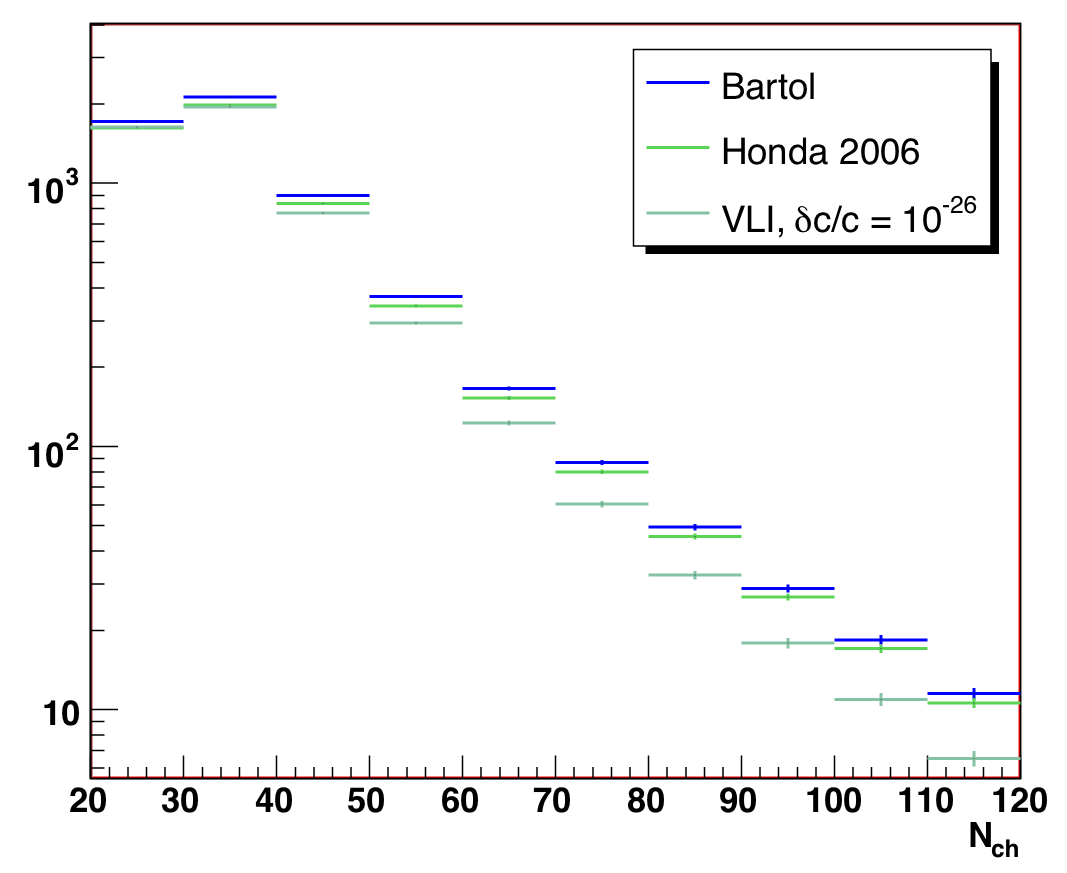
Observables
Figures 5.1 and 5.2 below show the two observables, cos(Zenith)
and Nch, at the final cut level, and for
the binning and ranges suggested in
the analysis section, for two conventional
atmospheric neutrino models and a moderate value of the VLI
parameter delta_c/c of 1e-26.
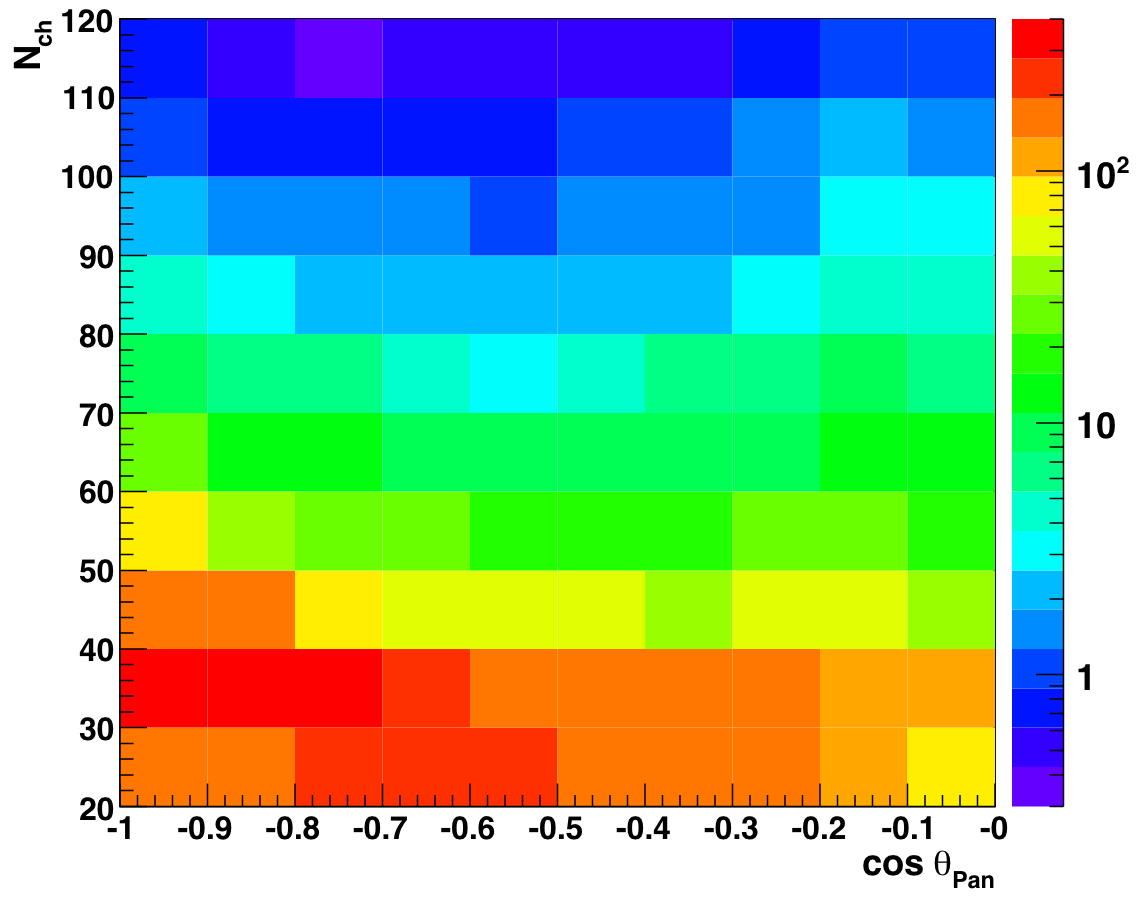
Here we show the same comparison, but in the two-dimensional space in
which the likelihood analysis works (the binning and variable ranges are the
same). The conventional Bartol flux is on
the left, while the VLI oscillations are on the right:
The distributions are hard to tell apart by eye, but the ratio plot is
illuminating, and one can see the effect of the oscillations as we
lose muon neutrinos at high Nch and long baselines (close to vertical):
The likelihood analysis can easily tell these cases apart, even with
systematic errors applied.
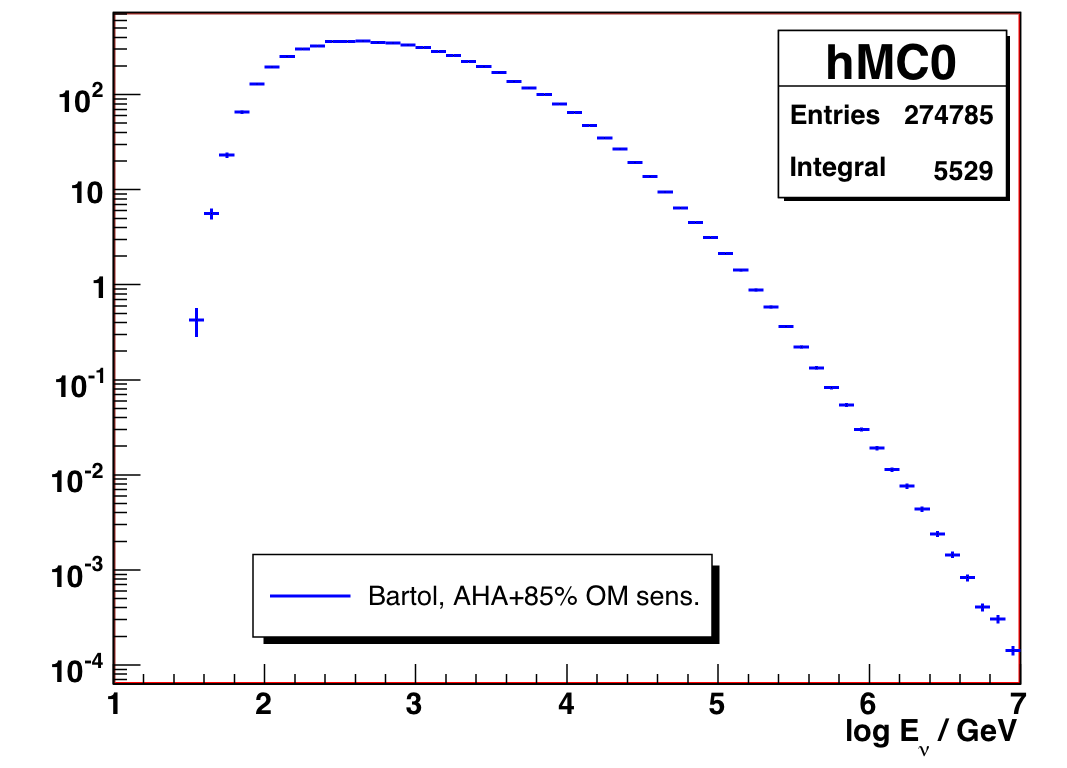
Energy Response
The following figures show the energy response of the detector at the
final cut level, as well as the relationship between energy and number of
channels hit, using a simulated Bartol atmospheric flux.