A parametrization of the atmospheric muon flux in the deep ice
In diffuse neutrino searches it is almost always necessary to estimate the background due to atmospheric muons from simulation. In IceCube this has typically been done directly, by simulating air showers to ground level with CORSIKA, propagating the muons in the shower through the firn and ice with MMC to a cylindrical sampling surface surrounding the detector, and then weighting the simulated events to an assumed cosmic-ray flux. Though this method offers the highest possible precision available from the chosen simulation software, it suffers from two key inefficiencies. First, since the simulation starts with cosmic-ray primaries rather than in-ice muons, one has only loose control over the characteristics of the muon bundles that actually reach the detector. For example, if one were interested only in single muons with a few TeV of energy, one would spend quite a lot of time simulating both showers whose muons never reached the detector those that result in high-multiplicity bundles. Second, the direct approach makes it necessary to repeat the entire simulation chain in order to change aspects of the air shower simulation such as atmospheric profile or hadronic model.
An alternative approach is to de-couple the air shower simulation and muon propagation from the remainder of the simulation by constructing a parametrization of the muon flux under the ice and drawing muon bundles from the parameterized distribution. This allows one to generate specific bundle configurations and weight them properly, and also to re-weight existing simulated events to a muon flux associated with different assumptions about interactions in the atmosphere.
The parametric approach is already used heavily by ANTARES in the form of their MUPAGE event generator. The work described here is an attempt to apply the technique, described in a paper by Becherini et al, to IceCube simulation.
How the parametrization was made
Propagation
The initial set of fits was made using a set dCORSIKA F2k files that were stored on /data/sim as an intermediate step of IC79 simulation production. Approximately 25 billion air showers were simulated on an \(E^{-2}\) spectrum from 600 GeV/nucleon to 100 PeV, with a 10:5:3:2:1 ratio of proton/He/N/Al/Fe primaries. The simulations were split evenly between atmosphere parametrizations 11 to 14 and used SIBYLL to simulate hadronic interactions. The muons from the shower were then propagated through firn and ice with PROPOSAL and recorded at a set of vertical depths spaced every 100 m between 1 and 2.8 km.
Variables
At each vertical depth and zenith angle the number of surviving muons was tabulated, along with the energy of each and its distance from the shower axis. This is a complete description of the bundle under 4 approximations:
- The flux of cosmic-ray primaries that reach the atmosphere and their daughter muons is independent of the azimuthal arrival direction.
- The bundle is azimuthally symmetric around the shower axis.
- All muons in the bundle are perfectly parallel to each other and to the shower axis.
- The shower front has no curvature.
The first assumption is violated by deflection in the Earth’s magnetic field, but the same approximation is used whenever dCORSIKA showers are randomized in azimuth before being fed in to IceTray (i.e. nearly always). The remaining three approximations are important only if it is possible to measure very detailed properties of the bundle structure over relatively short (~1 km) observation baselines.
The variables were filled into a set of histograms with increasing dimensionality:
- Multiplicity: 3 dimensions (zenith, depth, multiplicity)
- Radius: 4 dimensions (zenith, depth, multiplicity, radius)
- Energy: 5 dimensions (zenith, depth, multiplicity, radius, energy)
Spline tables
In their parametrization, Becherini et al fit the single-muon flux, ratio of single- to n-muon bundles, normalized radial distributions, and normalized energy distributions to a stable of relatively simple functional forms (polynomials and power laws in depth and zenith angle). While this resulted in a small number of parameters that could be printed in a journal article, re-fitting those forms to our simulation turned out to require a great deal of manual fiddling and yield unsatisfactory fits in the range of depths important for IceCube simulation.
Instead of simple functions, this parameterization uses tensor-product B-splines from the Photospline package to smoothly interpolate between the bins of the histograms. The resulting surfaces fit much more closely to the underlying histograms than the functional forms given in Becherini et al, but without requiring a great deal of creativity in inventing new terms to fix mismatches that appear only in small regions of the parameter space. With appropriately chosen regularization they can even be used to reliably extrapolate into unpopulated regions of the histograms.
Some additional transformations were applied to make the distributions more polynomial-like:
- Flux: \(\ln \Phi\) vs \(\cos\theta\), depth, multiplicity
- Radius: \(\ln(dP/dr^2)\) vs \(\cos\theta\), depth, multiplicity, radius
- Energy: \(\ln(dP/dE)\) vs \(\cos\theta\), depth, multiplicity, radius, \(\ln E\)
All were fit with an order-2 regularization that penalizes any curvature in the fit surface, that is, it prefers straight lines in the absence of strong evidence from the data. The transformations applied to the flux and radial distributions turns this into exponential extrapolation; the energy distributions are extrapolated as power laws.
Fits
The following examples are fits to dCORSIKA simulation with SIBYLL, weighted to the spectrum of Hoerandel.
Single-muon flux
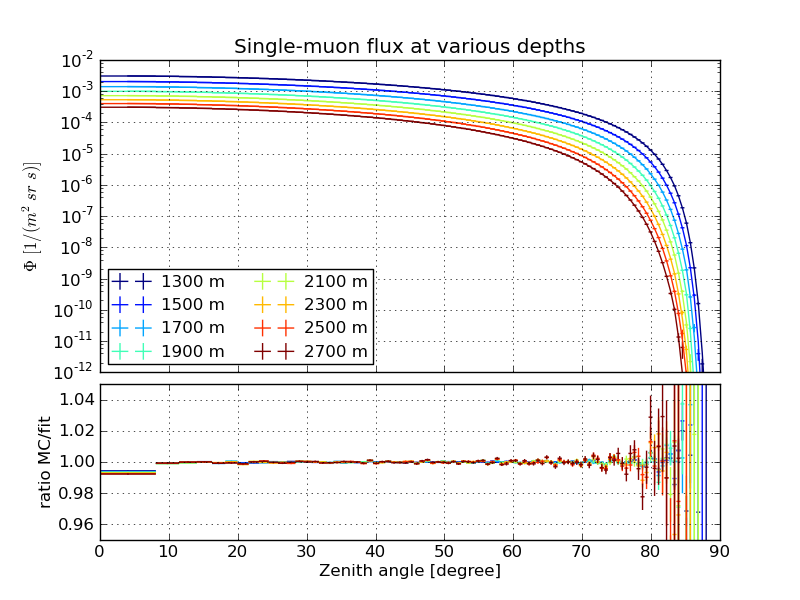
March 31st atmosphere
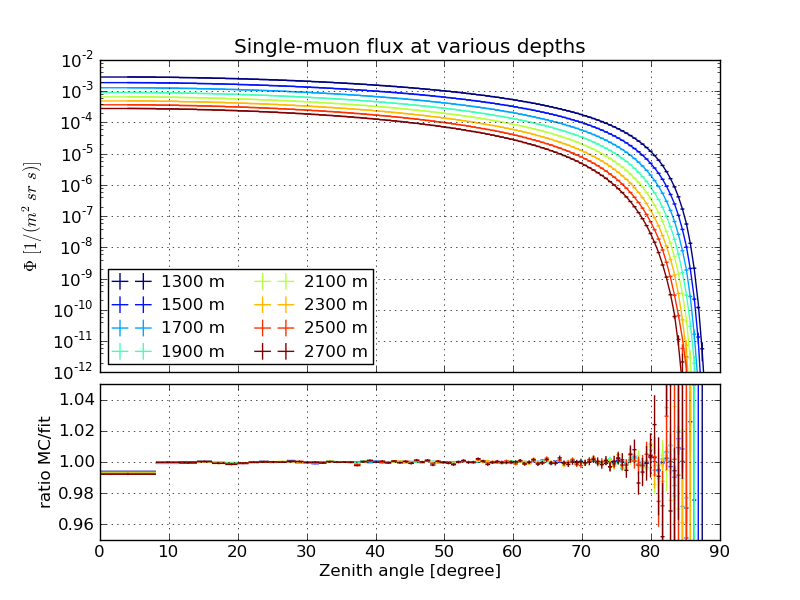
July 1st atmosphere
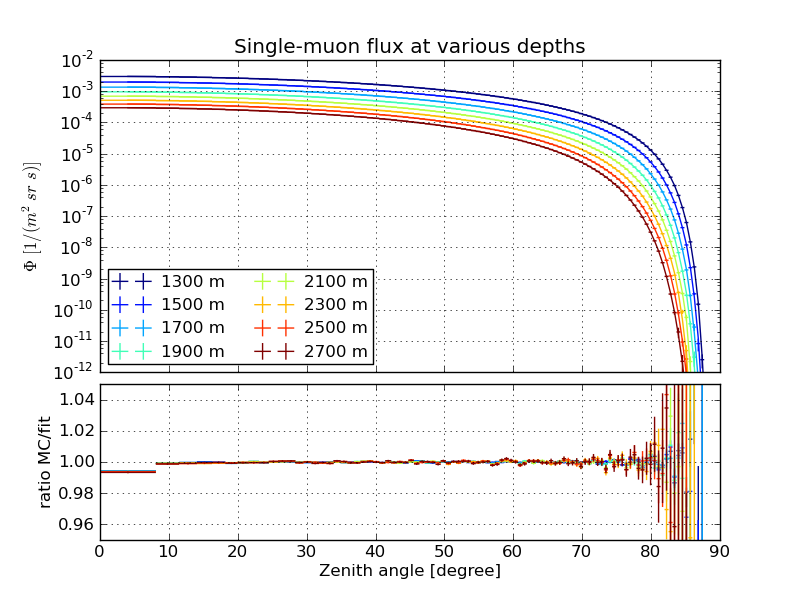
October 1st atmosphere
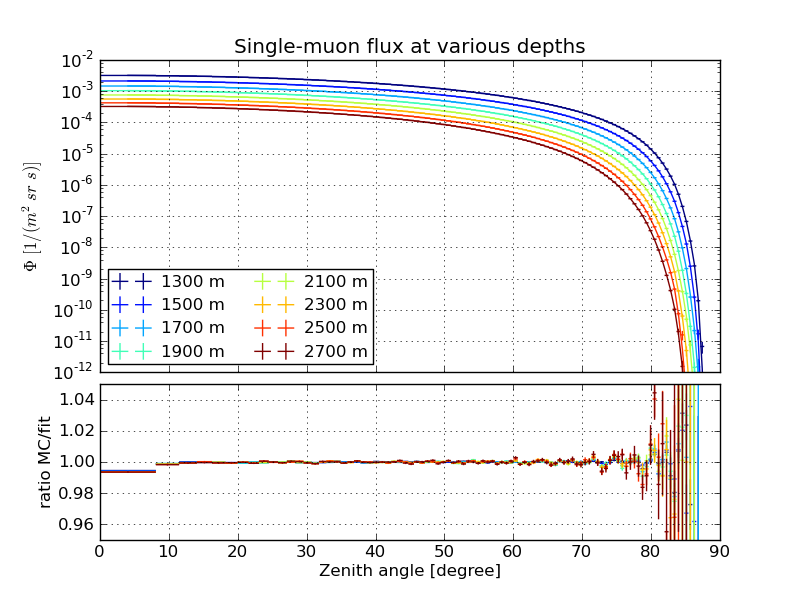
December 31st atmosphere
Bundle flux
Flux as a function of bundle multiplicity, March 31st atmosphere
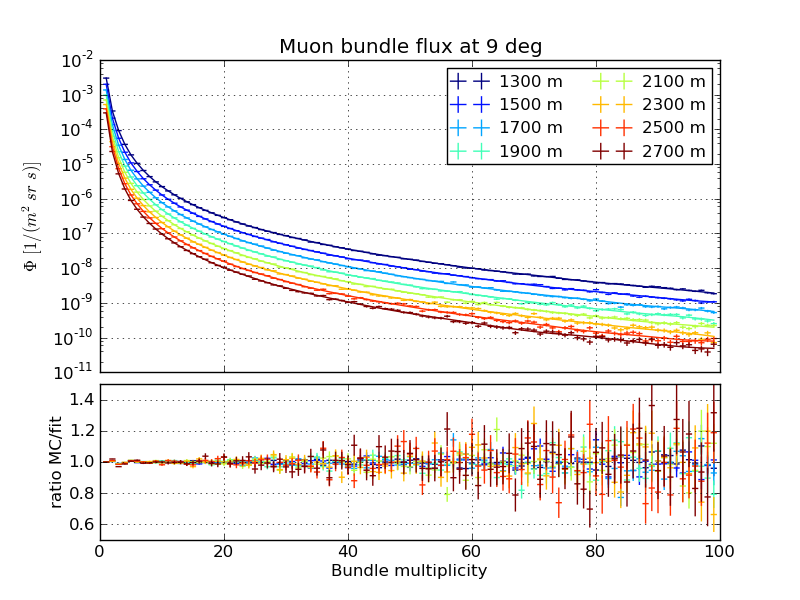
Zenith 9 degrees
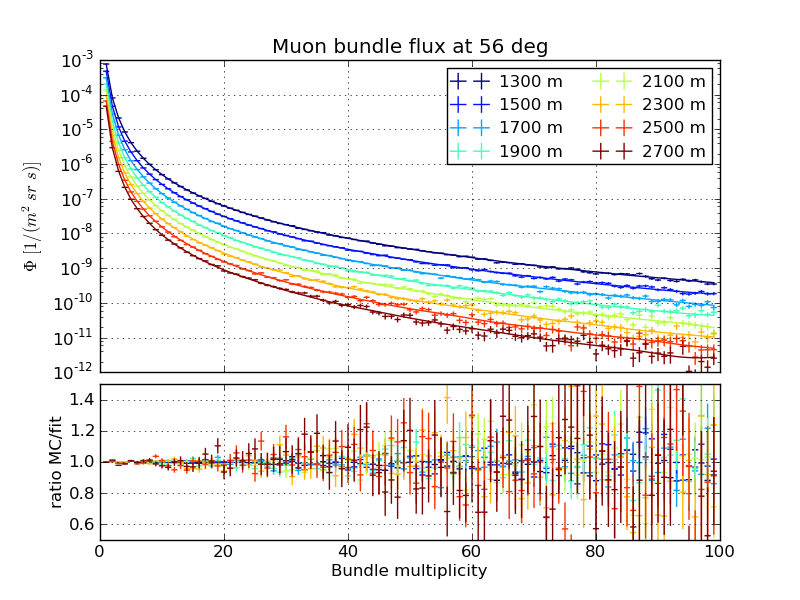
Zenith 56 degrees
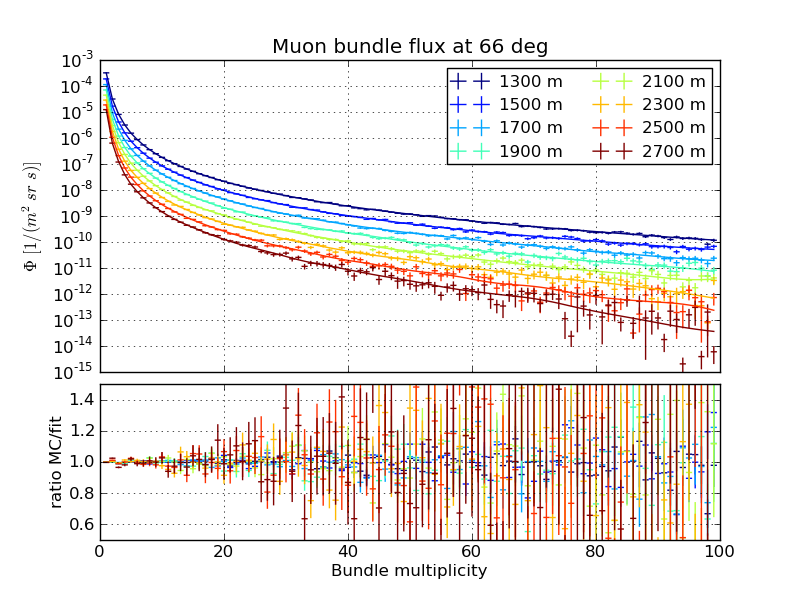
Zenith 66 degrees
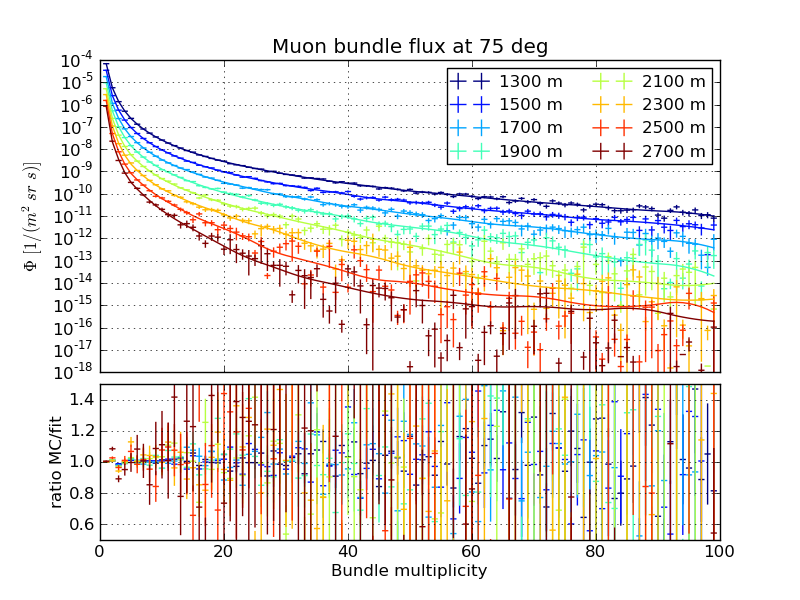
Zenith 75 degrees
Radial distribution
Slices of the normalized radial distribution, March 31st atmosphere
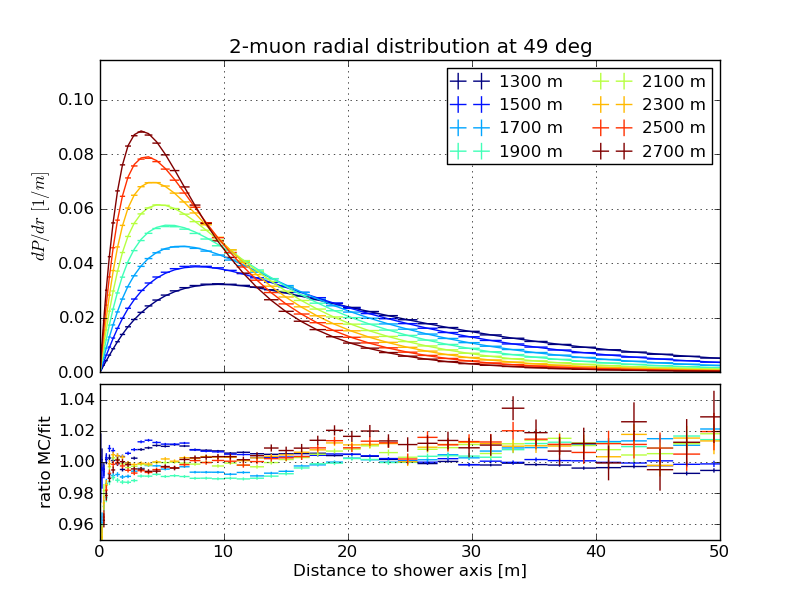
Varied depth
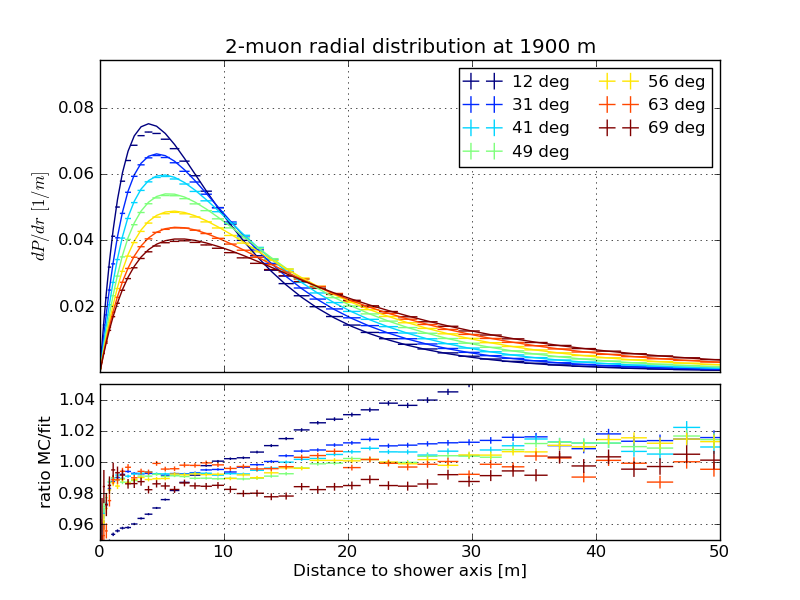
Varied zenith
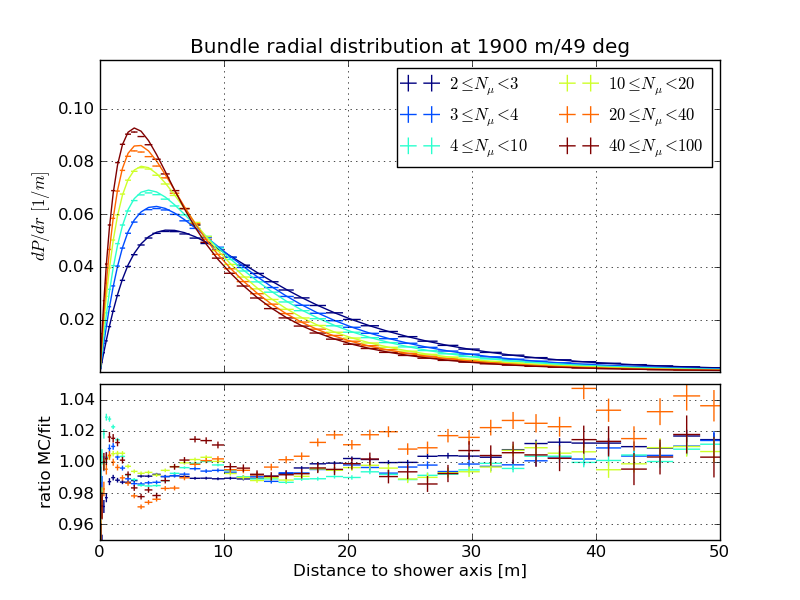
Varied multiplicity
Energy distribution
Slices of the normalized single-muon energy distribution, March 31st atmosphere
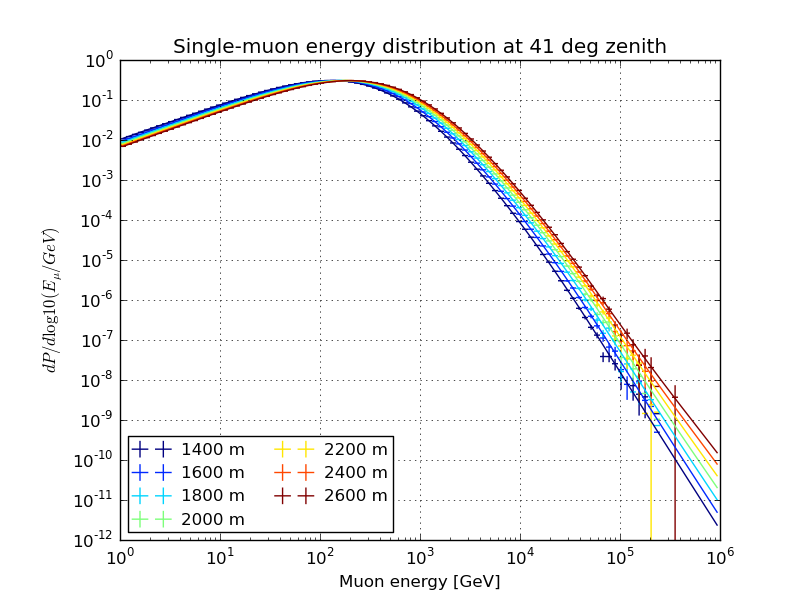
Varied depth
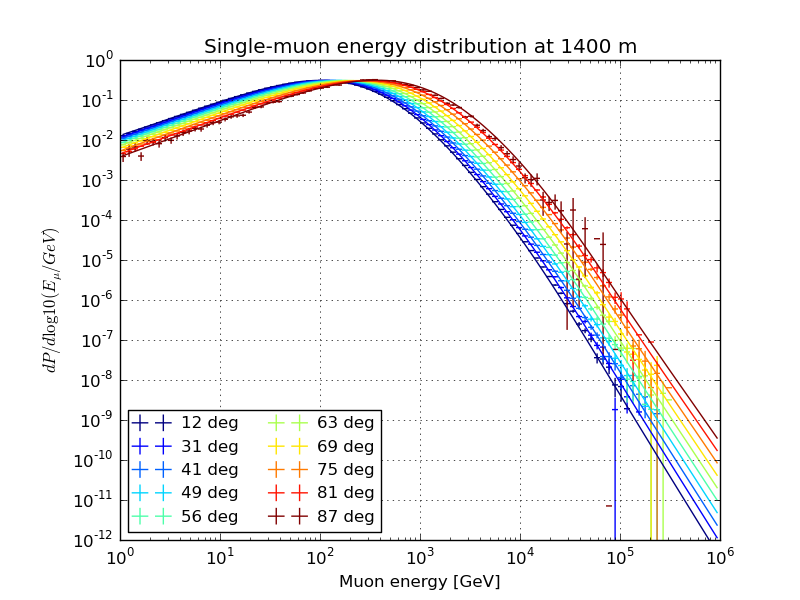
Varied zenith
Slices of the normalized multi-muon energy distribution, March 31st atmosphere
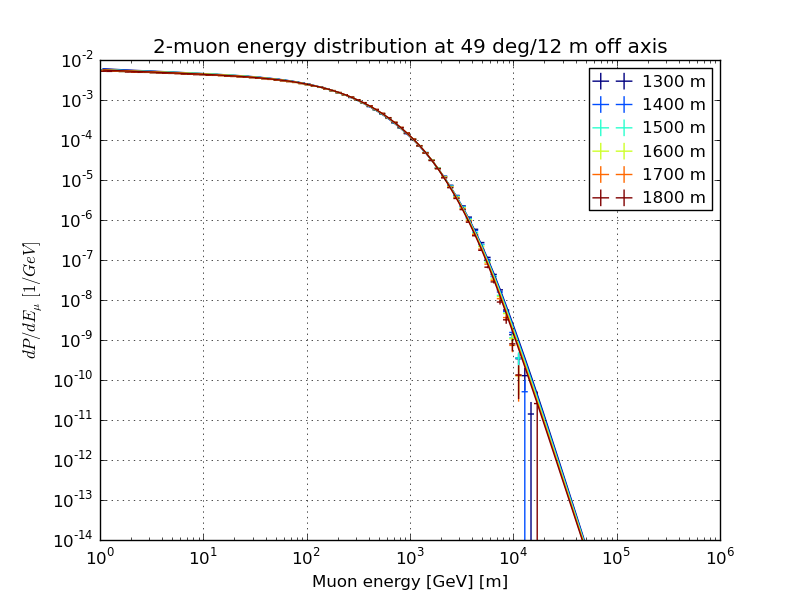
Varied depth
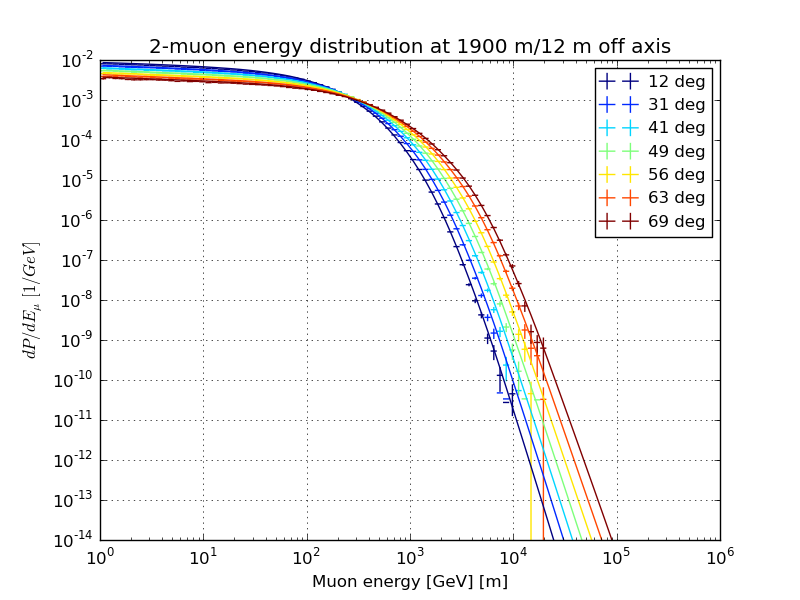
Varied zenith
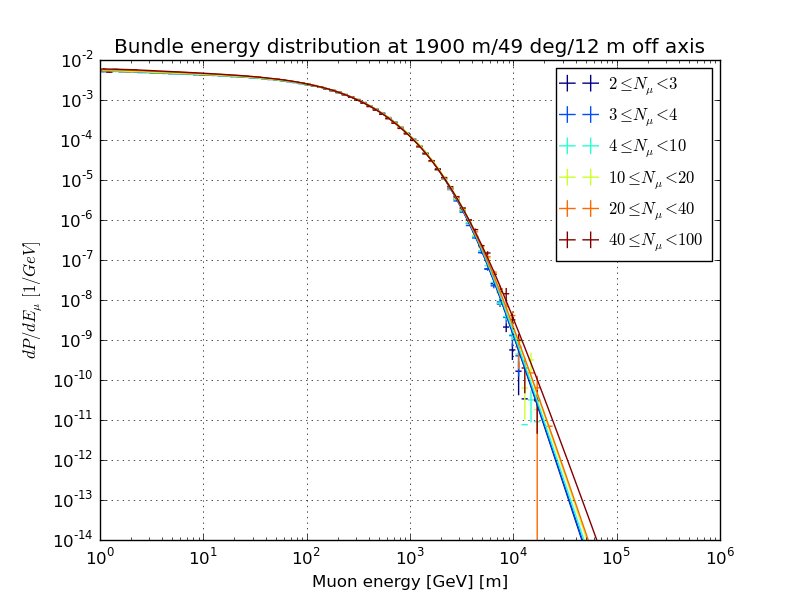
Varied multiplicity
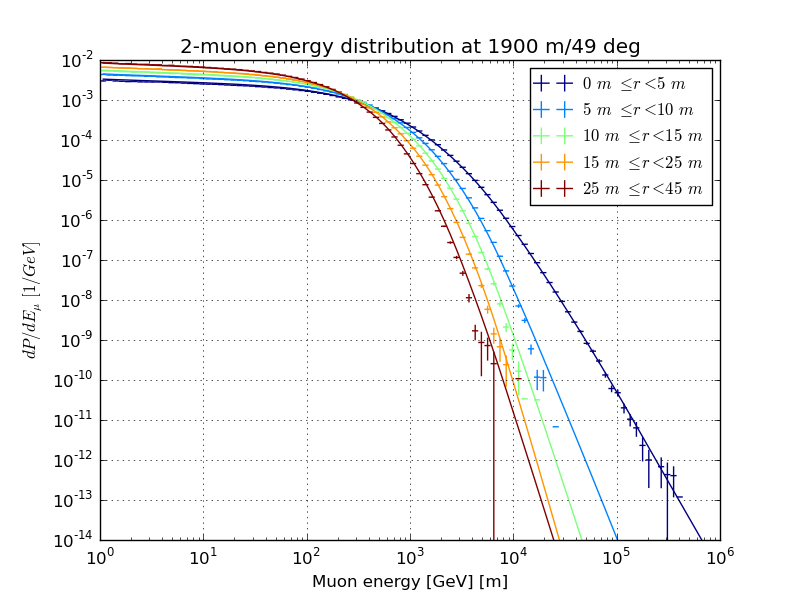
Varied radius
Sampling
Having access to the underlying distributions opens up a number of possibilities for combining unbiased and weighted sampling techniques for different dimensions of the problem. The method implemented in MuonGun at the moment generates muon bundles on a fixed cylindrical surface, and is very similar to the one described in the MUPAGE paper.
It consists of 3 steps: first, a choice the core position and multiplicity, followed by a choice of radial distance from the shower axis for each muon in the bundle based on the core position and multiplicity, followed by a choice of energy for muon.
- Choose an arrival direction (\(\theta\), \(\phi\)) uniformly from the upper hemisphere
- Choose a core position uniformly on the surface of the cylinder projected along the arrival direction, and find the vertical depth \(d\)
- Choose a multiplicity \(m\) uniformly from a set range
- Evaluate the flux at the chosen zenith angle, intersection depth, and multiplicity, and accept the configuration according the following likelihood ratio:
- For single muons, the muon can be assumed to be colinear with the shower axis. For \(m >= 2\), draw samples from the (normalized) radial distribution \(\frac{dP}{dr}(\theta, d, m, r)\) by rejection sampling. Then, draw a uniformly-distributed azimuthal angle and rotate the offset track around the shower axis.
- For energy, draw a sample from a fixed offset power law \(\frac{dP}{dE} \propto (E+b)^{-\gamma}\). This is done to avoid costly rejection sampling on a steeply falling spectrum as well as allow better control over the generated energy distribution.
To actually make use of the simulation, one has to calculate weights to turn the event counts into rates. These are given by:
Based on its configuration the generator knows how to calculate \(N_{generated}\) for any given muon bundle, so one can always re-weight to a different muon flux model based on other assumptions about the nucleon flux, hadronic model, or atmospheric profile.
Combining with dCORSIKA
Event samples generated using this method can be combined with conventional samples generated directly using dCORSIKA. To calculate the correct weight, one simply has to parameterize the distribution of muons produced with the given dCORSIKA configuration (just as one would for a physical flux) and add it to the denominator in the equation above.
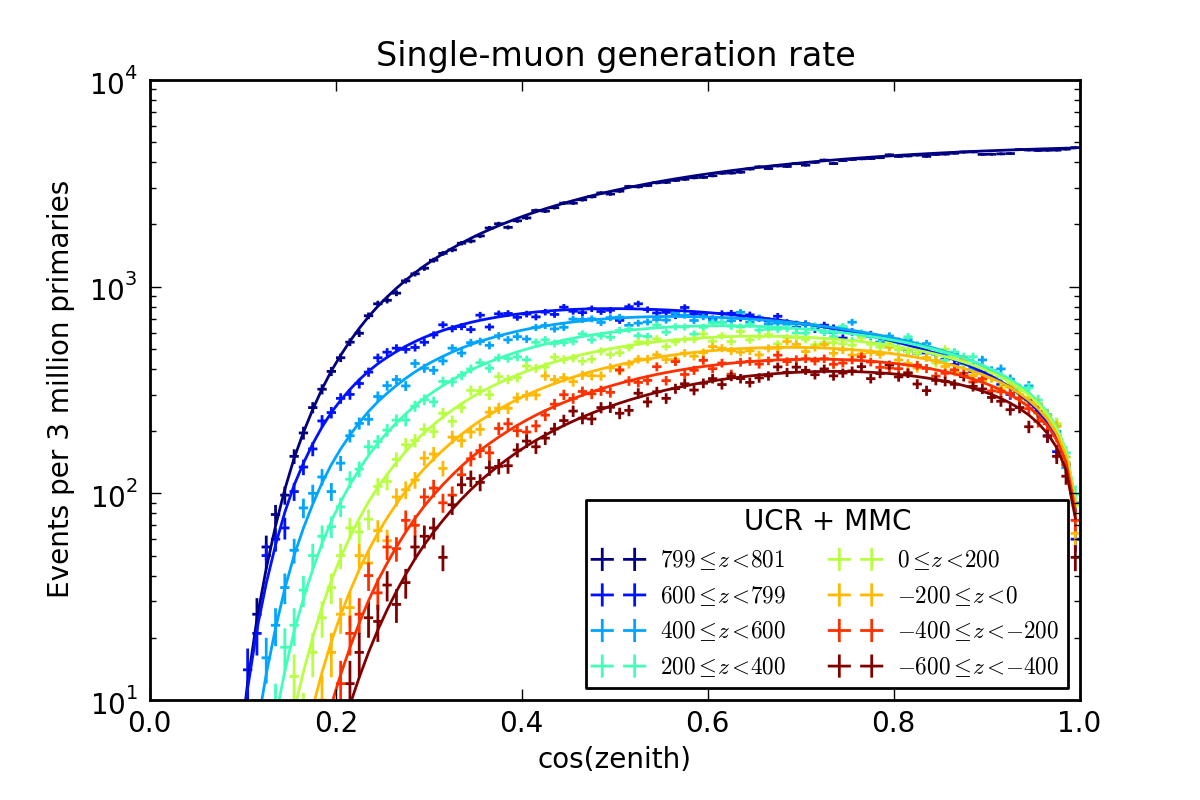
The plot above shows the rates of single muons on the sampling surface produced by 5-component dCORSIKA with “cascade-optimized” settings (30 TeV/nucleon - 100 PeV, \(E^{-2.6}\), 3:2:1:1:1 primary ratio). The solid lines show a parametrization that can be used to calculate a weight for combining this direct simulation with others in terms of a muon flux.
The pair of plots below demonstrate how dCORSIKA samples can be combined with the parameterized simulation. dCORSIKA was run for 3 million primaries with the “cascade-optimized” settings, and single muons were generated from 1 TeV to 1 PeV as \(\frac{dP}{dE} \propto (E+ 800\,{\rm GeV})^{-2}\). The weighted distribution connects the two generation regions smoothly, with greatly reduced statistical errors above 1 TeV.
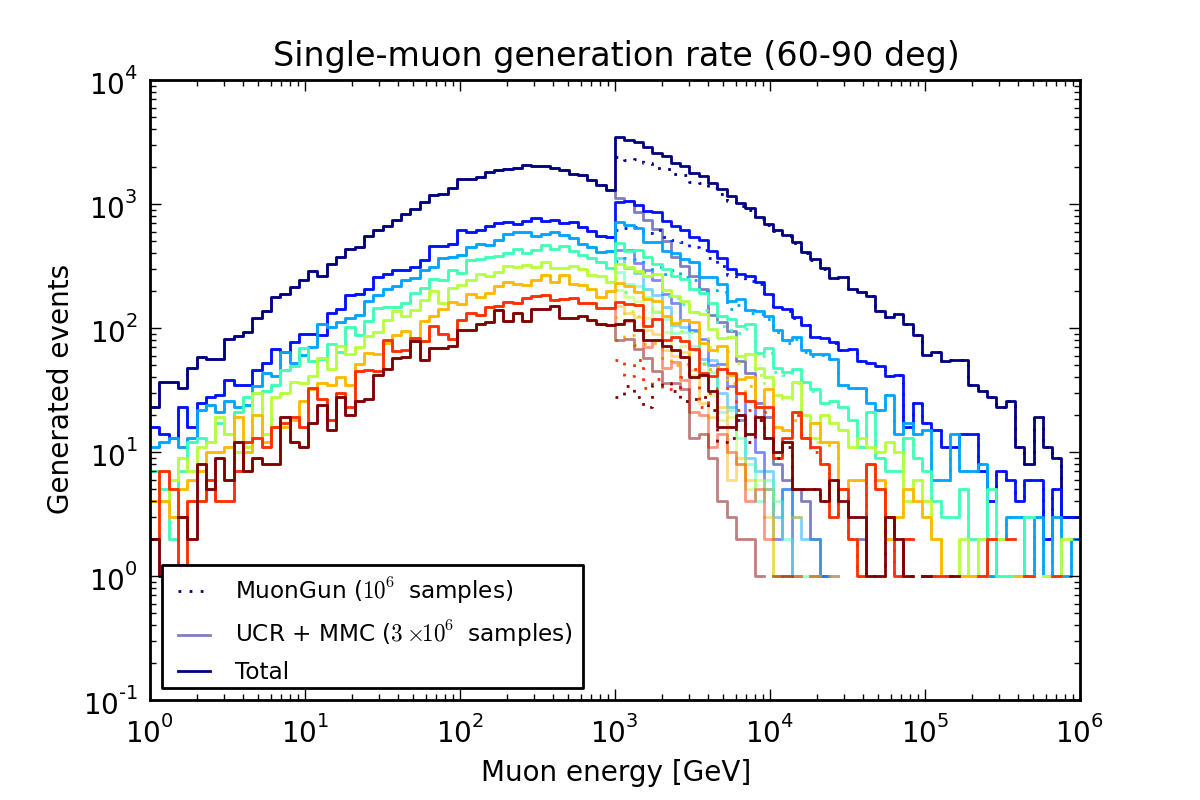
Distribution of generated energies.
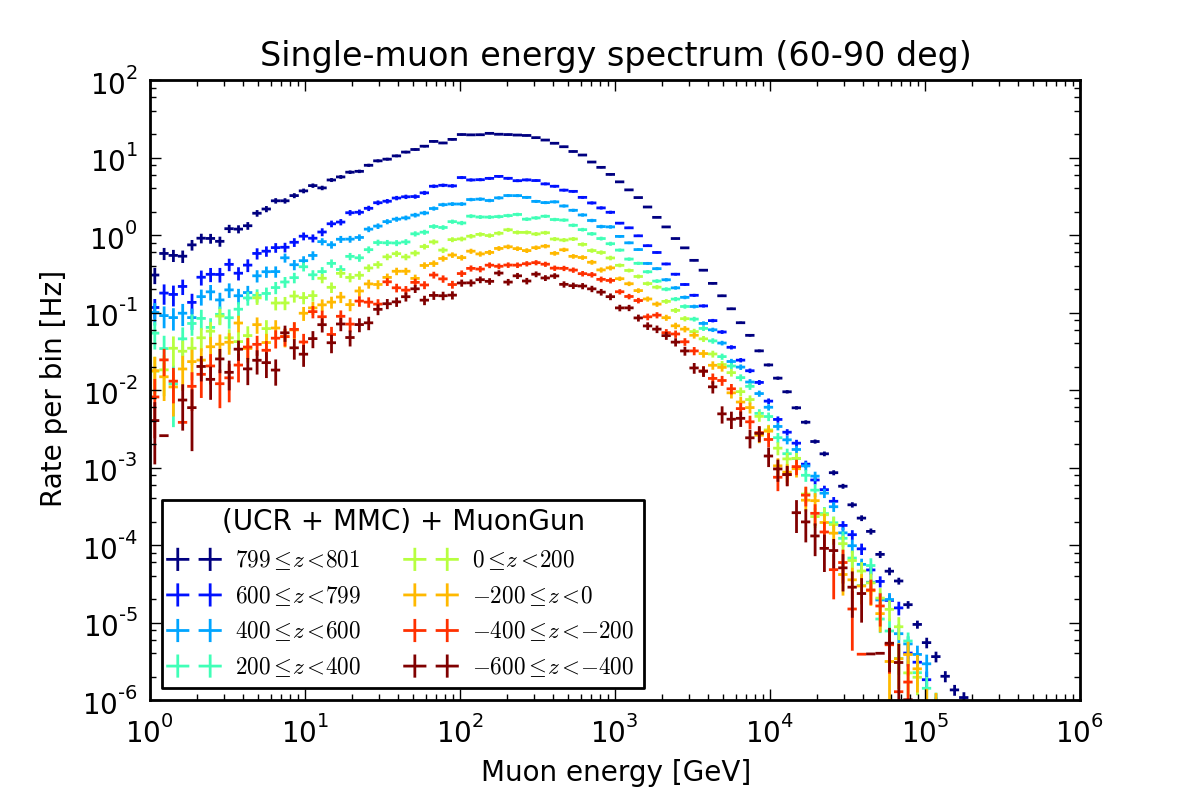
Weighted combined spectrum.
Comparison to conventional simulation
Distributions
Sampling from the parametrization reproduces the muon distribution of the conventional direct simulation it was fit to.
The plots below show a comparison of the single-muon energy spectrum observed on a 800x1600 m cylindrical sampling surface centered on the origin of the IceCube coordinate system. The colored lines show the energies of muons that cross the surface at various ranges of z coordinate, obtained by sampling from the parametrization. The black crosses show the same, but were made by reading dCORSIKA files with UCR and propagating to depth with MMC.
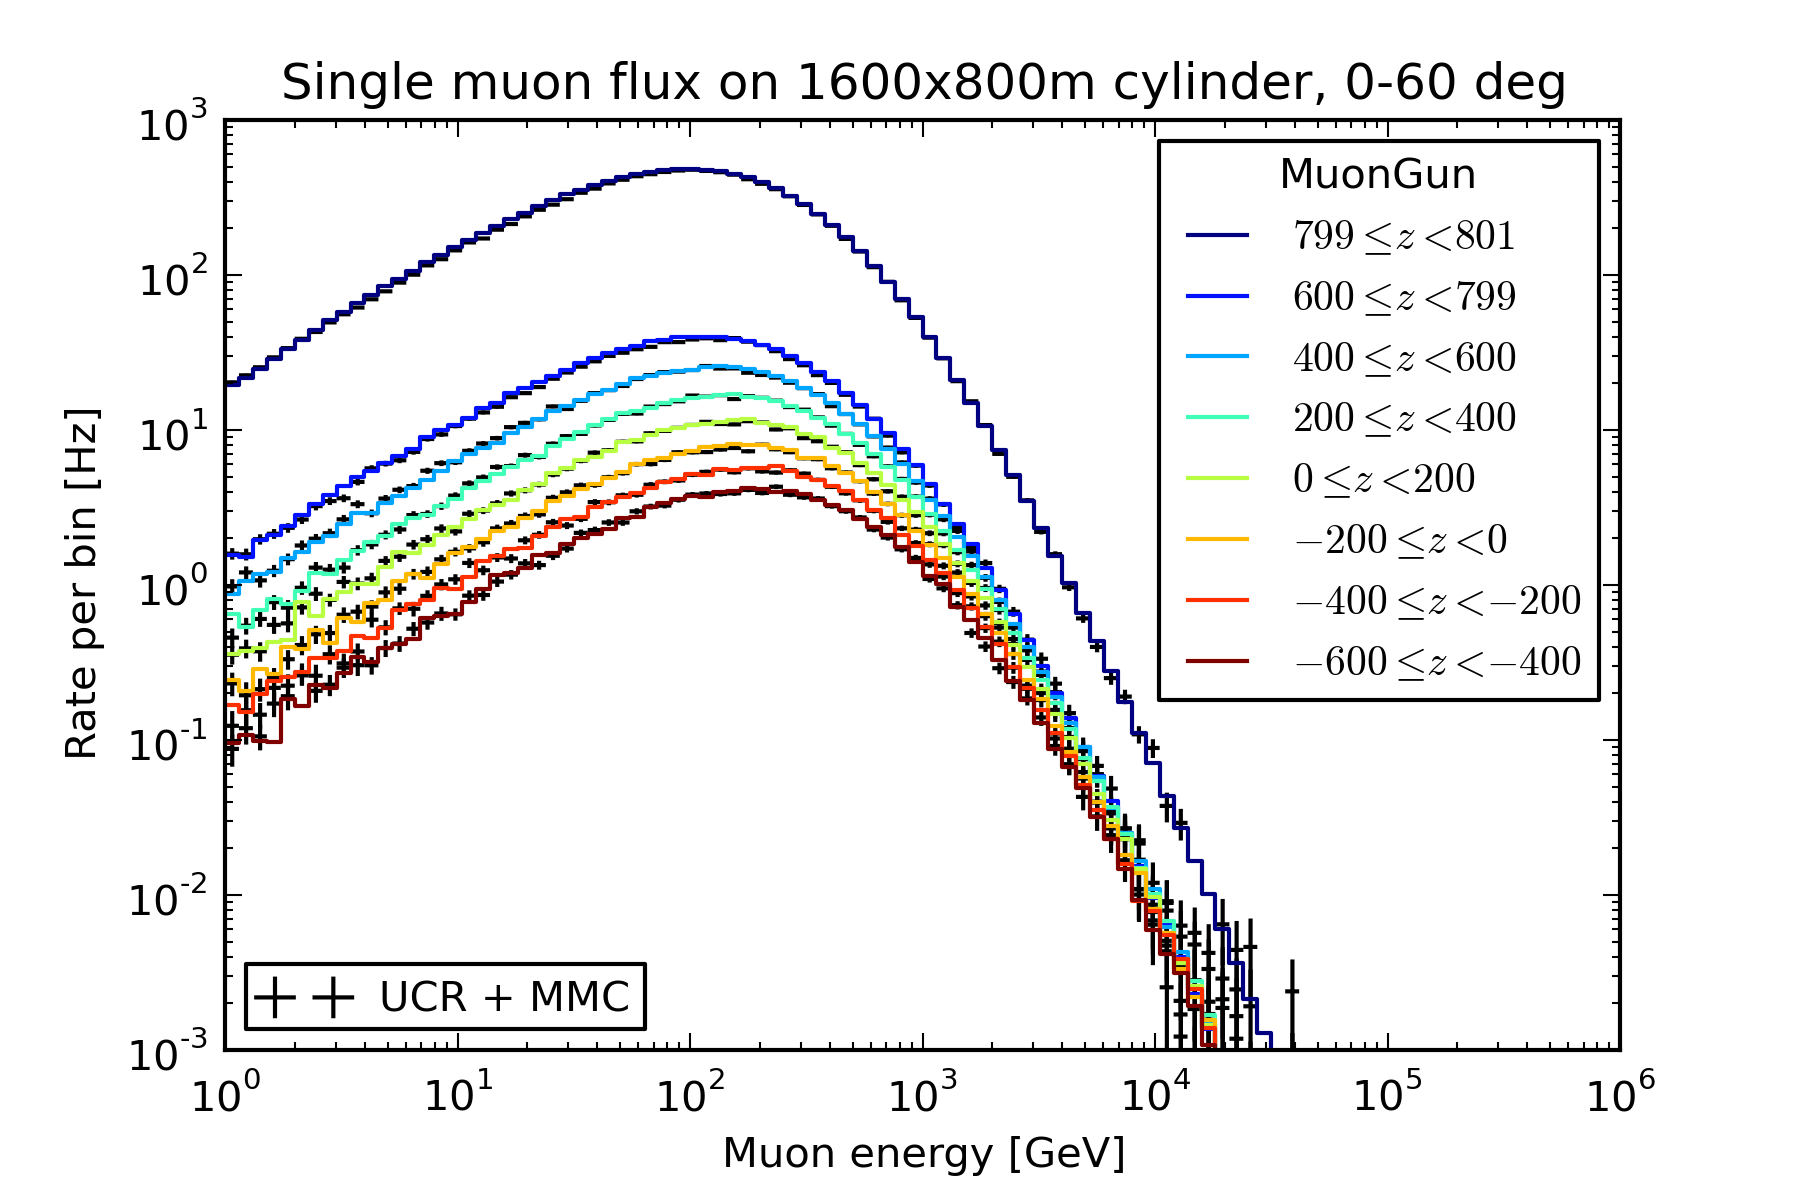
0-60 degrees
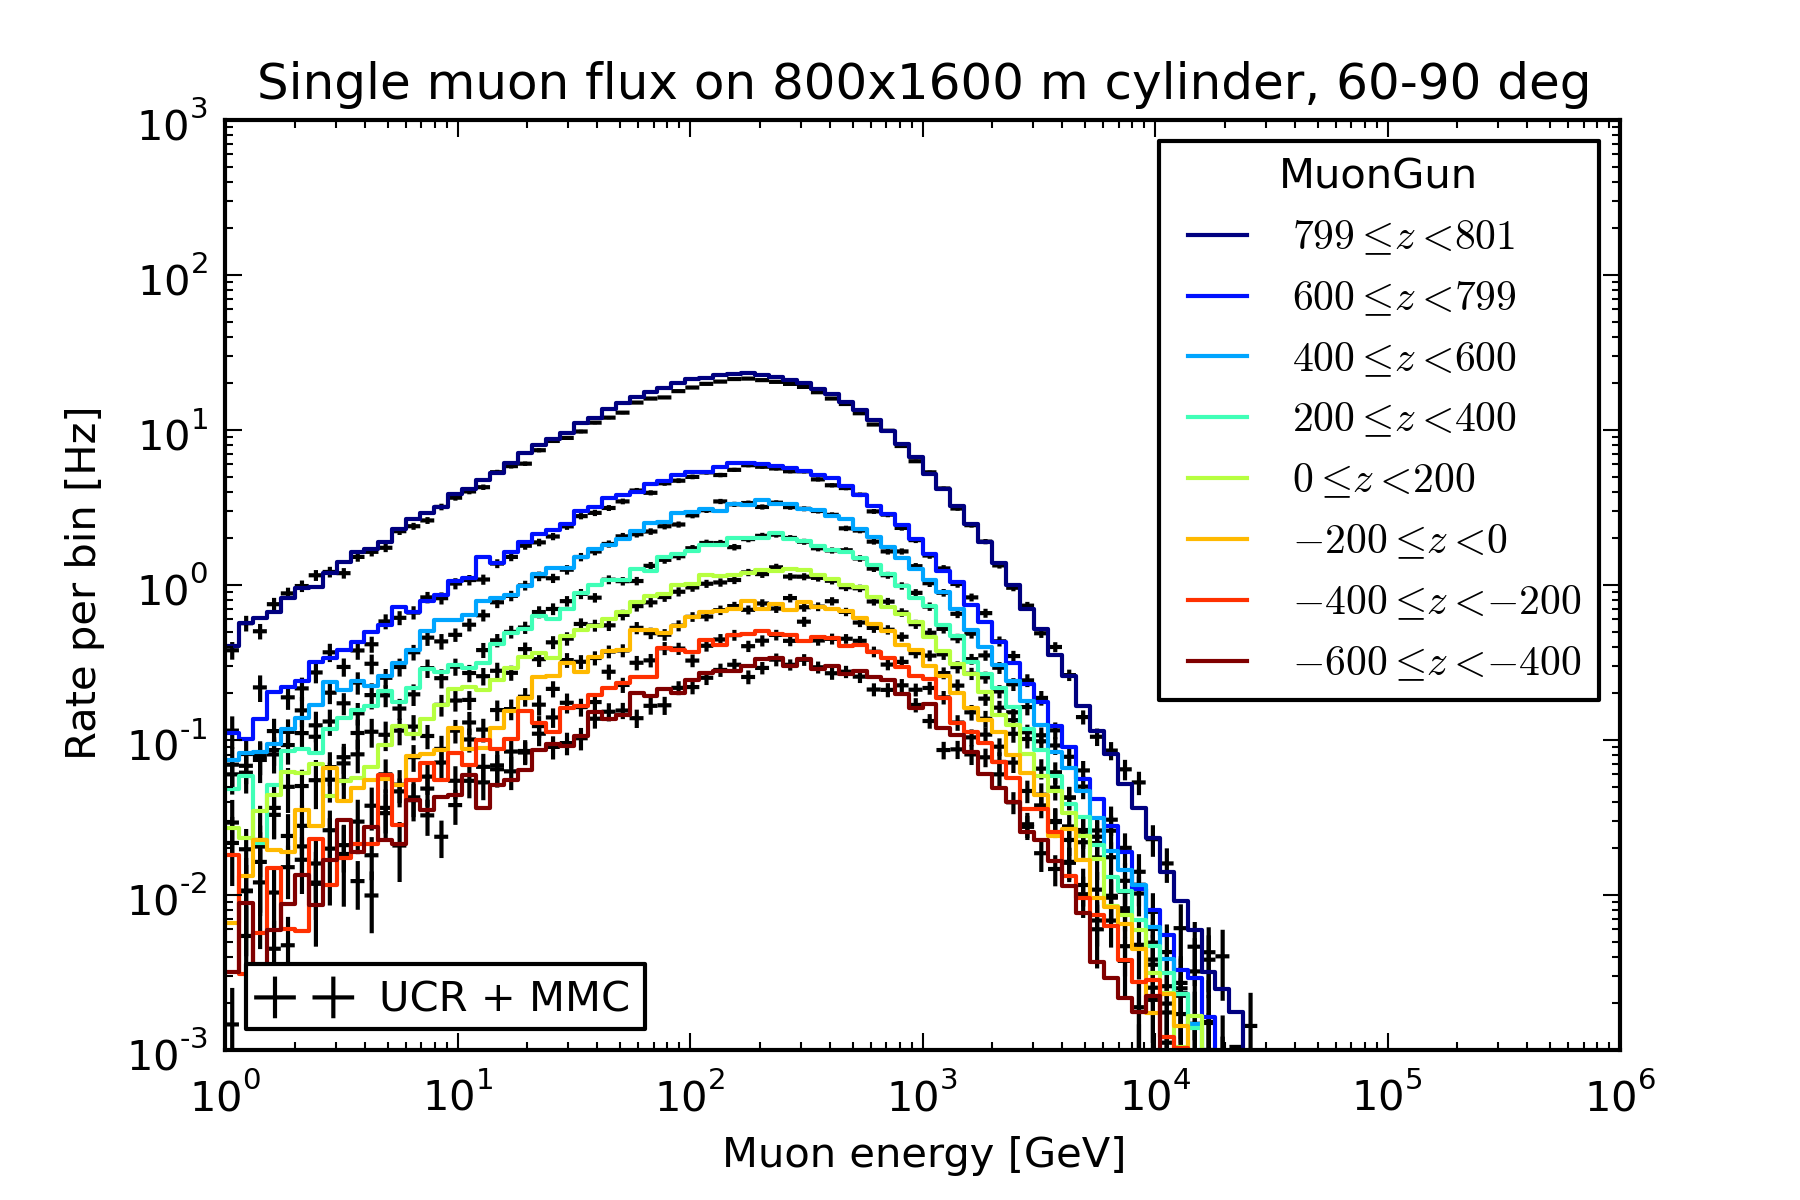
60-90 degrees
Performance
The table below shows a comparison of the time budget for generating 1 million events where at least one muon reaches the 800x1600 m cylindrical sampling surface. dCORSIKA was run for 1 million primaries on an \(E^{-2}\) spectrum from 600 GeV to 100 EeV with a 10:5:3:2:1 primary ratio. Of these showers, only 29018 had at least one muon reach the sampling surface, so the run times for the various components were multiplied by 35. The aforementioned comparsion shows CORSIKA in the worst possible light; with an energy threshold low enough to avoid distortions in the in-ice muon spectrum, much of the time is spent simulating showers where no muons make it to ground level, let alone to a kilometer below the surface. A more favorable comparison would be against the optimized settings used for the mass production of background simulation for IC40 and IC59 cascade analyses. With an energy threshold of 30 TeV/nucleon and an \(E^{-2.6}\) spectrum, 344450 out of 1 million showers reach the detector.
| Step | 5-component dCORSIKA | Cascade-optimized | MuonGun |
|---|---|---|---|
| Generate input muons | 16610 s | 11116 s | 21 s |
| Read air shower file | 861 s | 203 s | N/A |
| Propagate muons | 3101 s | 1335 s | 260 s |
| Total | 5.7 hours | 3.5 hours | 5 minutes |
| MuonGun speed-up | 73 | 45 | 1 |