Standard candle studies
Introduction
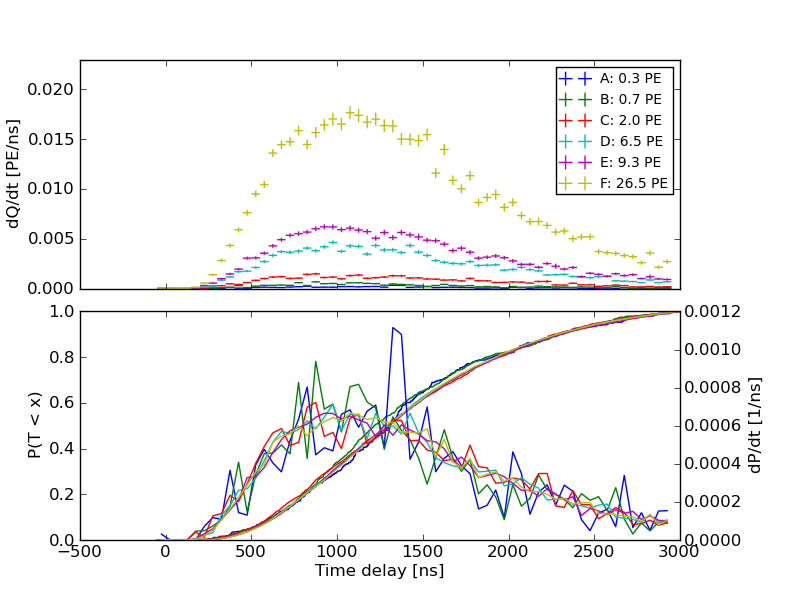
The Standard Candles were intended to provide an absolute energy scale calibration, but the response of the DOMs to SC flashes is still poorly understood. This is an attempt to resolve some of the simpler questions, using data from the Standard Candle 2 run taken on January 13 2011.
Linearity
The brightness of light pulse produced by the SC is regulated by a set of filters that can be configured to transmit 0.5% to 100% (nominal) in steps of 0.5%. The Jan. 2001 SC2 run was purportedly taken with nominal brightness settings of 1, 3, 10, 30.5, 51, and 100%. The total charge collected for each of these nominal brightness settings disagrees significantly with the simulation prediction for all current ice models for unknown reasons. One thing that can be checked without recourse to simulation, however, is the relative brightness of the pulses in each attenuation setting.
Method
If the DOMs were perfectly calibrated and responded to laser pulses in a perfectly linear fashion, pulsing the laser at 100% brightness would yield a total charge in DOM \(j\) of \(q_j\), and pulsing it with attenuation \(x_i\) would yield a total charge of \(Q_{ij} = x_i q_j\). In matrix notation:
Given \(Q\) one can fit for the entries of \(\vec{x}\) and \(\vec{q}\).
Since this approach assumes that the charge response of the DOM is linear, I had to be careful to select only average waveforms without nonlinear behavior. In the most basic sense, this means that the average waveforms in a given DOM for different brightness settings all have the same shape. Any amplitude-dependent nonlinearity must change the shape of the waveform, because the response of the PMT and DOM electronics can only depend on their current and past state, but not on future state. In particular, differing calibrations of the ATWD channels can’t sneak through [1], as such an offset would change the shape of the waveform in the parts where only one channel participates in Wavedeform’s joint unfolding.
| [1] | The charge spectrum of single-PE pulses unfolded separately in ATWD channels 0 and 1 shows that the channels are properly cross-calibrated. |
Data selection
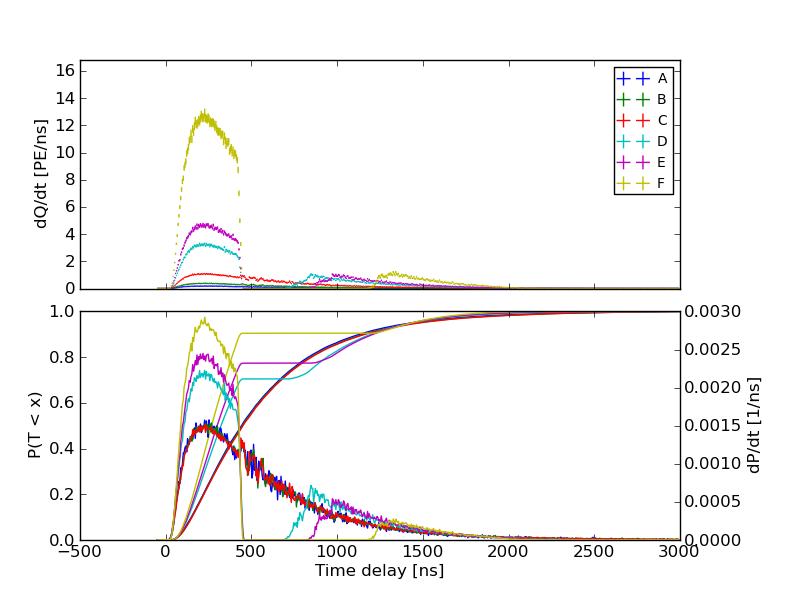
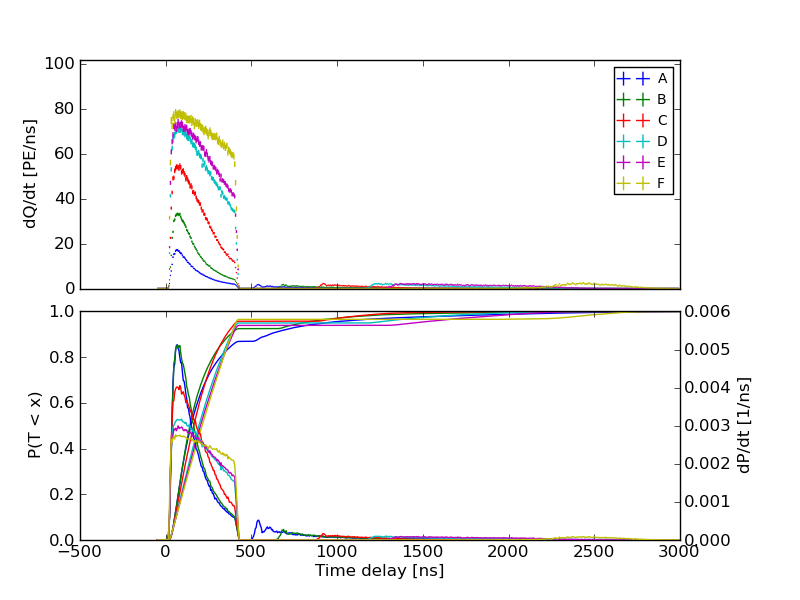
First, I re-processed the filtered SC2 data provided by Aya, calibrating the raw waveforms with WaveCalibrator and unfolding pulses with WaveDeform. I then made histograms of the charge-weighted pulse time distribution (average waveform) for each DOM at each brightness setting, using the laser pulse arrival time as a time reference [2]. For each DOM I used a 2-sample Kolmogorov-Smirnov test to detect shape changes between average waveforms captured at each brightness setting. If the test failed, I repeated the test using only the distribution up to 400 ns delay time. If the test failed again, I discarded the largest brightness settings until the shapes of all remaining histograms matched. If only a single brightness setting remained, I discarded the DOM entirely.
For DOMs a reasonable distance from the SC the response is linear across the whole capture window, and it is resonable to compare the total charges at each brightness:
For DOMs somewhat closer to the SC, however, the average waveform is out of the range of the FADC, but the response remains linear within the ATWD window:
In the DOMs closest to the SC on string 55 the PMT response becomes highly nonlinear, and all the waveforms must be discarded:
The entries in the matrix \(Q\) were the average charge collected during the linear portion of the readout. Completely nonlinear waveforms and those with less than 0.1 PE on average were discarded entirely.
| [2] | Since the SC is completely independent of the IceCube DAQ, the time at which the laser fired had to be estimated from the leading edge of the PMT pulse in DOM (55,42), the DOM directly below the SC. |
Fit
After constructing \(Q\), I first minimized the squared difference between \(Q\) and \(\vec{x} \otimes \vec{q}\), keeping the entries of \(\vec{q}\) constrained to interval (0, max(Q)) and the entries of \(\vec{x}\) to (0,1). Then, I fixed \(\vec{q}\) and re-minimized for \(\vec{x}\) without constraint.
Results
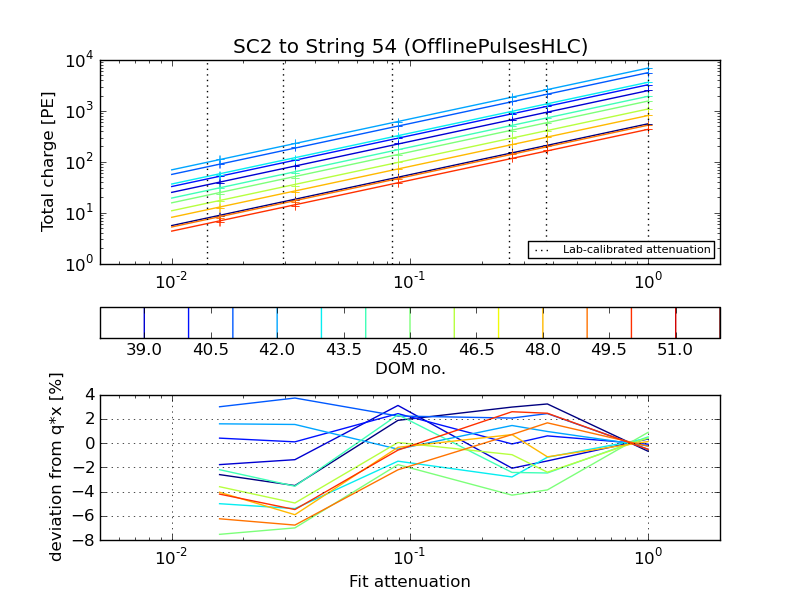
The coefficients obtained from the fit are consistent with the lab-calibrated values at high transmittance, but deviate from the lab-calibrated values at low transmittance.
| Nominal | 1 | 3 | 10 | 30.5 | 51 | 100 |
| Lab (SC1) [3] | 1.39 | 3.5 | 10.9 | 32.2 | 53.9 | 100 |
| Lab (SC2) [4] | 1.4 | 2.92 | 8.4 | 26.0 | 37.2 | 100 |
| Fit (SC2) | 1.58 | 3.28 | 8.90 | 26.8 | 37.7 | 100 |
| [3] | Internal Calibration of IceCube Standard Candle I |
| [4] | Attenuations for Standard Candle 2 |
The plot below shows the fit results along with data from string 54, which is fairly typical. The lab transmittances corresponding to each setting are shown as dotted vertical lines, while the data points are aligned at the fit values.
One can also fix the attenuations and only fit for the overall normalization. The resulting residual plot is consistent with the full fit; the observed charges deviate from the from the linear assumption at low transmittance:
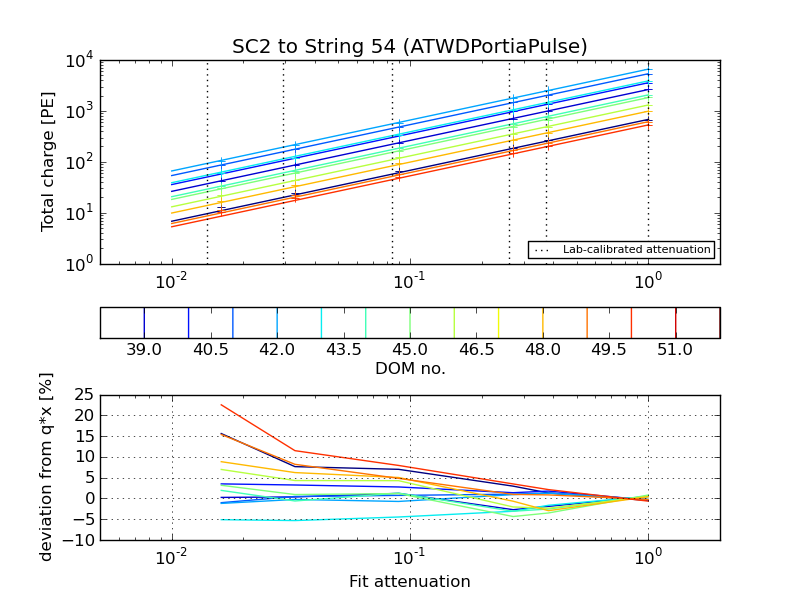
The observed discrepancies are unlikely to be an artifact of droop correction or pulse extraction; this can be checked by repeating the analysis using I3Portia’s pseudo-integral charge without droop correction. The fit result is the same, though I3Portia seems to overestimate the charge in the sub-50 PE range:
Aside: the DOM response is linear in the sub-PE region, too
Gotchas and extras
- The SC2 filter wheel is a custom job, and the nominal numbers are a complete lie: http://lists.icecube.wisc.edu/pipermail/icecal/2008-August/000080.html
- Mina Inhaba’s super-internal report: http://anacreon.physics.wisc.edu/~nwhitehorn/EnergyCalibReport.pdf
Linearity, deeper: fluctuations
(Nathan Whitehorn)
Another measure of linearity is whether the total charge in the DOMs has the correct statistical behavior, in particular whether it is a Poisson distribution of photons folded with the SPE distribution. This question is important because it is related to the likelihood functions used in reconstructions and to the total energy scale: to how many photons does a charge of N photoelectrons correspond? The standard candle provides an abundant source of photons of constant, if not known, luminosity in each optical module. At a given standard candle density, the number of photons in each DOM for every flash should sampled from a Poisson distribution with a constant (if unknown) mean.
For a pure Poisson process, the variance is proportional to the mean of the distribution. This means that a Poisson distribution with unknown scale can be analyzed statistically to determine the shot noise contribution of each component. The situation for a compound Poisson distribution is slightly more complicated, since a widening could be due either to having more photons or to the intrinsic width of the SPE charge distribution. For a compound Poisson distribution, the variance, while not equal to the mean, remains proportional to it:
For standard candle data, this linear relationship can be observed over 4 orders of magnitude in \(\mu\) over many DOMs (Mean vs variance) with an upturn in the variance at high charges. This directly implies that, in the linear region, the observed charge in the OMs is (a) a linear function of the number of photons and (b) Poisson distributed as assumed in our likelihood reconstructions. By looking at the distribution of \(\langle Q_{SPE}^2 \rangle = \sigma_{MPE}^2 / \mu\) in many DOMs for many flashes (FIGURE: sc-meanovervariance.png) we can reconstruct the allowed value of the SPE charge as a function of the width of the SPE response:
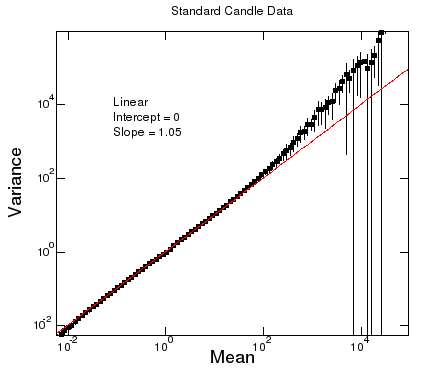
Mean vs variance
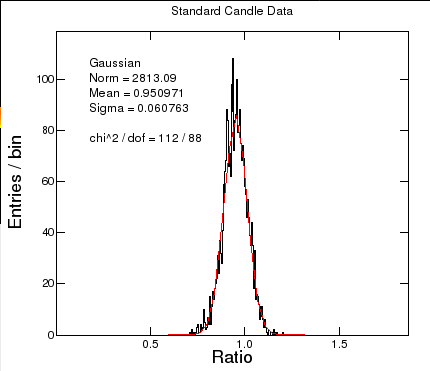
Mean over variance
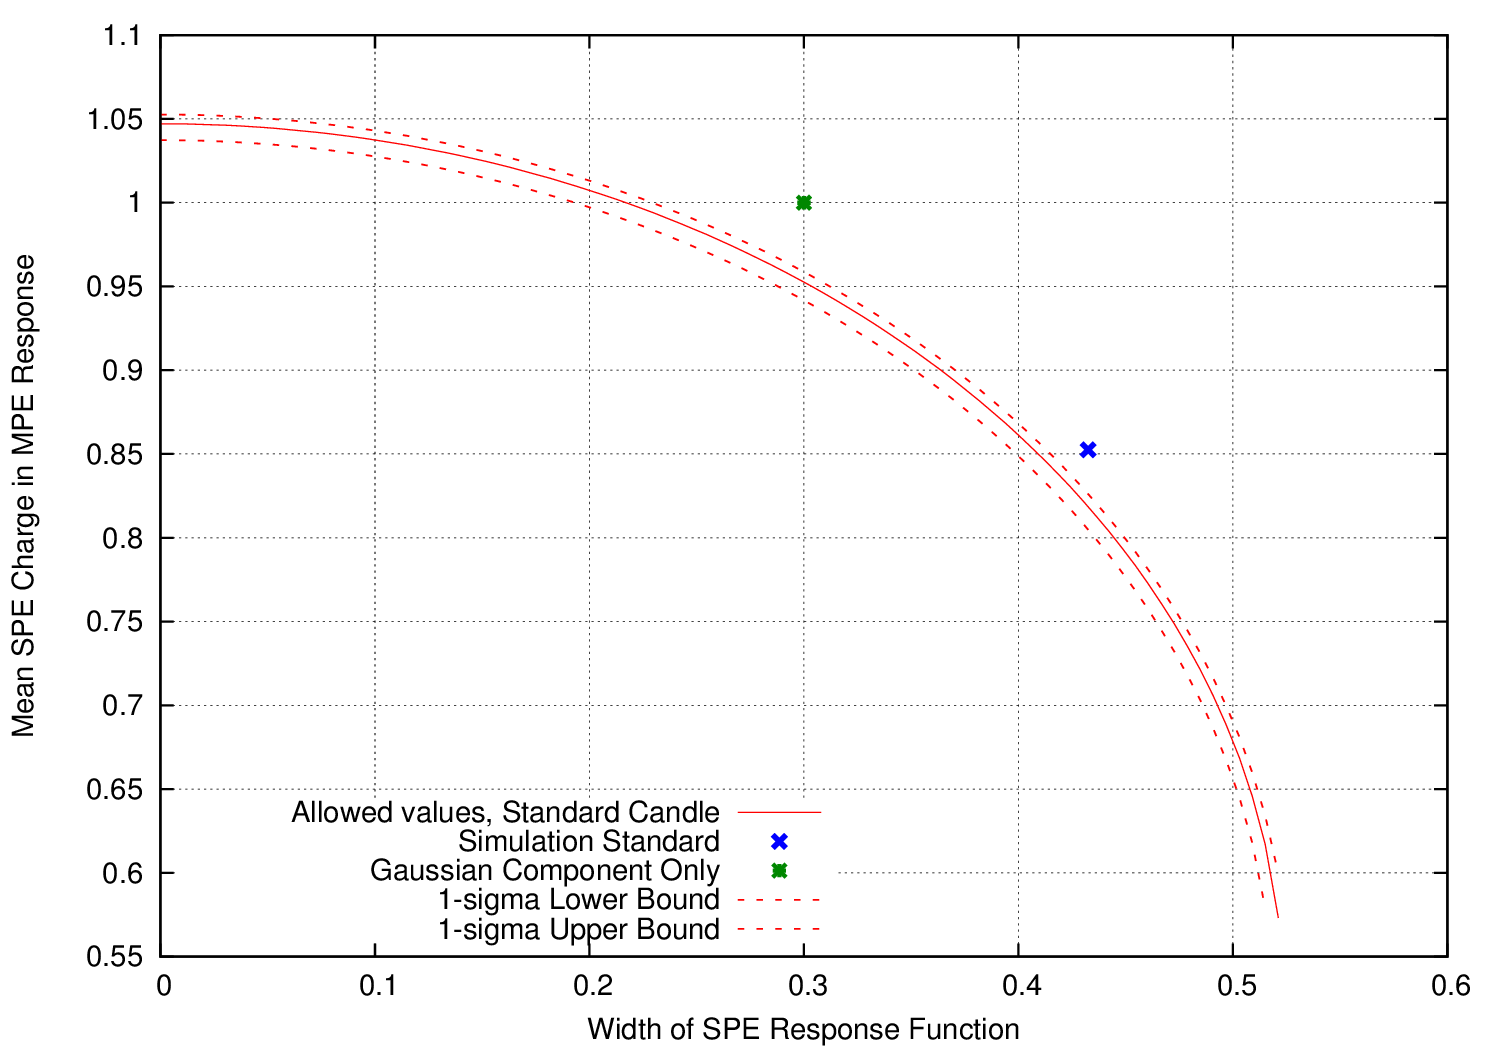
Charge collection as a compound Poisson process
The blue cross here represents the values currently used in simulation and believed to be correct. These are not quite consistent with the standard candle data but neither are they enormously far away. The green cross represents an alternative hypothesis – one not borne out by lab measurements – in which only the Gaussian portion of the SPE response represents the charge distribution from single photons. This is not excluded either but is noticeably more in tension with the data.
At high values of mean charge, the variance is larger than expected (Mean vs variance). This is due in large part to a bug in mainboard firmware 442 which introduced 30 microseconds of deadtime following every launch – including SLC noise hits. Below shows one standard candle flash in this dataset showing (on the left) all hits and (on the right) only HLC hits. The orange OM in the center on the left image had an SLC hit 7 microseconds before the standard candle flash. As seen on the right, the deadtime resulting from the noise hit prevents the OM from triggering at all as part of the standard candle readout. As a result, this OM ends up with a charge of only 1 PE, vastly enlarging the variance of the measurement.
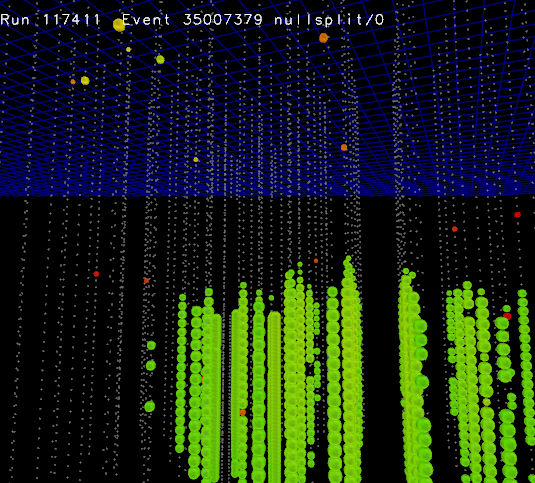
Early hit
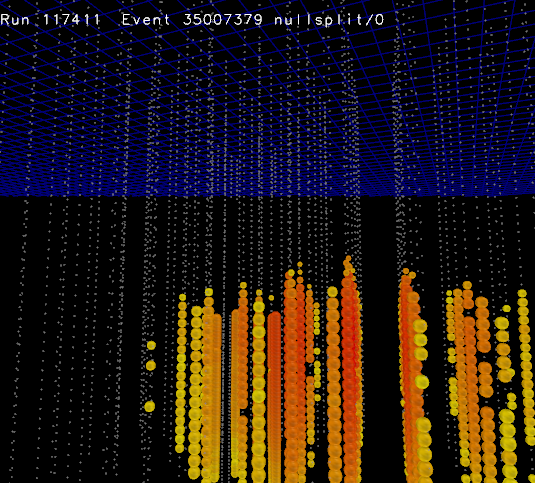
Still dead!
This can be worked around somewhat by removing the lowest 10% of charges from the distributions (red line below). At low amplitudes where 0 is a possible value, below a few PE, this severely skews the variance distribution but it returns the red line to a linear relationship for another order of magnitude in total charge. Above 600 PE, some presently unknown additional effect begins pulling it off again. Properly disentangling the effect of this mainboard firmware bug will require a new standard candle run with firmware 443 or newer.
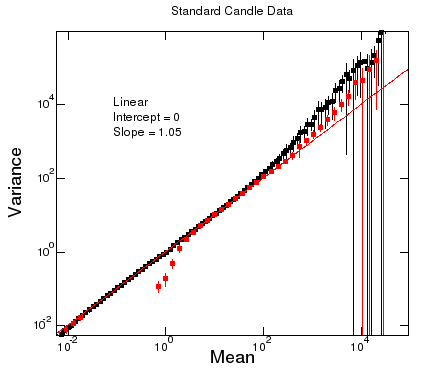
Mean vs. variance (lowest 10% charge removed)
The S-word
Some simulation comparisons of the lowest brightness setting may be illustrative. Dima produced 100 flashes of \(0.0158 \times 2.5 \times 10^{13}\) photons each using ppc and Spice-Lea. Aside from the overall normalization offset, the shapes of the charge distributions along the strings do not match; the DOMs below the Standard Candle see significantly more light than they should. However, Strings 63 and 46 do, however, see more light than the other 4 strings, which may be consistent with the anisotropy observed in both flasher and muon data.
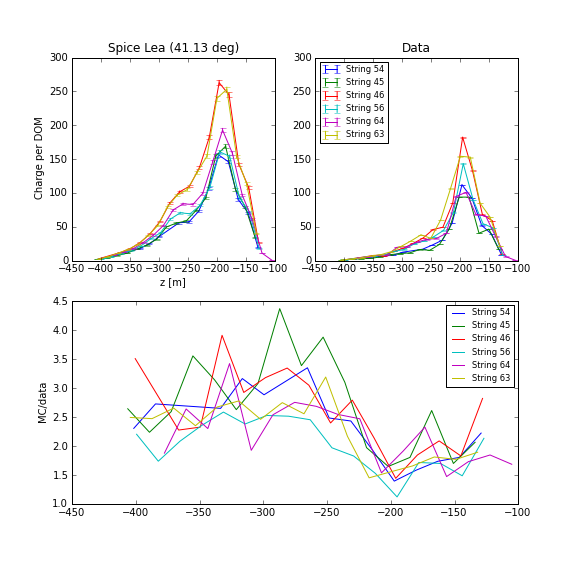
Mean charge on the 6 strings surrounding SC2.
The shapes of the normalized average waveforms, on the other hand, agree much better.

Mean (normalized) waveforms on the 6 strings surrounding SC2.

