Overview
2nd data cleaning is designed to ‘filter’ or ‘remove’ the non-Neutrino signature from WF.
Digitizer fluctuation: Band-pass filter
Dead bit / duplication: Remove certain channels
External source (ex) weather balloon): CW filter
All the filters / cuts are independant.
In-situ noise / gain model for simulation is produced after applying the filters in the 2nd data cleaning
2nd data cleaning is done by below command:
source ../setup.sh
python3 script_executor.py -k baseline -s <station ID> -r <run number> -b 1          # produces average frequency sepctrum for testbed method
python3 script_executor.py -k cw_flag -s <station ID> -r <run number> -b 1           # identify freqiencies that contaminated by CW
python3 script_executor.py -k cw_band -s <station ID> -r <run number>                # grouping bad frequencies for geometric filter
python3 script_executor.py -k cw_ratio -s <station ID> -r <run number> -b 1          # calculates power reduction ratio by geometric filter
python3 script_executor.py -k qual_cut_2nd -s <station ID> -r <run number> -b 1 -q 2 # performs 2nd data cleaning
python3 script_executor.py -k ped -s <station ID> -r <run number> -b 1               # produces pedestal based on 2nd data cleaning
python3 script_executor.py -k snr -s <station ID> -r <run number>                    # calculates SNR
python3 script_executor.py -k qual_cut_3rd -s <station ID> -r <run number> -b 1 -q 3 # performs 3rd data cleaning
For sim:
source ../setup.sh
python3 sim_script_executor.py -k sub_info -s <station ID> -d <sim output path>       # both signal and noise
python3 sim_script_executor.py -k baseline -s <station ID> -d <sim output path>       # noise only
python3 baseline_merge.py <station ID>                                                # noise only
python3 sim_script_executor.py -k phase -s <station ID> -d <sim output path>          # noise only. collect the phase of noise only event that will be used for phase variance method
python3 sim_script_executor.py -k cw_flag -s <station ID> -d <sim output path>        # nosie only
python3 sim_script_executor.py -k cw_flag_signal -s <station ID> -d <sim output path> # signal only. perform testbed and phase variance by using the phase from noise event
python3 sim_script_executor.py -k cw_ratio -s <station ID> -d <sim output path>       # both signal and noise
python3 sim_script_executor.py -k rms -s <station ID> -d <sim output path>            # both signal and noise. calculates rms
python3 rms_merge.py <station ID>                                                     # nosie only
python3 snr_maker.py <station ID> <rms results path>                                  # both signal and noise. calculates SNR by rms from noise event
It will use post_qual_cut_loader and filt_qual_cut_loader class
Implement of voltage calibration
Related doc. DB2449, DB2455, DB2464, DB2473, DB2481,
In this unblinding request, data will be analyzed with voltage calibration
AraRoot is clean up for properly link coefficient in conversion table with ADC counts
All the calibration condition, such as trimming first block and mean zero correction are optimized/verified
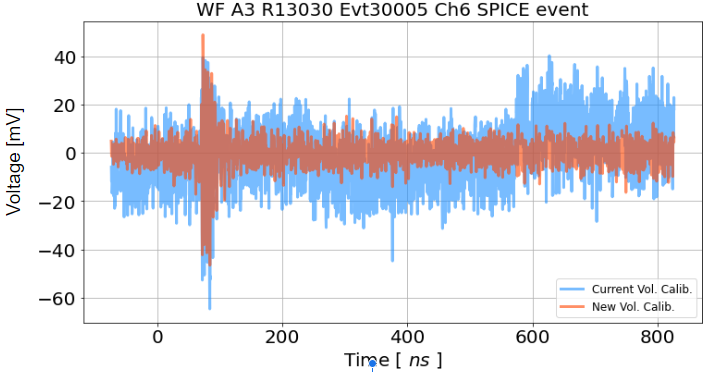
Fig. 50 comparison between before and after voltage calibration
Dead bit issue
Related doc. DB2530
A3 string 1 (RF ch.0,4,8, and 12) had a dead bit issue at 2019 (config 7 and 8)
8th bit (total 12-bit range) on the IRS2 chip is not responsive (always zero).
Decided to exclude A3 string 1 (2019 data set) from analysis
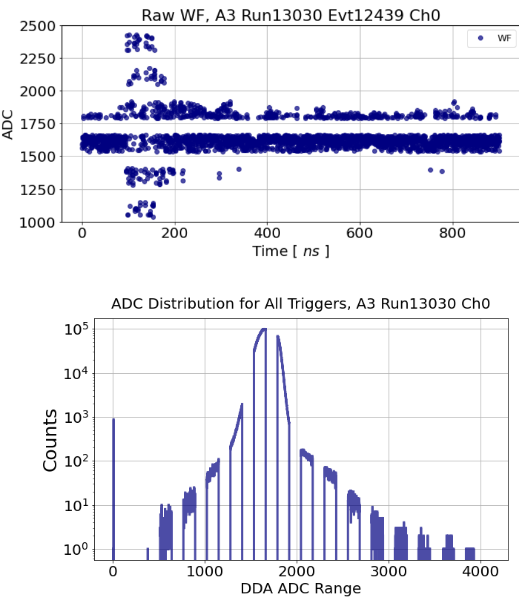
Fig. 51 example of dead bit of 1 wf
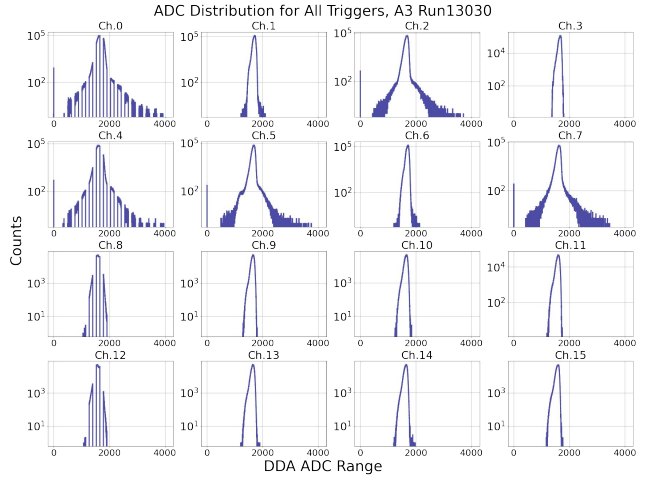
Fig. 52 example of dead bit of 16 wf
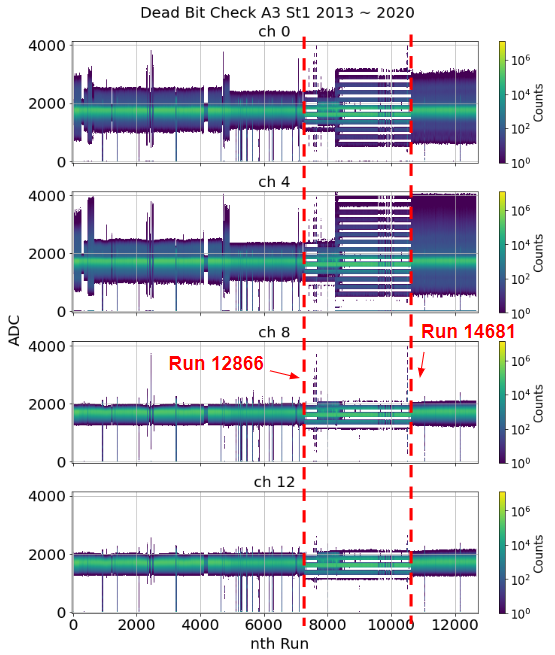
Fig. 53 example of dead bit on string 1 in 2013 to 2020
Duplicated ADC issue
Related doc. DB2535
Every ADC counts in first half of block (10ns) are duplicated to next half of block
A2 : string 1. on config 7, A3 : string 4. same period with dead bit issue.
Decided to exclude A3 string 4 (2019) and A2 string 1 (2020) from analysis
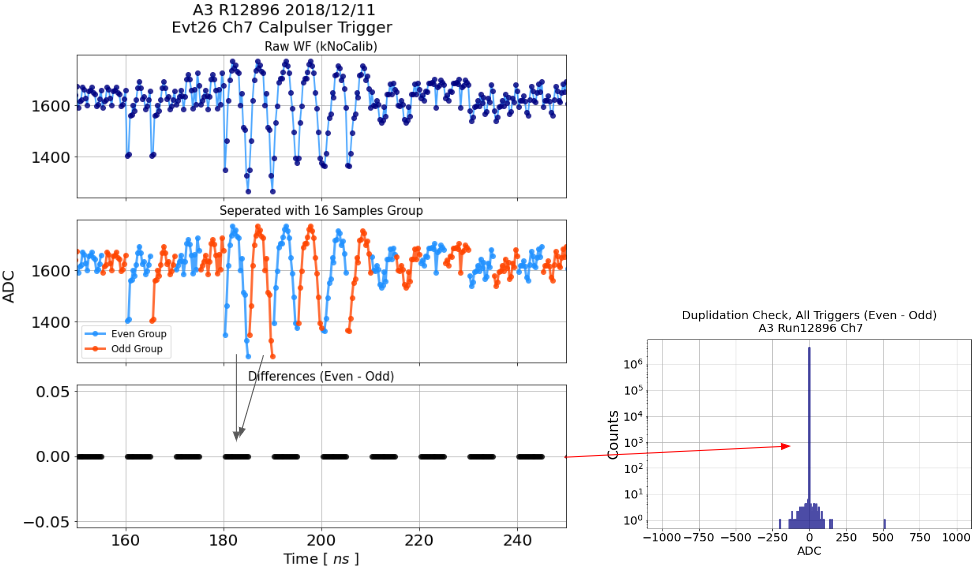
Fig. 54 example of duplication of 1 wf
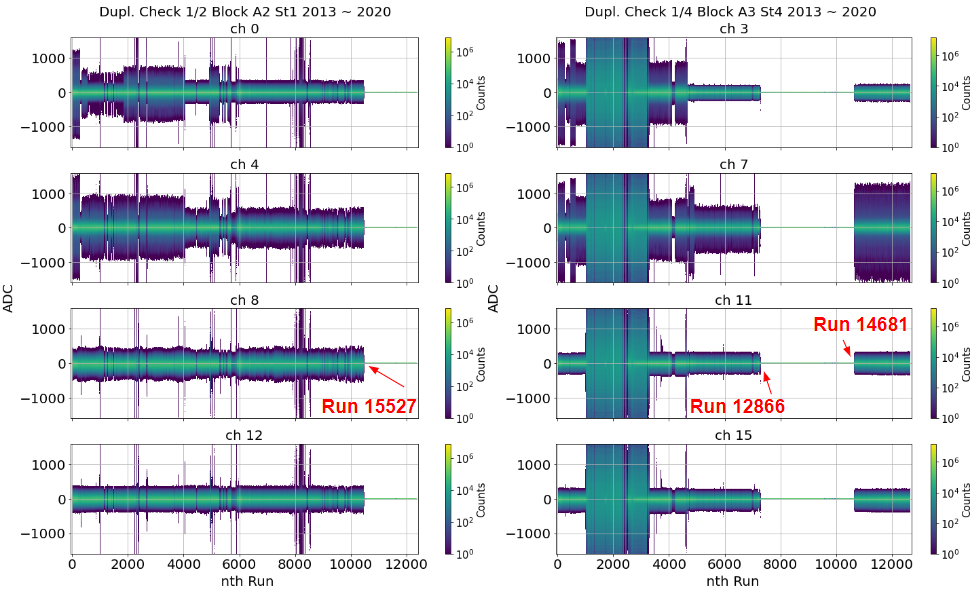
Fig. 55 example of duplication A23 in 2013 to 2020
User can find implementation of dead bit and duplication issue from get_bad_antenna function
CW Filter / ratio cut
Cant just remove all the ‘suspicious’ peaks from the spectrum.
The peaks must have known CW characteristic
It should have a shape (or narrow) frequency peak
It should be appeared in multiple channels and events
Identification
Implemented from previous A2/3 analysis. C++ or Python version
Testbed method: peak over threshold (averaged spectrum)
Phase variance: phases differences between channels and events
Filtration
Implemented Geometric filter from previous A2/3 analysis
Remove real/imag value of CW oriented vector from each data frequencies
Testbed method
This is done by py_testbed class
Bad freqeuncy is identified by differences from averaged spectrum
In order to flag the frequency as a CW,
In individual channels, spectrum near high peak (> 6 dB) must not have another peak. more than 50 % of peaks in 40 MHz window from the peak should smaller than 5.5 dB
In between channels, same flag should be existed in more than 3 channels in 5 MHz range. Considering if CW is external source, multiple channels should see the same signature
Then, we flag the frequency as a filterable material
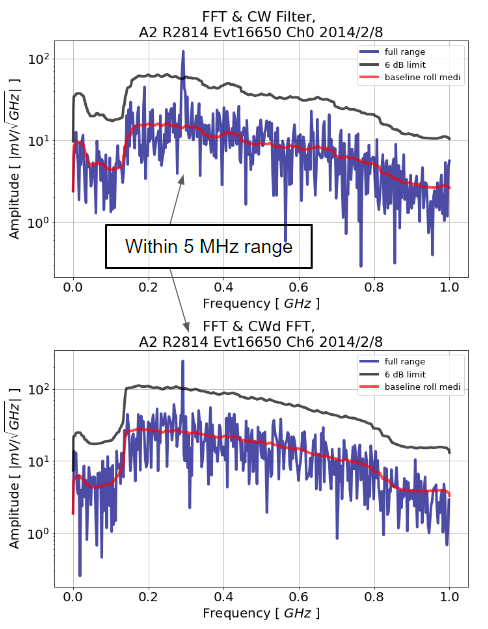
Fig. 56 example of testbed method
Phase variance method
This is done by py_phase_variance class
If we continually observed certain signal from same position, phase differences of two antennas should be continually same
If we add up neighboring event’s phase differences, Phase from cw would be higher than thermal noise
If phase variance is bigger than 1.5 sigma (A2) and 2 sigma (A3), then, we flag the frequency as a filterable material
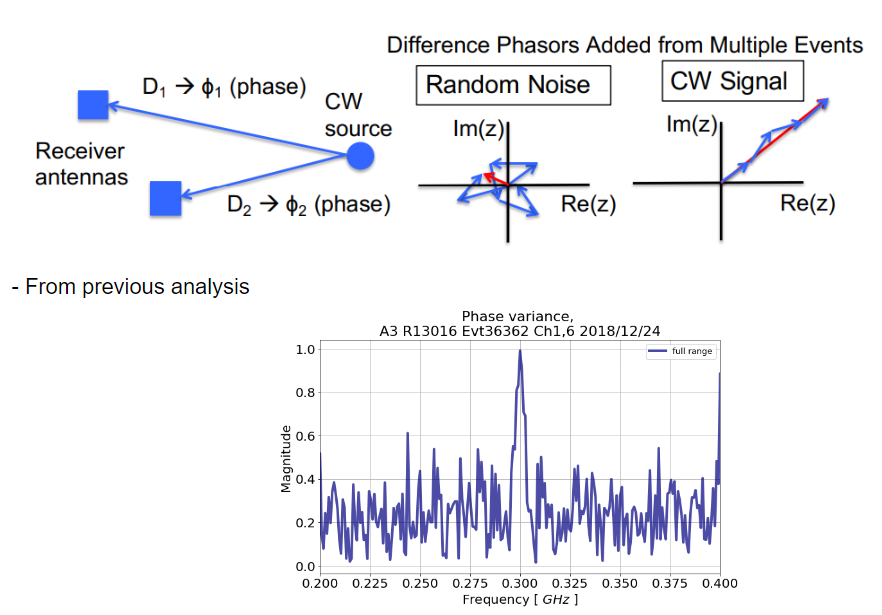
Fig. 57 example of phase variance method
Geometric filter
This is done by group_bad_frequency and py_geometric_filter class
We repair the flagged frequency by subtracting CW phasor from measured phasor. Remaining real/imag vector would be estimated thermal phasor
CW phasor of each frequency is calculated by averaging near by flagged frequencies phase
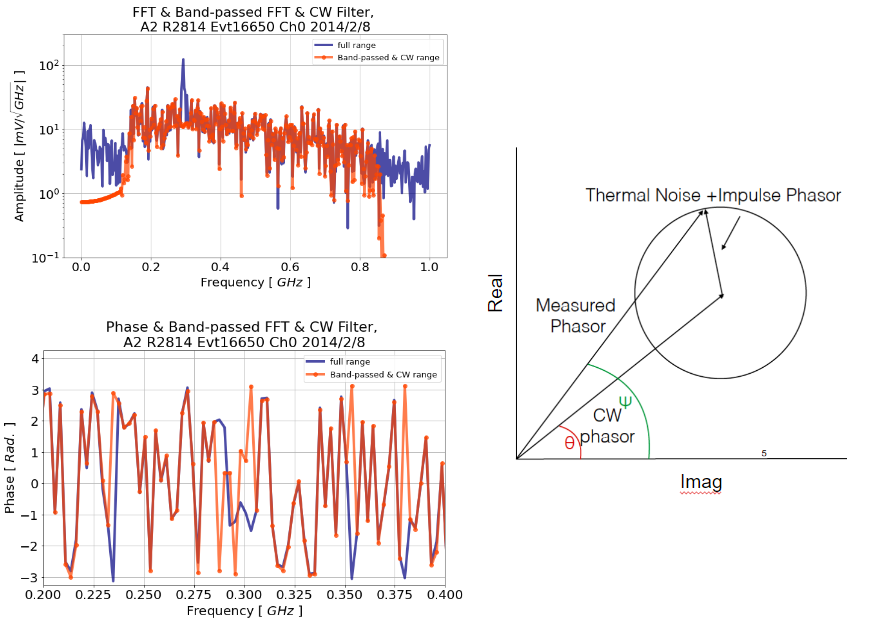
Fig. 58 example of geometric filter
If power reduction ratio by CW filter was bigger than cut parameters more than 3 channel, It is removed from analysis
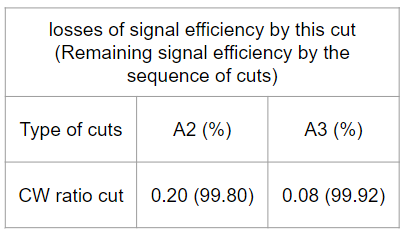
Fig. 59 live time losses by cw ratio cut
Band-pass filter
Related doc. DB2554
This is done by get_band_pass_filter and get_band_passed_wf function
pass region: 130~ 850 MHz
It is for ‘minimizing’ block offset and digitizer fluctuation (20 ns -> 0.05 GHz)
Minimizing both issues are crucial since it is effecting vertex reconstruction
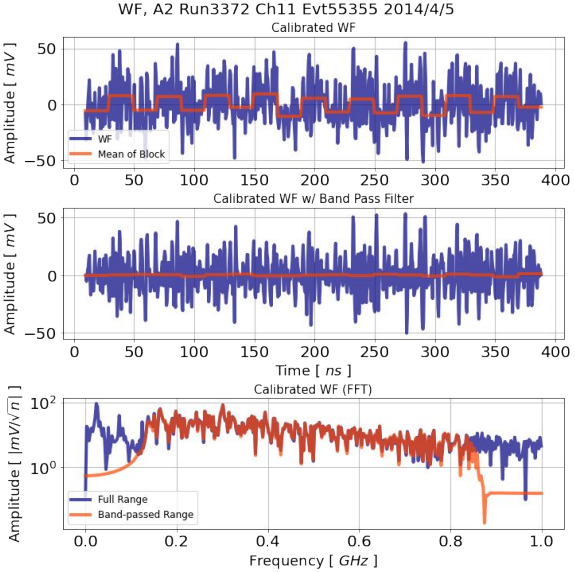
Fig. 60 example of block offset event. anf filteration by band pass filter
Sometimes, one of the blocks is showing ‘not good’ behavior and causes a large offset compared with other blocks. The cause is unknown…
Observing strong low-frequency signal time to time
DAQ fluctuation is creating unrealistic low-frequency signal
This type of event is not significant (not located in the edge) in multi dim. gaussian distribution
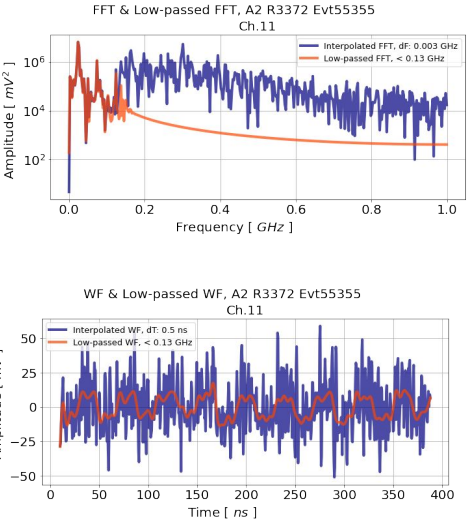
Fig. 61 Based on the frequency separation (and mean of block comparison), offset block issue can be contained by cutting out low frequency region
based on 2d histogram (mean of block vs block index) by all events in this run, block-level of fluctuation is not caused in a certain block
If this is the issue in a certain block region, red point more likely center of the distribution
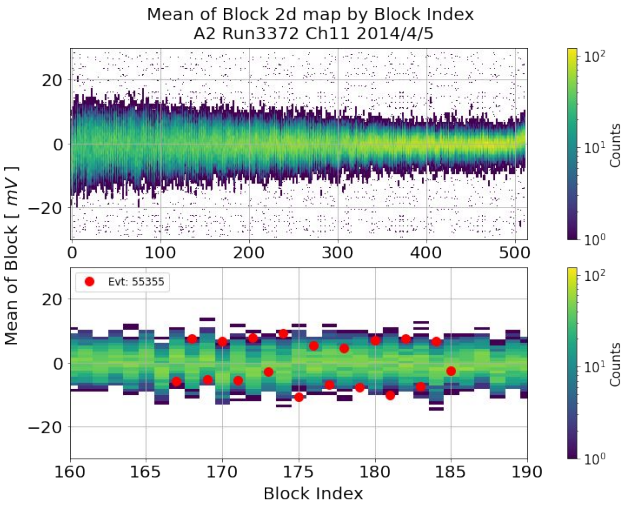
Fig. 62 mean of block of bad event compare mean of block of normal event.
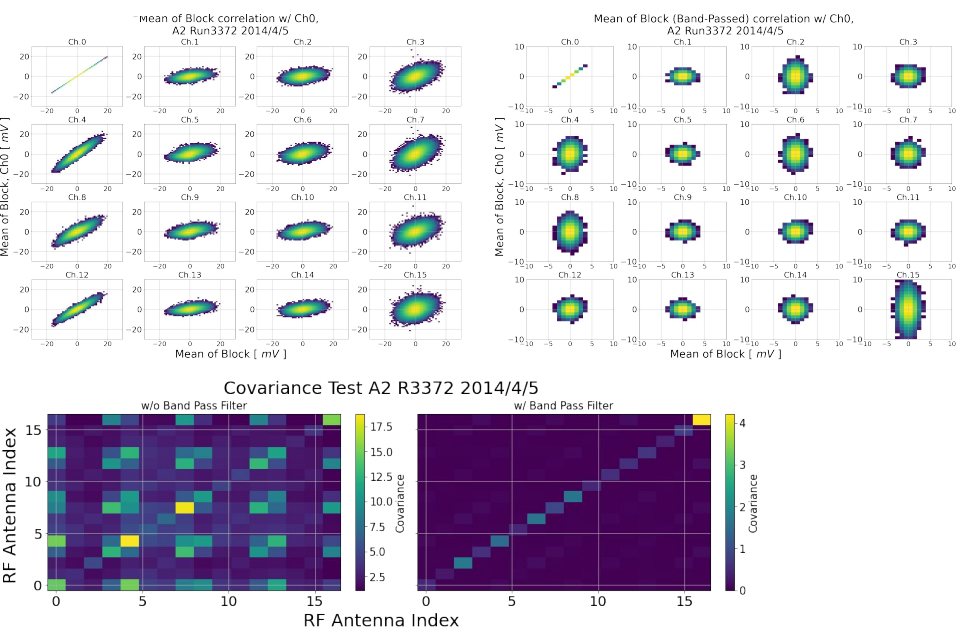
Fig. 63 string correlation of mean of block and covariance test before and after band pass filter
Offset block is creating an unexpected peak in the correlation map and highlight on the sky map
Band pass filter is ‘neutralizing’ block offset and unexpected correlation
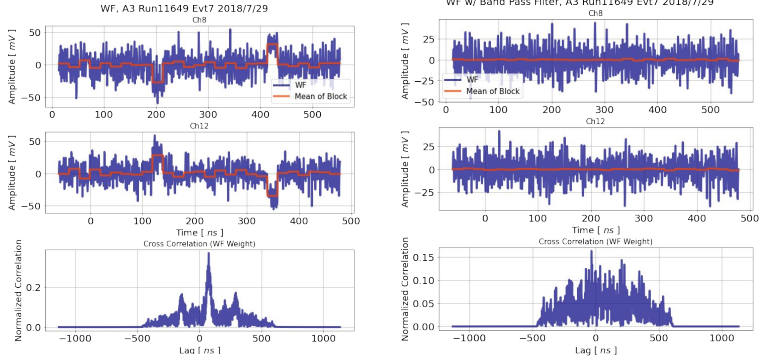
Fig. 64 corss correlation before and after band pass filter
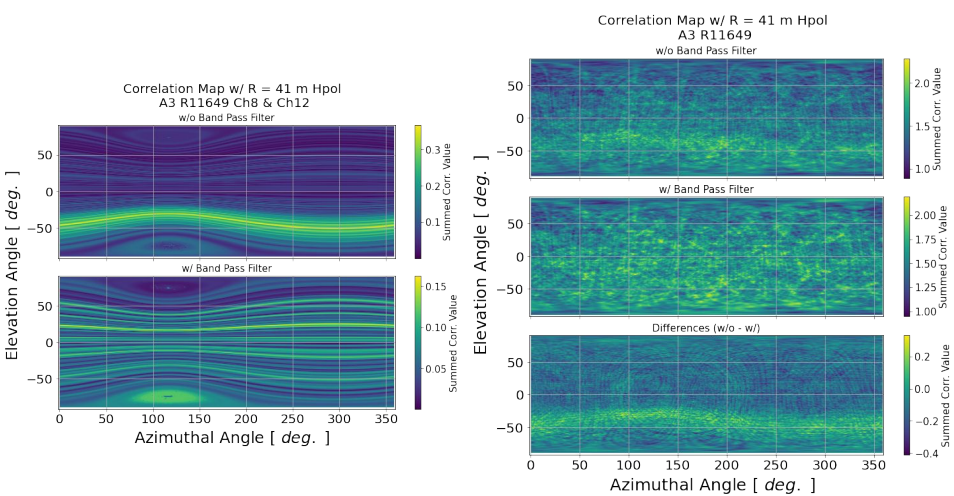
Fig. 65 reconstruction results before and after band pass filter
Spark event
Related doc. BD2781
This is done by get_spark_events function
Relatively high amplitude signal in only one string. Source of this event would be fluctuation of electronic on just one string
ratio of average power of most powered string / average power of next most powered string is used for removal
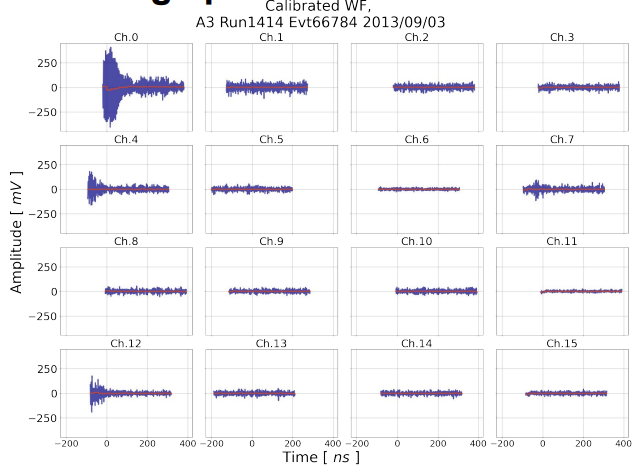
Fig. 66 example of spark event
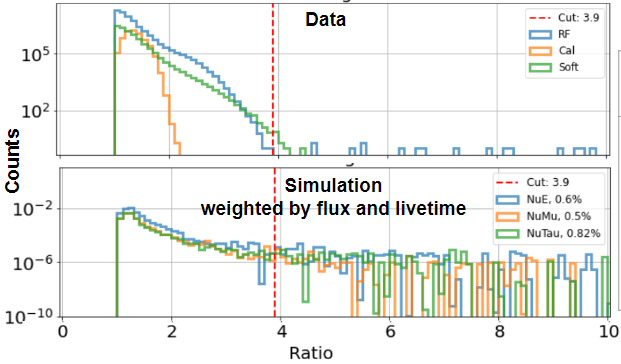
Fig. 67 distribution of the ratio data and sim
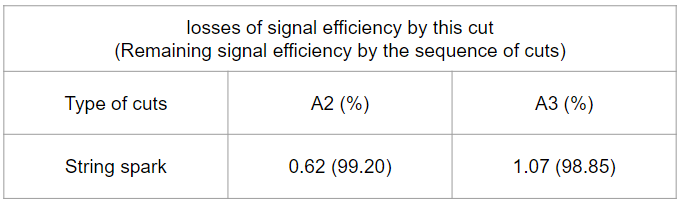
Fig. 68 live time losses by spark event