Simulation
Detector modeling
Related doc. for antenna model DB1591, DB1693, DB1838
Related doc. for signal chain gain DB1179, DB1188, DB2622 ~ 2626,
In order to simulate realistic detector response, detector model per station A2 and A3 is developed from data itself
Antenna model is based on pulser lift run performed at the South pole
Antenna model can be found at AraSim. In_situ_VPol_Model.txt, In_situ_HPol_Model.txt
Signal chain gain (electronic response) model is obtained from forced (software) trigger data and in-ice noise estimation
Detector model is produced by delow command:
source ../setup.sh
python3 script_executor.py -k rayl -s <station ID> -r <run number> -b 1              # produces noise and gain model
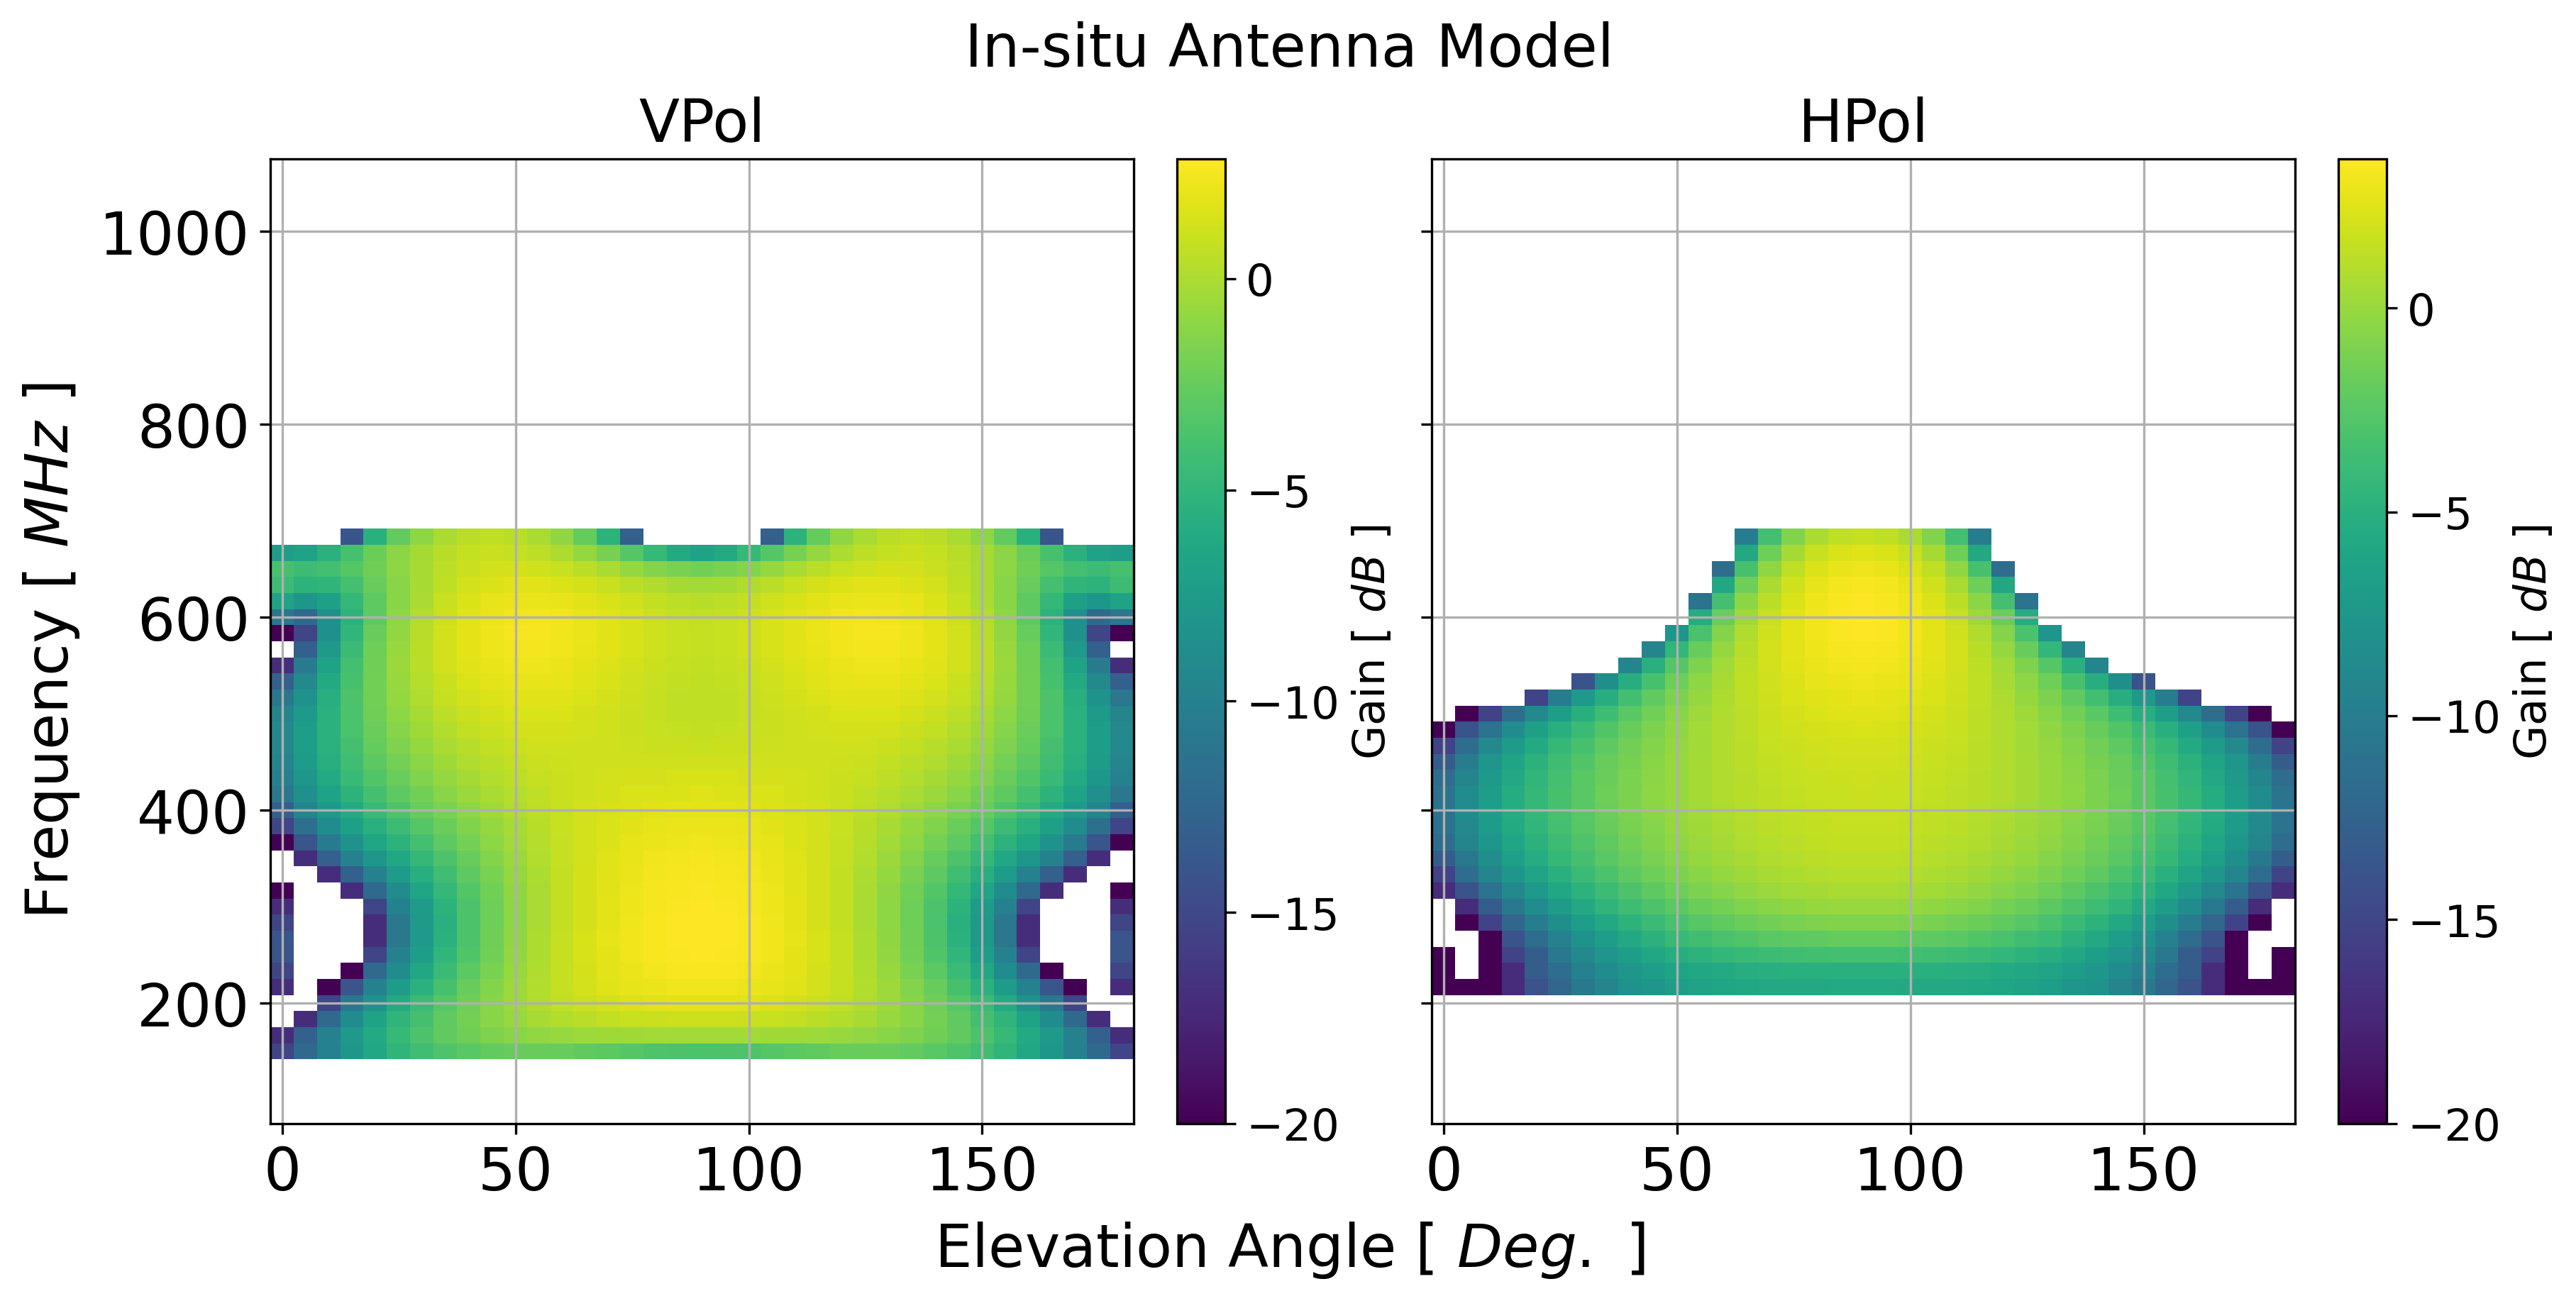
Fig. 69 in-situ antenna model in dB scale
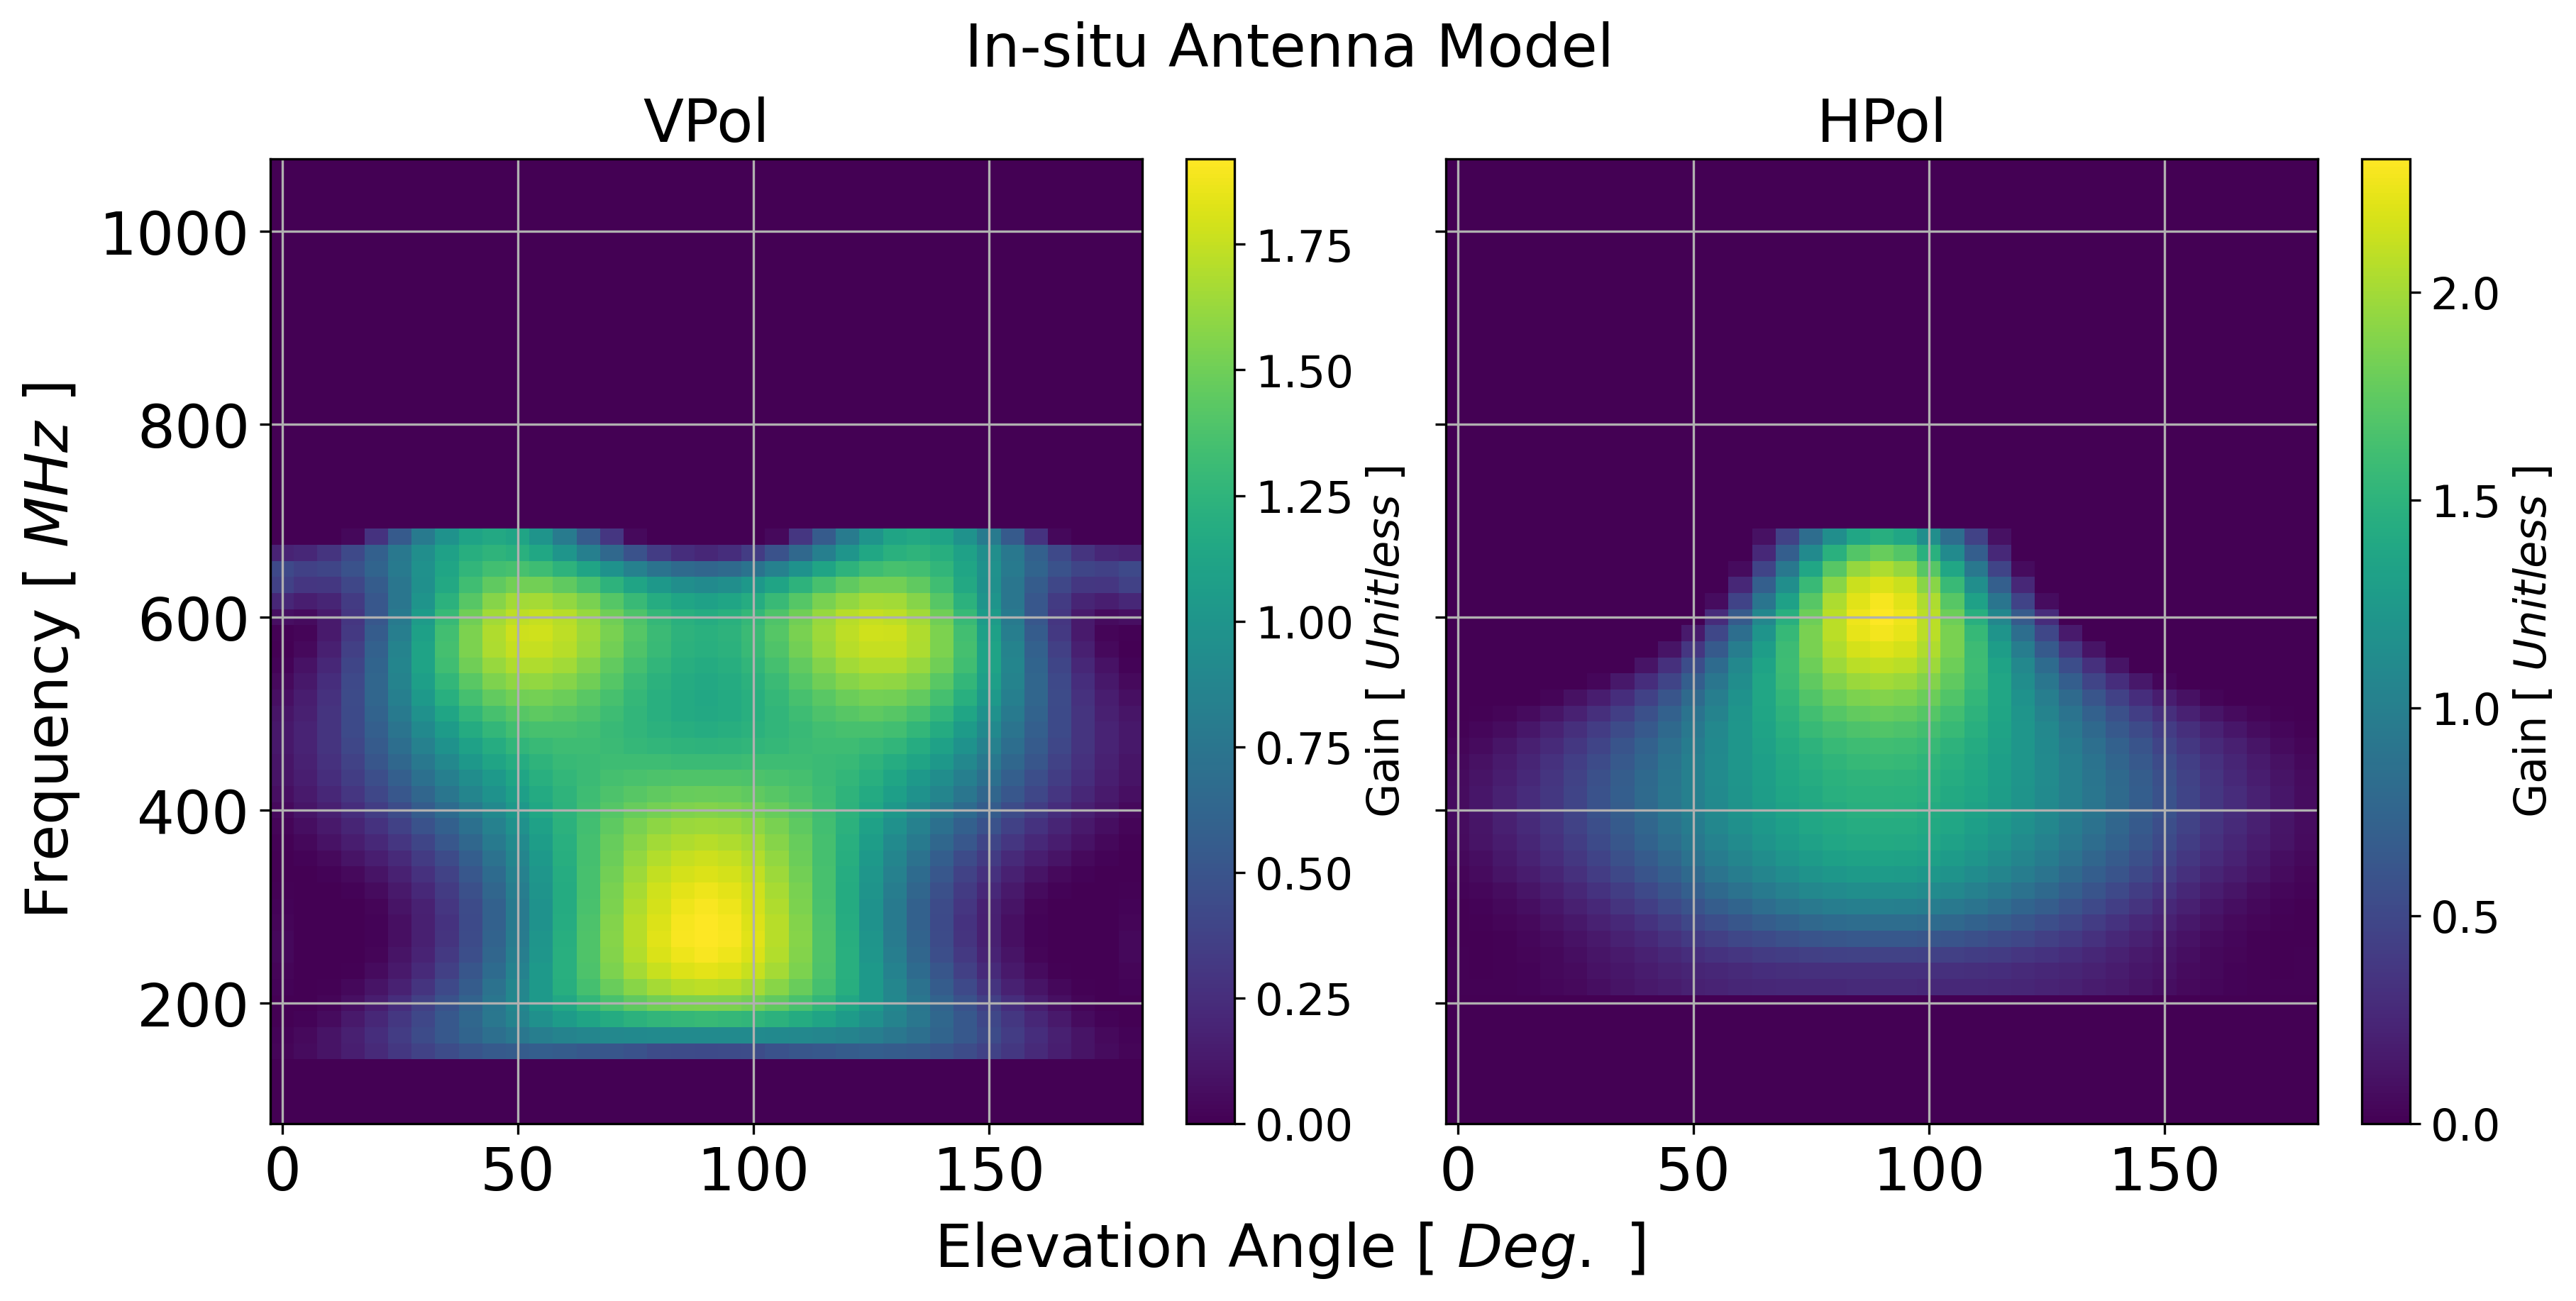
Fig. 70 in-situ antenna model in linear scale
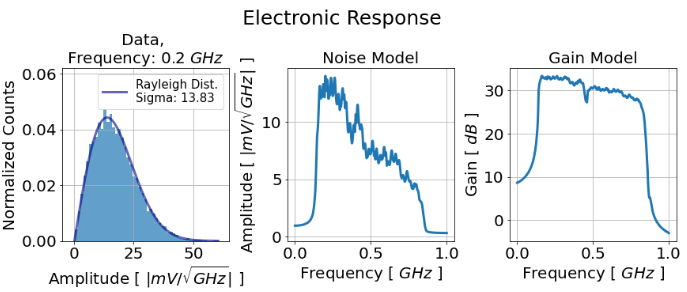
Fig. 71 software trigger data to signal chain gain model
Signal / Noise generation
User can find setup file from here: A2 and A3
User can launch the simulation like executing below commands from AraSim/ path:
source /home/mkim/analysis/MF_filters/setup.sh
./AraSim /home/mkim/analysis/MF_filters/sim/ARA02/sim_signal_setup_full/signal_E16_F1_A2_R1.txt 0 /data/ana/ARA/ARA02/sim_signal_full
Signal
E^-1 spectrum between 10^7 ~ 10^12 GeV
8k events per 1) flavor, 2) decade, and 3) configuration
total # of event. A2: 840k, A3: 1080k
Injection volume of each decade is following previous analysis
Each simulation set is tuned to follow each configuration in data sample section
Noise
1 mil. noise events per configuration
Recreating thermal noise event based on in-situ signal chain gain model and random distribution
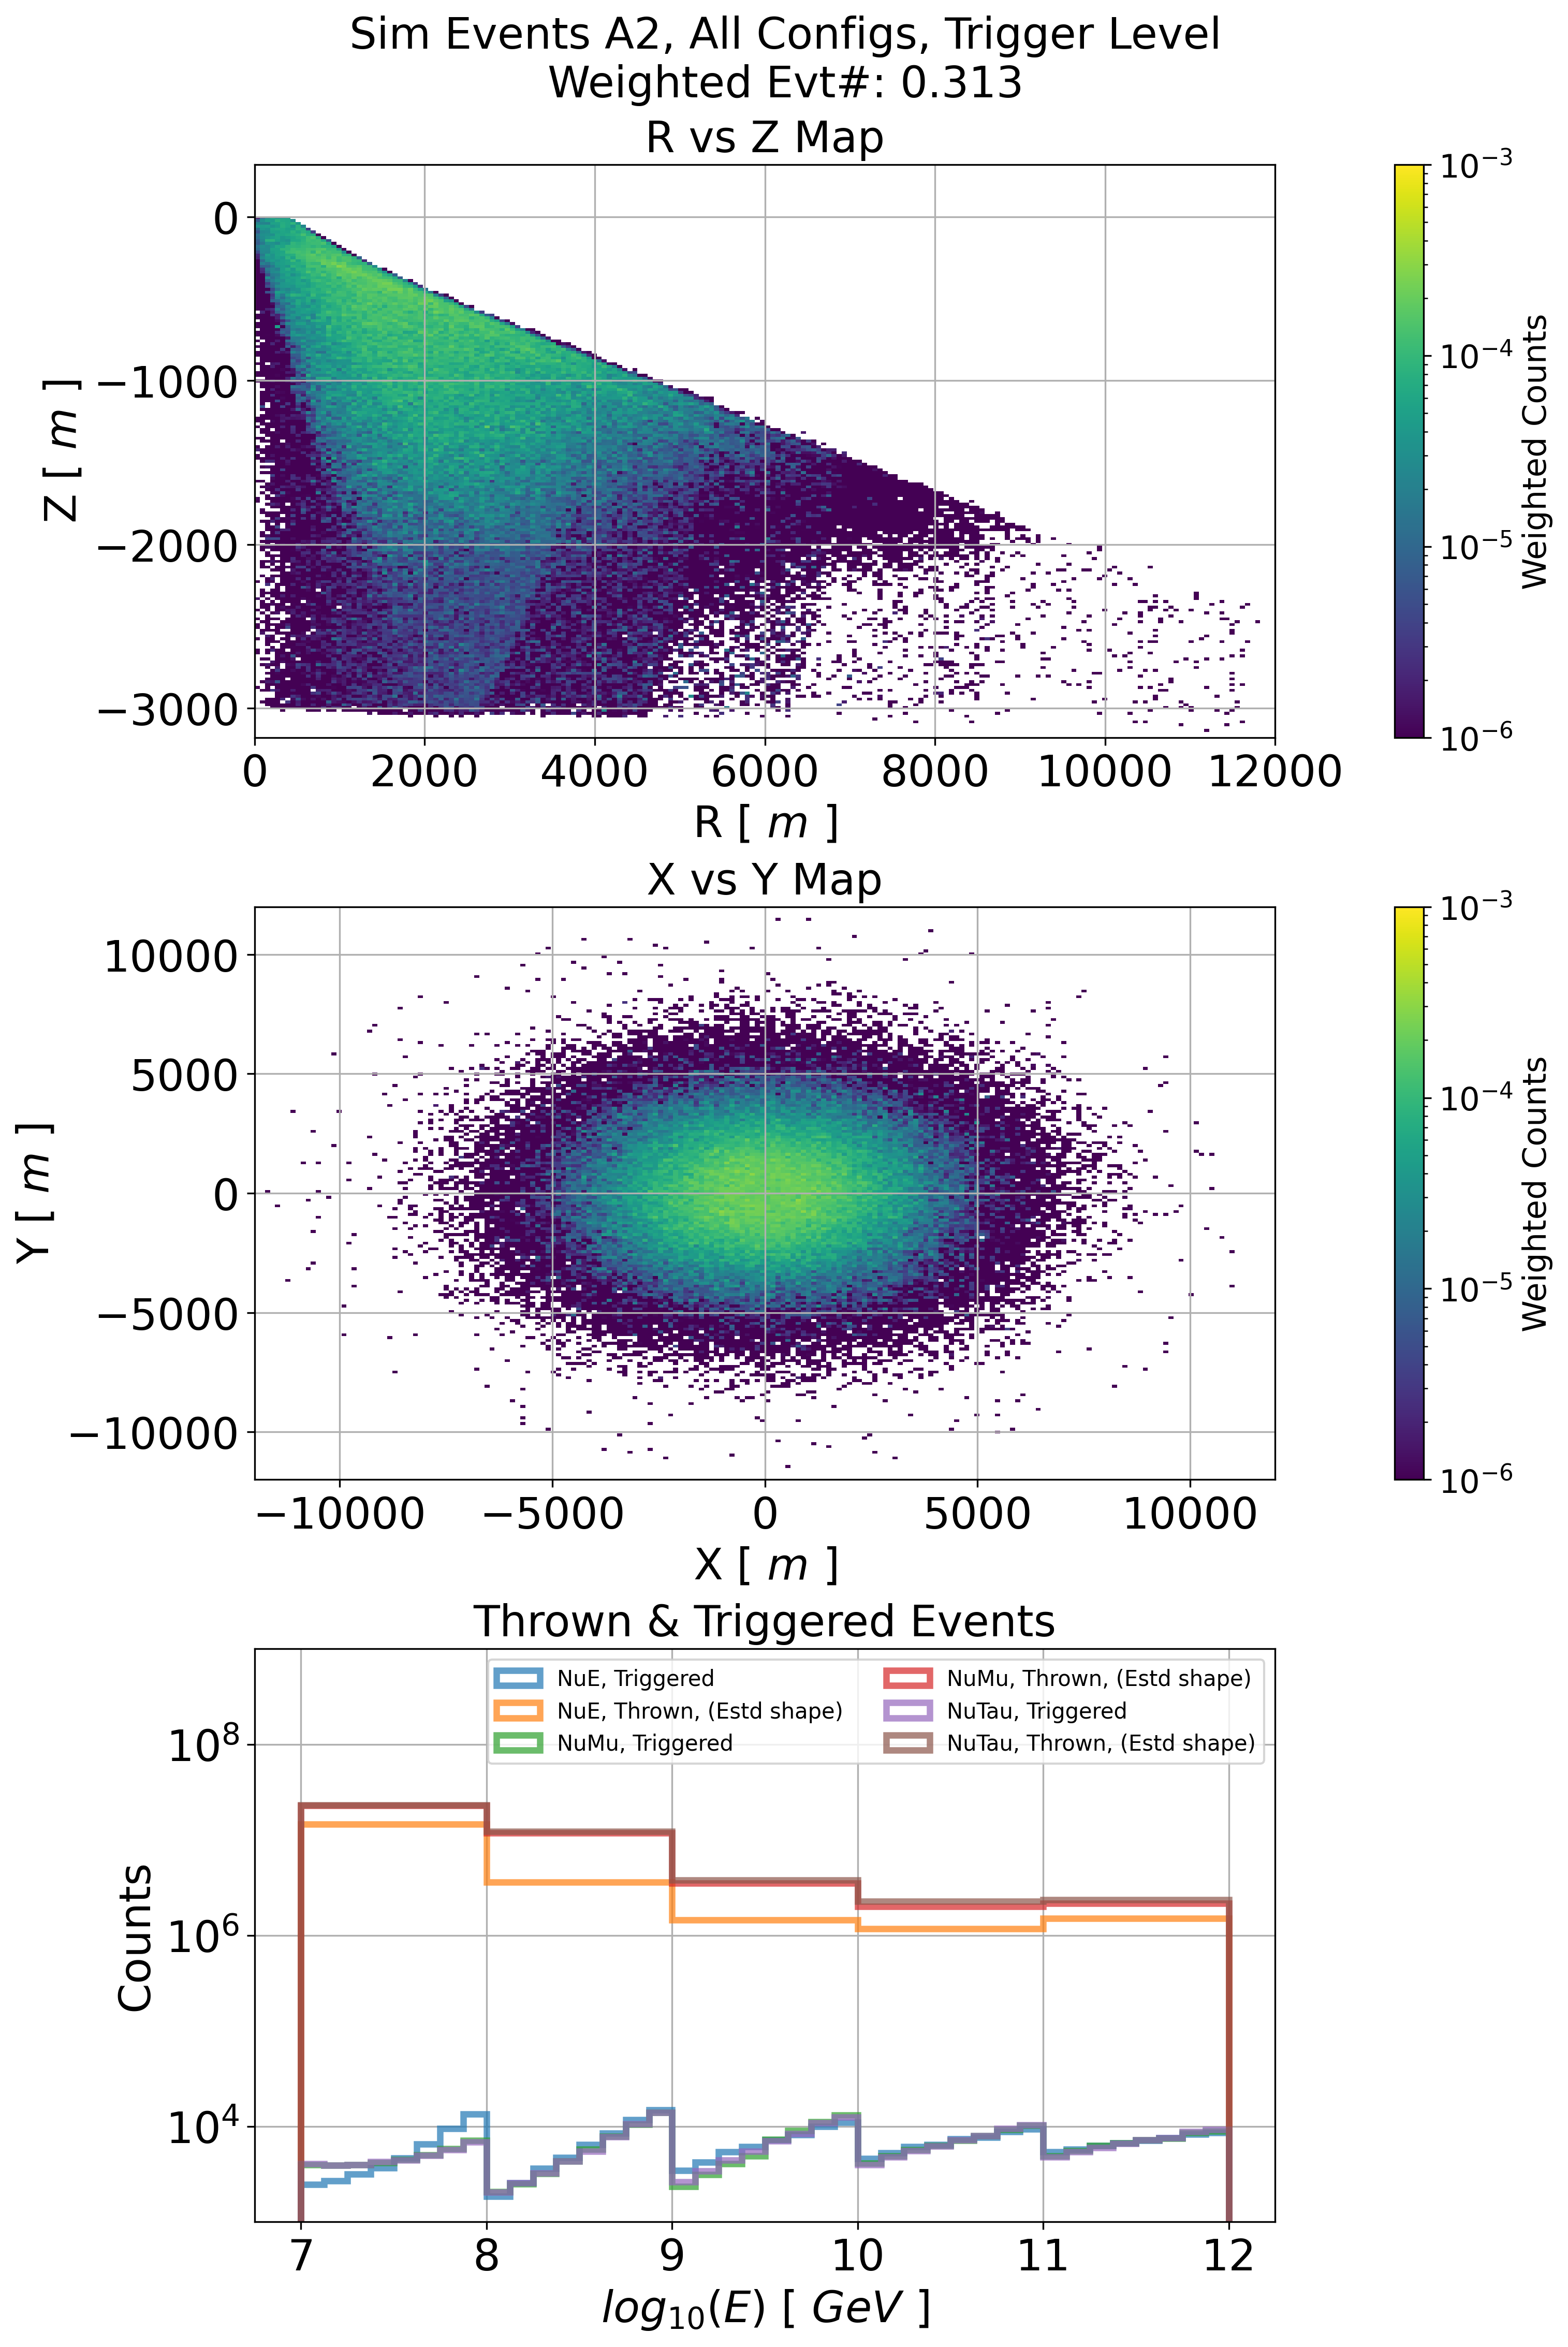
Fig. 72 sim summary plots
Signal generation supplement
Simulation is set to stop based on number of ‘triggered’ event
It will continue to throw event until it gets desired number of ‘triggered’ event
Thats why it has different thrown per decade and flavors, but similar number of triggered event
Simulation was run in E^-1 for each decade
If It runs in E^-1 for all energy range at once, I will get only few low energy event
Thats why triggered events have discontinuing shape, but I get decent amount of low energy event
Estd shape means estimated shape of thrown events.
(Unfortunately) Sim didn’t save the energy of all thrown event. It only saved number of thrown events. So, I estimated E^-1 shape based on number of thrown events
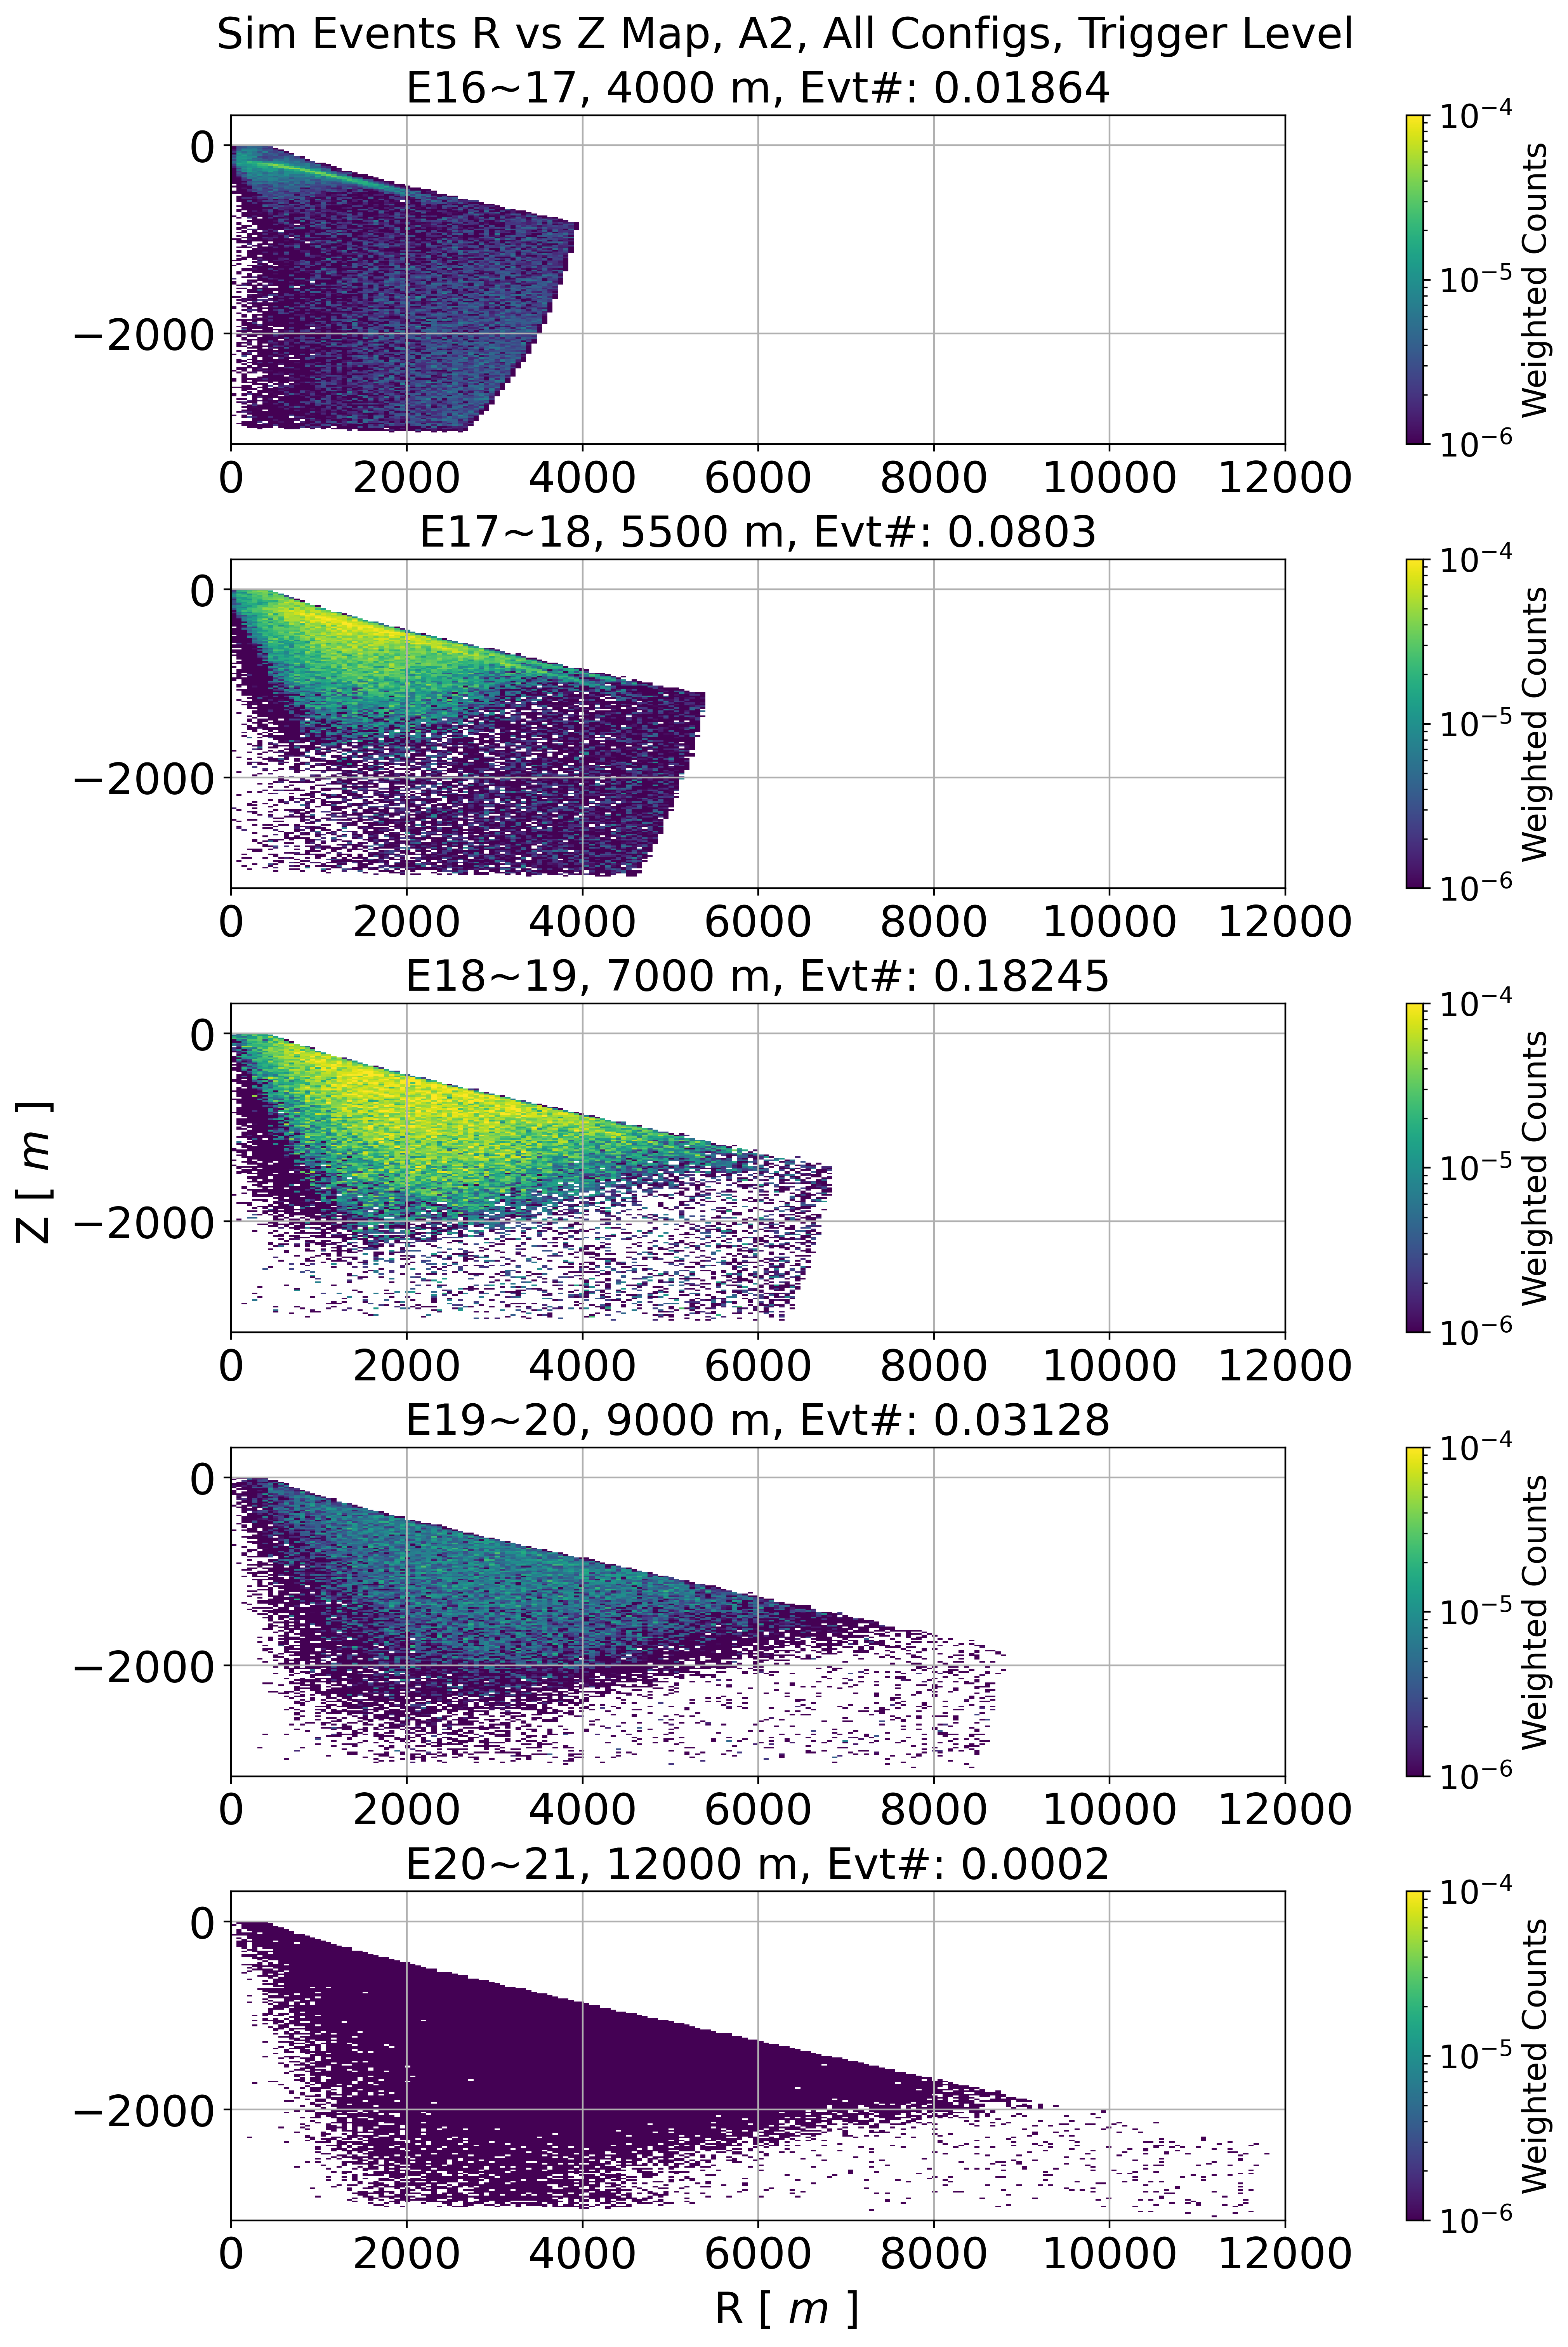
Fig. 73 A2 sim RZ plot in each energy decade and radius
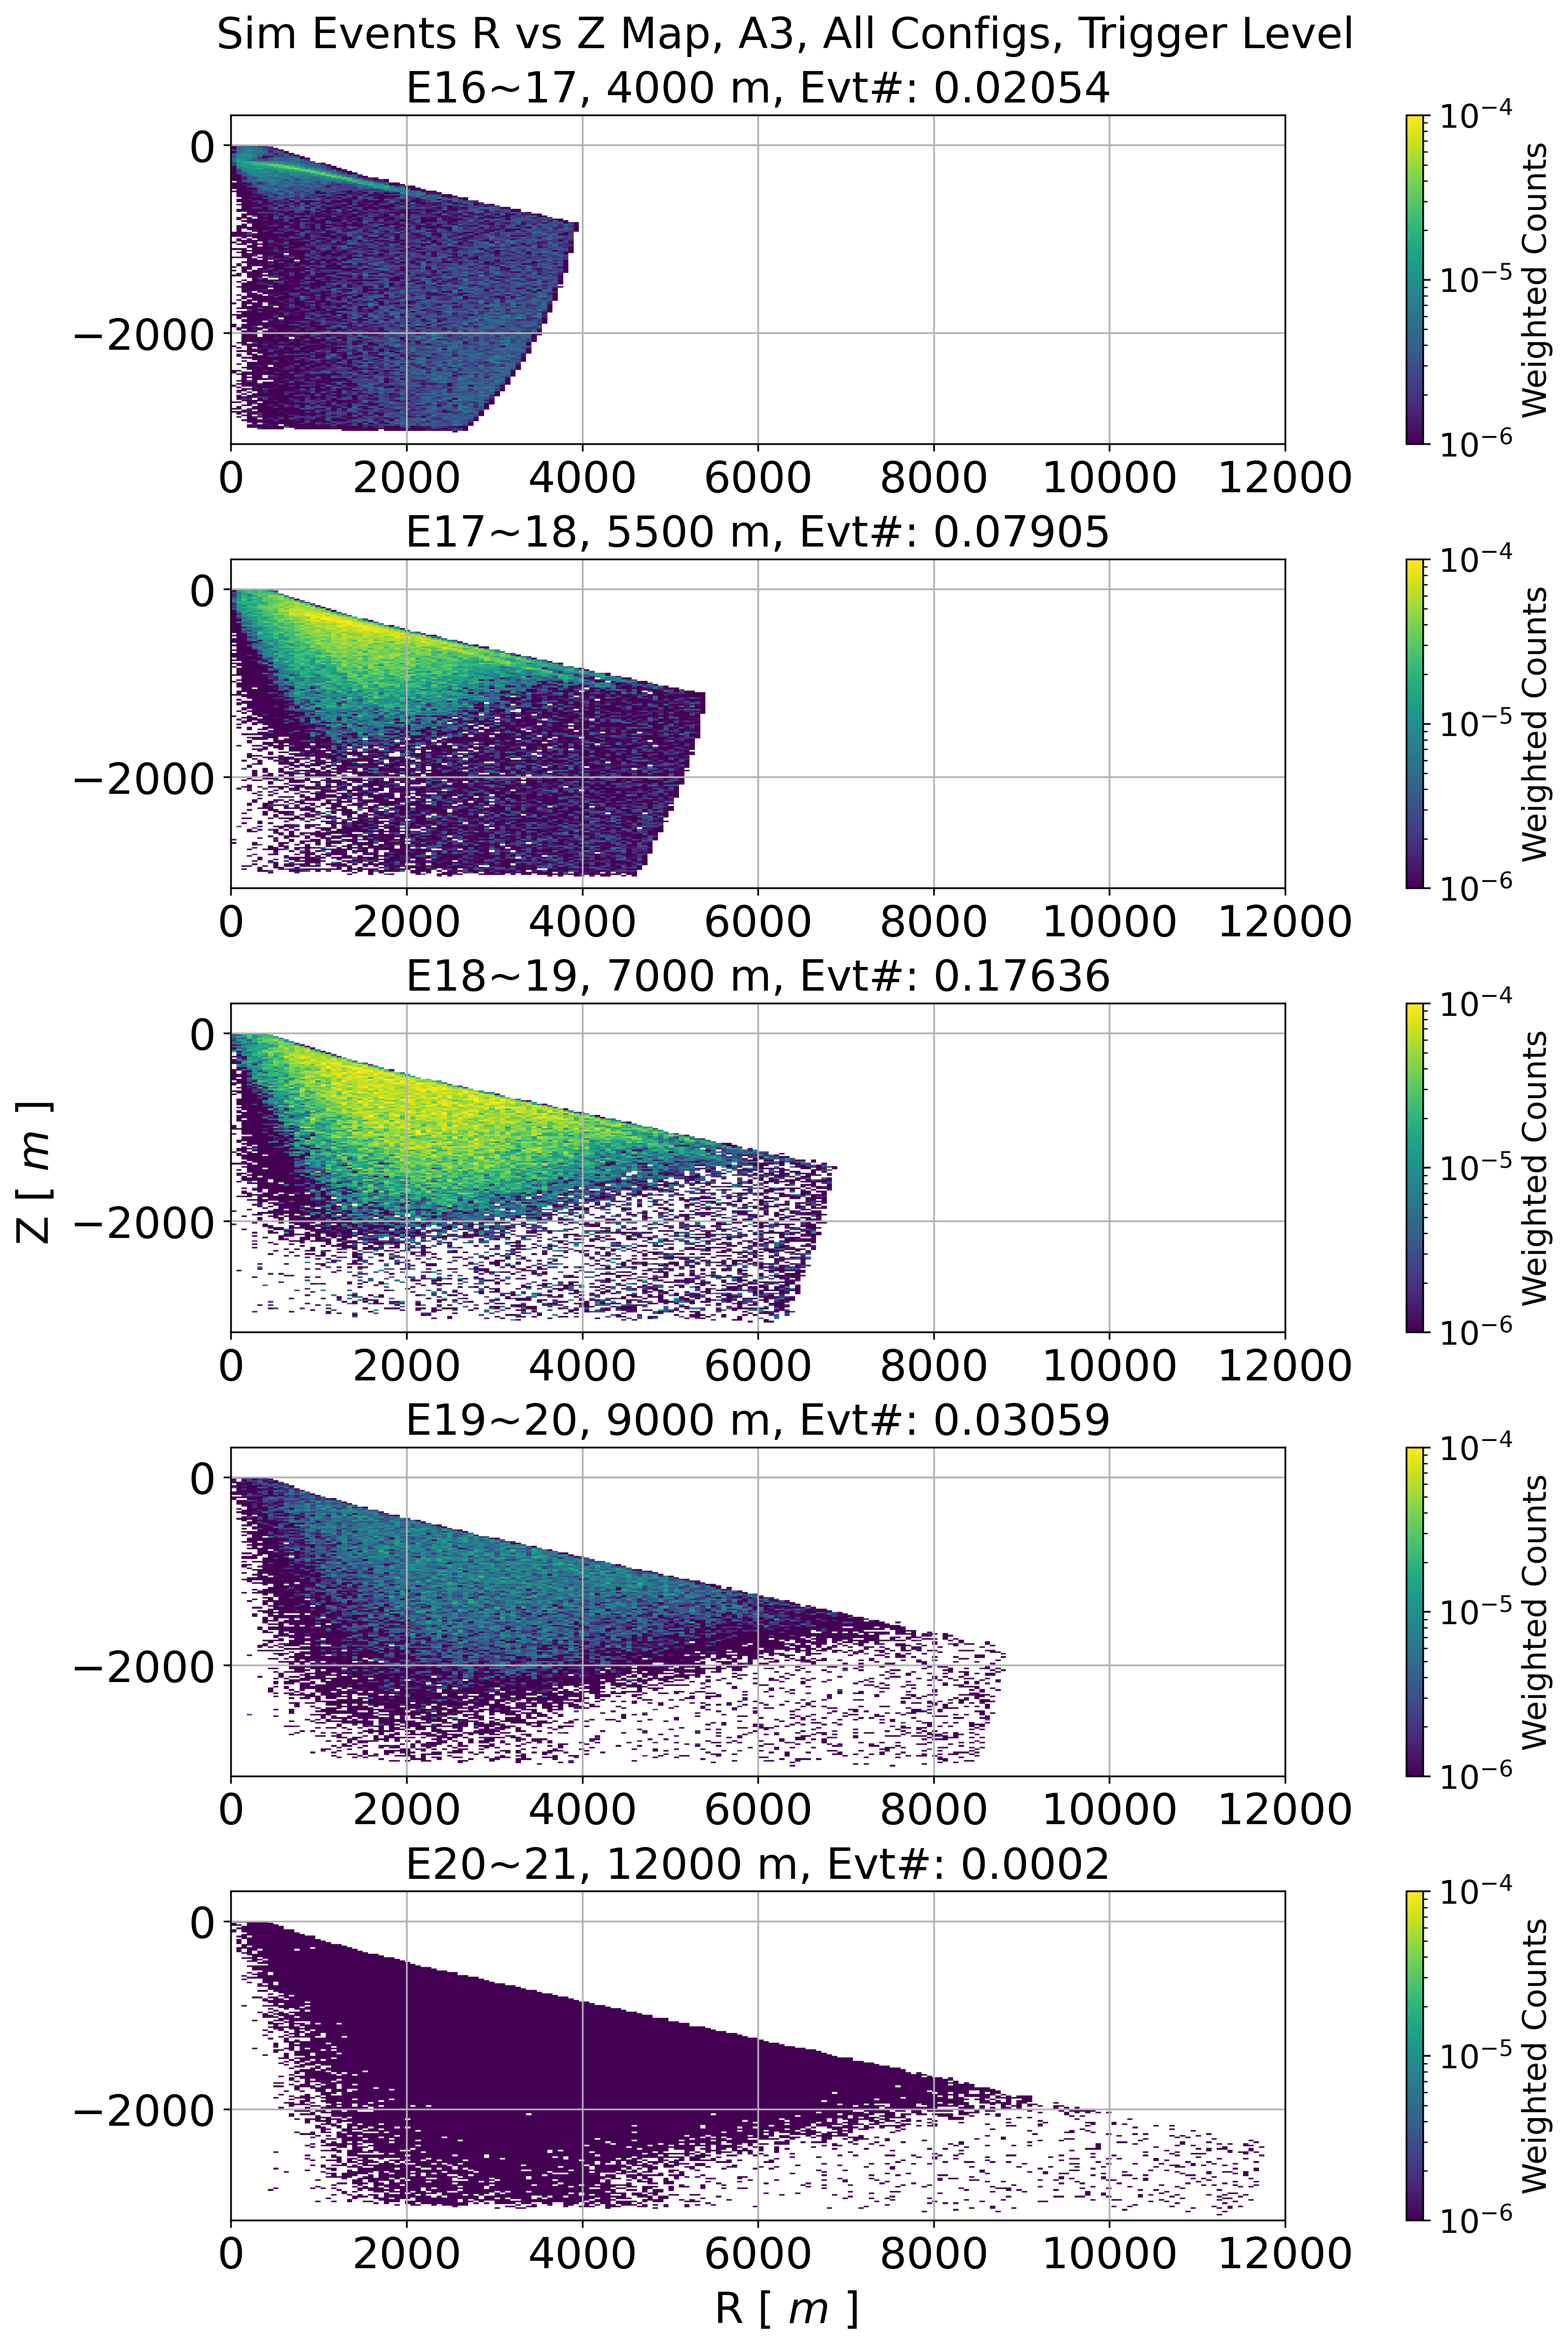
Fig. 74 A3 sim RZ plot in each energy decade and radius
Effective Area Check
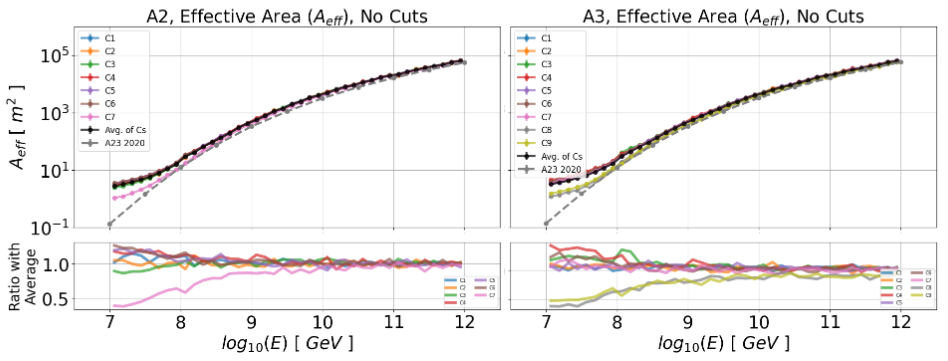
Fig. 75 A23 effective area in trigger level
Effective area by triggered event
Based on new gain and threshold value, low energy has an improvement compare to previous analysis’s Aeff
A2 config 7 and A3 config 8 / 9 have lower area based on less # of trigger antenna at the time period