


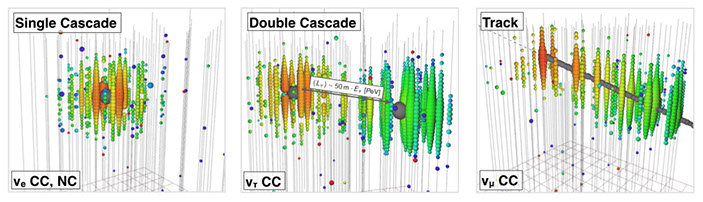
Simulated event topologies.
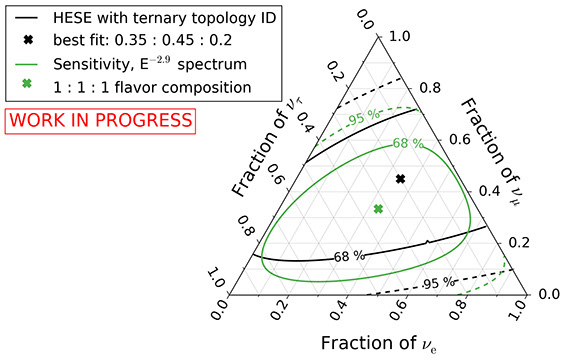
Measured flavor composition of IceCube HESE events with ternary topologyID and sensitivity at the best fit spectrum. Contours obtained using Wilks' theorem.
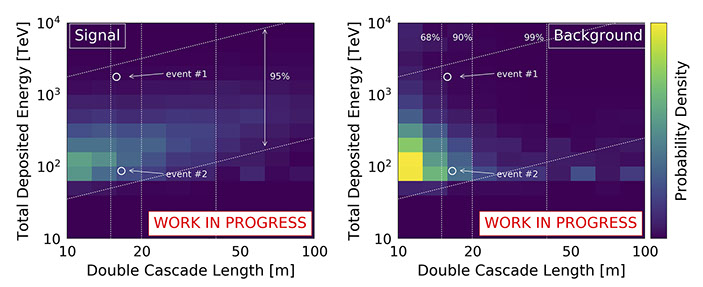
Double cascade observables histograms showing total deposited energy against reconstructed length for the double cascade sample. Signal nu-tau-induced double cascade events) histogram (left). Background (all remaining events) histogram (right). The two tau-neutrino candidate events are overlaid as white circles (see below).
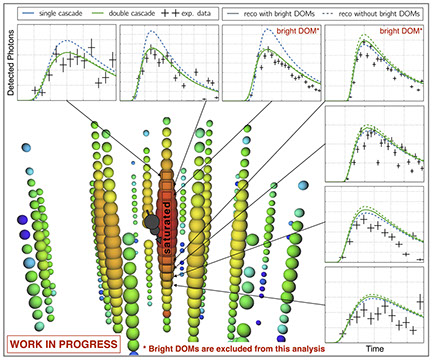
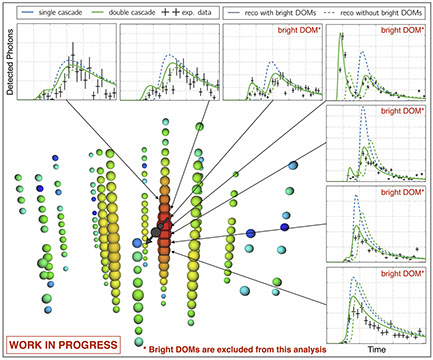
Double cascade events: Event#1 (2012). The reconstructed double cascade positions are indicated as grey circles, the direction indicated with a grey arrow. The size of the circles illustrates the relative deposited energy of the two cascades.
Double cascade events: Event#2 (2014). The reconstructed double cascade positions are indicated as grey circles, the direction indicated with a grey arrow. The size of the circles illustrates the relative deposited energy of the two cascades.
<
5 - 5
>