Simulation of the Skymaps
The main goal of this chapter is to explain the skymap simulation for a combination of the samples IC59, IC79, IC86 2011, IC86 2012 13 14 , in a way that they a comparable to skymaps from experimental data. All plots in this section have been made for the best fit spectral index of \(\gamma=2.13\) .
How to build skymaps?
From astroparticle physics we know that there are 3 different kind of events we have to consider in order to build realistic skymaps:
- ‘Astrophysical signal’ neutrinos \(n_{\mathrm{ps}}\) clustered around a given source position
- ‘Astrophysical diffusely’ distributed neutrinos \(n_{\mathrm{diff}}\)
- ‘Atmospheric’ neutrinos \(n_{\mathrm{atm}}\)
For these two classes of neutrinos, astrophysical and atmospheric, weighted Monte Carlo Events in IceCube are generated respecting their different spectral index, as well as energy and zenith dependence and including the detector specifications. Following, Skymaps are generated by randomly choosing (respecting the different weights) events with zenith angle \(\Theta\), azimuth angle \(\Phi\) and Energy E from the samples.
The multipole analysis basically needs three different kinds of skymaps (corresponding to three different kinds of neutrino flux hypothesis, also see section Multipole Analysis - Method):
- Signal hypothesis: \(n_s=n_{\mathrm{ps}}\) and therefor \(n_{\mathrm{diff}}=0\), signal maps contain clustered astrophysical events and atmospheric events (Pure Signal Skymaps)
- Background hypothesis: \(n_s=n_{\mathrm{diff}}\) and therefor \(n_{\mathrm{ps}}=0\), background maps contain diffuse astrophysical events and atmospheric events (Pure Atmospheric Skymaps )
- Mixed hypothesis \(n_s=n_{\mathrm{ps}}+n_{\mathrm{diff}}\), containing both clustered and diffuse astrophysical events to describe a more realistic setting, used for determining the analysis’ sensitivity (Experimental Like Skymaps)
The relevant parameters for distinguishing between these kind of maps are the average source strength \(\mu\) (Notation: \(\mu_{tot}\) for the 6-year source strength, \(\mu^X\) for the single sample source strength \(X \in \{IC59,\,IC79,\,IC86 11,\,IC86\,12\,13\,14 \}\), mus without subcript show that the equation is valid for all the mentioned mus ) and the number of sources \(N_{Sou}\). Although, because of the different zenith acceptance, the ‘real’ \(\mu\) depends heavily on the source position we claim \(<n_s>=N_{Sou} \cdot \mu\). Hence \(\mu\) is only a free parameter for the Experimental Like Skymaps.
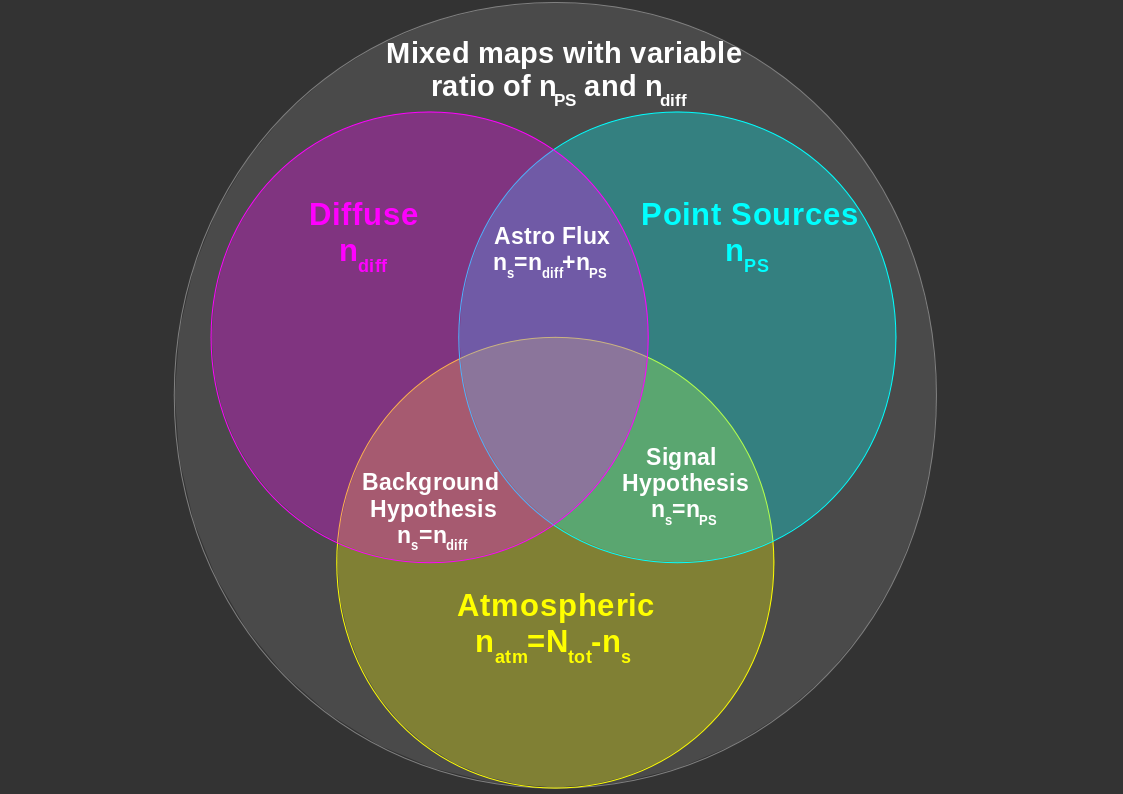
Fig. 15 Visualization of the different types of skymaps and their composition
In order to make the skymaps comparable with experimental data a number of constraints have to be fullfilled:
- The total number of neutrinos in each skymap must equal the expected amount of experimental neutrinos
- For a given spectral index \(\gamma\) the number of astrophysical neutrinos per skymap must follow a poisson distribution around the expectation
- Since the detector configuration changes over the years the ratio of clustered neutrinos at a given source position must match over the years according to the change of the detectors effective area
- Only include events with a zenith angle \(\Theta>85°\), according to events which have a minimum water overburden ob 12km (reject atmospheric muon background). Also accept events with true zenith angle between 84° and 85° degrees if the scatter into this range.
In contrast to the prior analysis for IC79 each skymap is now a combination of four distinct skymaps (one for each sample). For the background the skymaps of different years can simply be merged. For the other skymaps the transition from sample to sample has to be done more carefully, since the signal distribution over the years has to be calculated before finally merging the maps. The procedure is described in more detail in the next sections.
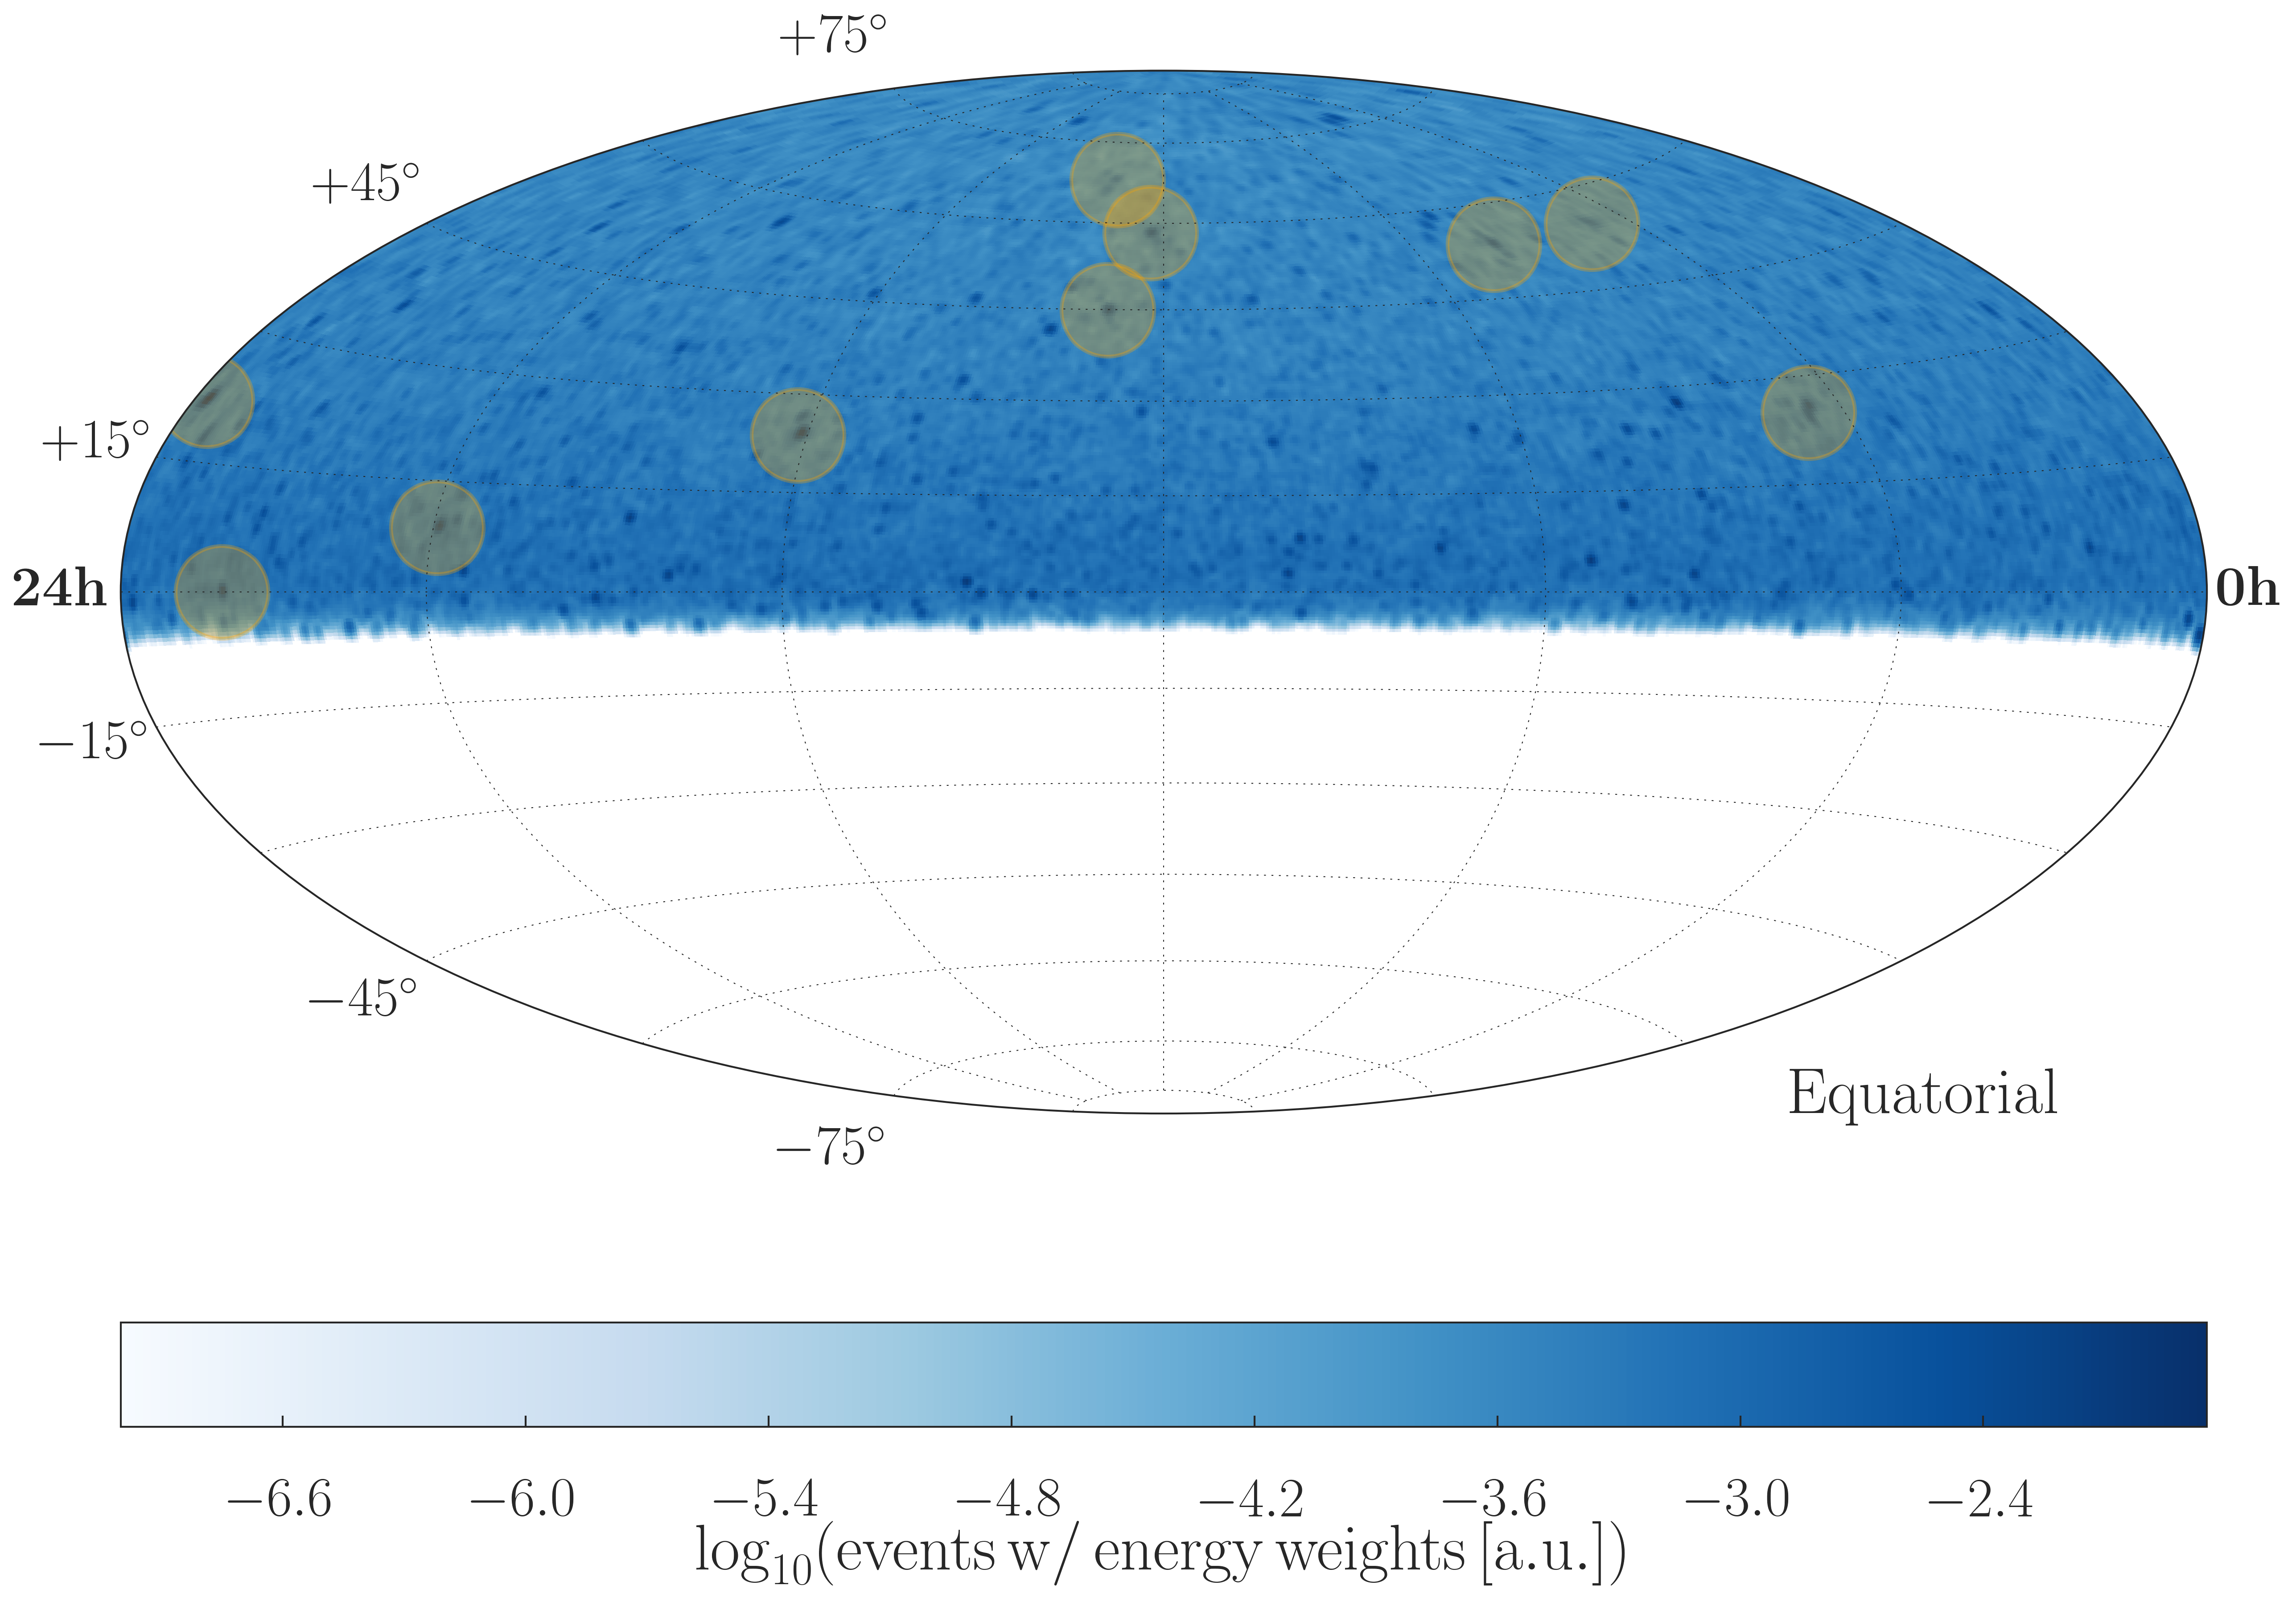
Fig. 16 Exemplary Experiment Like Skymap with 10 Sources and \(\mu_{tot}=34.2\)
Energy Weights
A main improvement in the recent IC79 Analysis is based on the introduction of energy weights in order to respect the different functional dependencys of the atmospheric and astrophysical neutrino flux. The neutrino flux is dominated by the latter above a reconstructed energy over 200 TeV.
The analysis uses a bayesian approach in order to esimate the probability of an event beeing of astrophysical origin. Therefore
\(P(astro|E)=\frac{P(E|astro)\cdot P(astro)}{P(E)}\)
Here the probability to find a neutrino with given E assuming that it is astrophysical, is given by the energy p.d.f from the diffuse fit S(E). The a priori probability for an astrophysical event is given over:
\(P(astro)=n_{astro}/N_{tot}\)
In an analogous way the denominator is calculated with the conditional probability B(E) of finding a neutrino with energy E assuming that it is of atmospheric origin P(E|atm).
Plugging all into Bayes Theorem the energy weights are given by
\(w(E)=\frac{S(E)\cdot n_{astro}}{S(E)\cdot n_{astro}+ B(E)\cdot(N_{tot}-n_{astro})}\).
The events in the skymap above are already given in including their energy weights. Hence the colorscale is in arbitrary units.
The Different Type of Sykmaps
Background maps
Background maps consist of diffuse astrophysical and atmospheric neutrino events. The number of astrophysical events is chosen randomly for each map from a poissonian distribution with mean value \(\langle n_s \rangle\) (see chapter MC Sample for expected values). Afterwards atmospheric events are generated until the maximum number of events \(N_{tot}=n_{\mathrm{atm}}+n_s\) is reached. Finally the energy weights for each event are calculted and the resulting skymap is expanded in spherical harmonics to get the powerspectrum \(C_l^{eff}\).
Calculating the correct signal distribution for Signal and Experimental-Like Skymaps
Distributing the source strength \(\mu_{tot}\) basically includes two different aspects:
- Distributing the signal neutrinos for one skymap according to their spacial distribution (just for Signal Skymaps)
- Distributing the signal neutrinos for fixed source positions over the samples (Signal and Experimental-Like Skymaps).
At the beginning of the skymaps simulation the source positions for \(N_{Sou}\) are chosen according to a isotrop distribution over the sky. Afterwards, starting with one arbirary sample, the source strength \(\mu^X_i\) for a chosen position is calculated using a zenith acceptance spline \(\rho\) taken from the MC data:
\(\mu^X_i=\frac{\rho(\Theta_i)}{\sum_{i=1}^{N_{Sou}}\!\rho(\Theta_i)} \cdot \mu^X \cdot N_{Sou}\)
Now, that the source strength distribution is known for one year, the source strength has to be distributed for each fixed position over the years. This is done easily for signal skymaps as \(\mu^X\) is not a free parameter and hence the above procedure can be applied for each year. For Experimental-Like skymaps the situation is somehow different. Since the detector configuration changes over the years the question is how to transform the skymap settings \(\mu^X\) from one sample to the other (assuming \(N_{Sou}\) to be fixed). Assuming that the spatial source and source strength distribution are already calculated as above for one year, the procedure of transition to multiple years is mainly based on the calculation of the ratio of the effective areas between the years. The plot below shows the fraction of the effective areas in a way that \(\sum_{X \in Samples} w^X(\Theta_i)=1\). The source strength for another year is then subsequently caculated over:
\(\mu_i^X=\mu_i^Y \cdot \frac{w^X(\Theta_i) \cdot t^X}{w^Y(\Theta_i)\cdot t^Y}\)
with the detector uptime t in sample Y and X, respectively. Finally the for each source position in each sample the number of signal neutrinos can be calculated according to a poisson distribution with mean \(\lambda=\mu_i^X\)
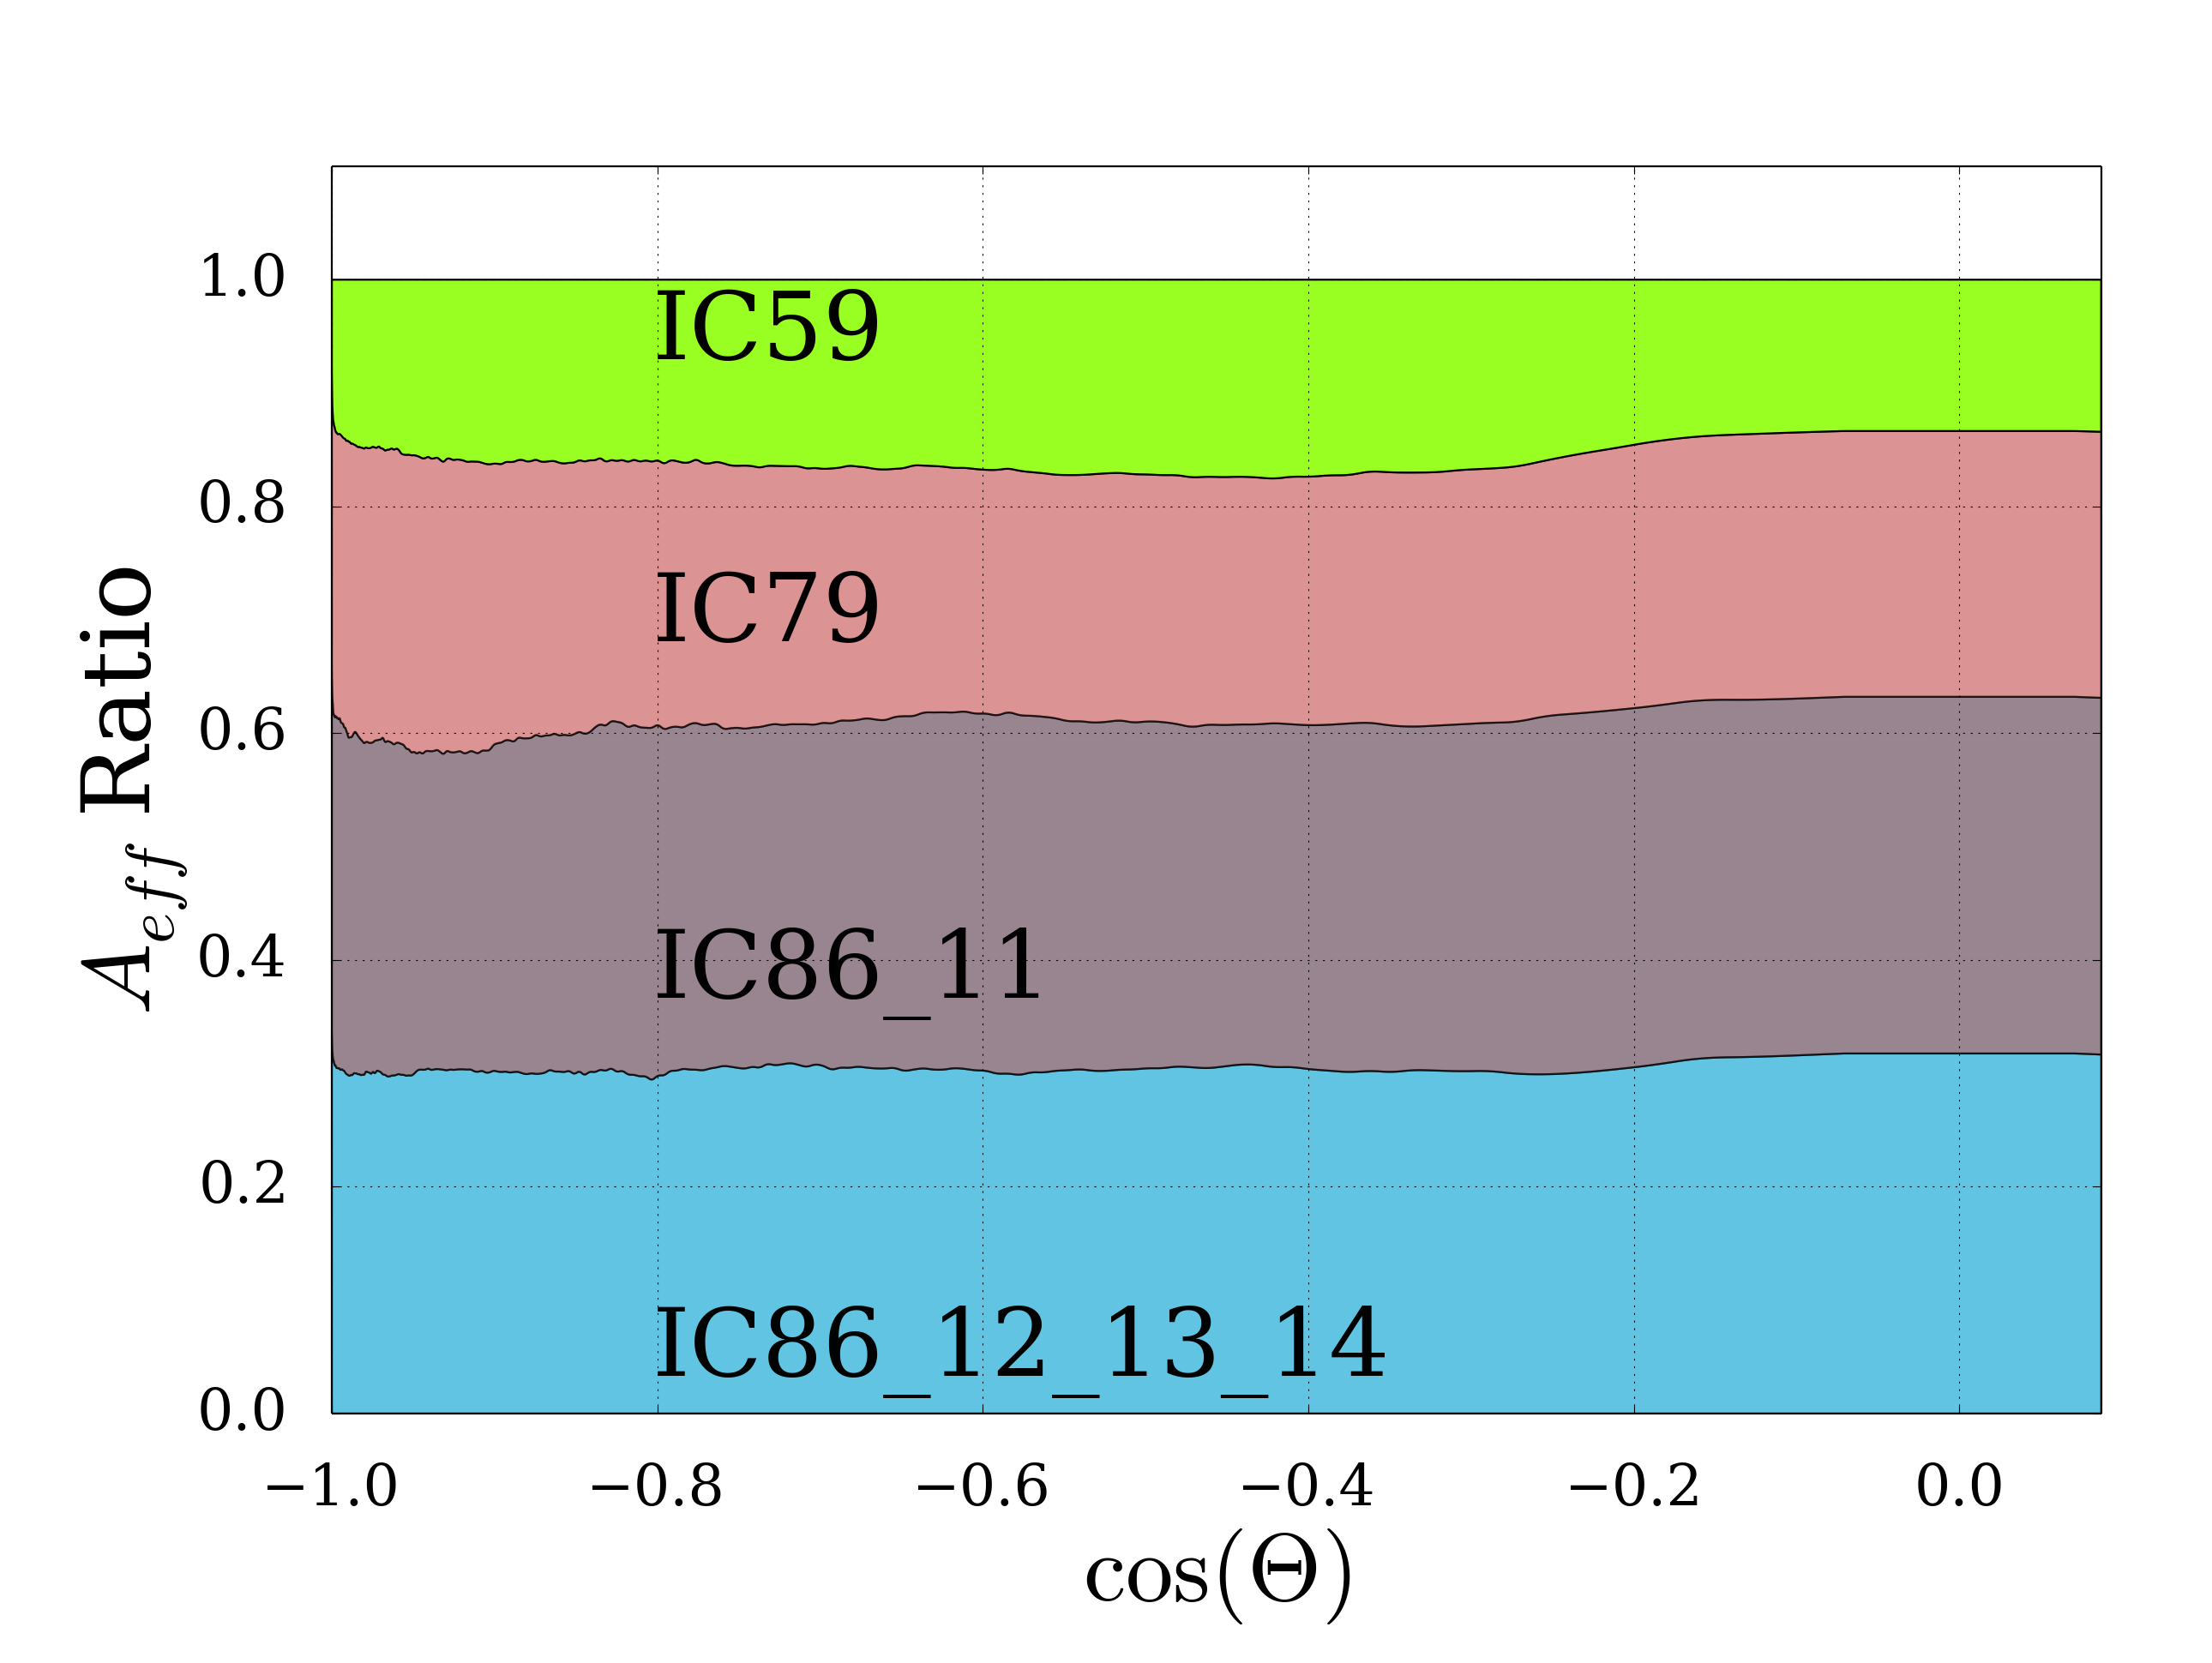
Fig. 17 Ratio of the effective areas in dependence of the energy between the different samples
Signal maps
In signal maps the astrophysical neutrinos are clustered, in contrast to the background maps where they are diffusely distributed. The energy and zenith acceptance splines are identical for both kinds of astrophysical events, so obviously only the spatial distribution differs. This is important with regard to which hypotheses are tested here. The astrophysical signal distribution is characterized by the number of sources \(N_{sou}\) and the source strength \(\mu\).
Requirements for the simulation:
- All astrophysical events are clustered
- Mean number of signal events is still equal to \(\langle n_s \rangle\)
- Distribution of all astrophysical neutrinos per map is poissonian, just like in background maps
- Signal maps scrambled in azimuth should be (nearly) identical to background maps
These requirements should be met to ensure that the sensitivity really reflects clustering and avoids including other effects.
Experiment Like skymaps
Experiment Like skymaps consist of all three types of events. First point sources are are filled into the map, but here \(N_{sou}\) and \(\mu_{tot}\) have to be set as parameters. This gives a mean number of signal events for each map \(\langle n_{ps} \rangle =N_{sou} \cdot \mu^X\). \(N_{sou}\) must be chosen in a way that the mean total number of neutrinos is smaller than \(n_s\). The missing events are then allocated as diffuse astrophysical events until \(n_s\) is reached. After the the map is filled up to \(N_{tot}\) with atmospheric events. Mixed maps are then used to estimate the sensitivity of this analysis for clustering astrophysical events constrained by the measured diffuse flux.
Consistency Checks
In order to serve as ‘realistic’ skymaps serveral requirements have to be fullfilled:
- Poisson distribution of the number of the clustered signal neutrinos for the 6-Year merged skymaps (calculation from 1.000/10.000 Skymaps for the Experimental-Like/Pure Signal case, respectivly):
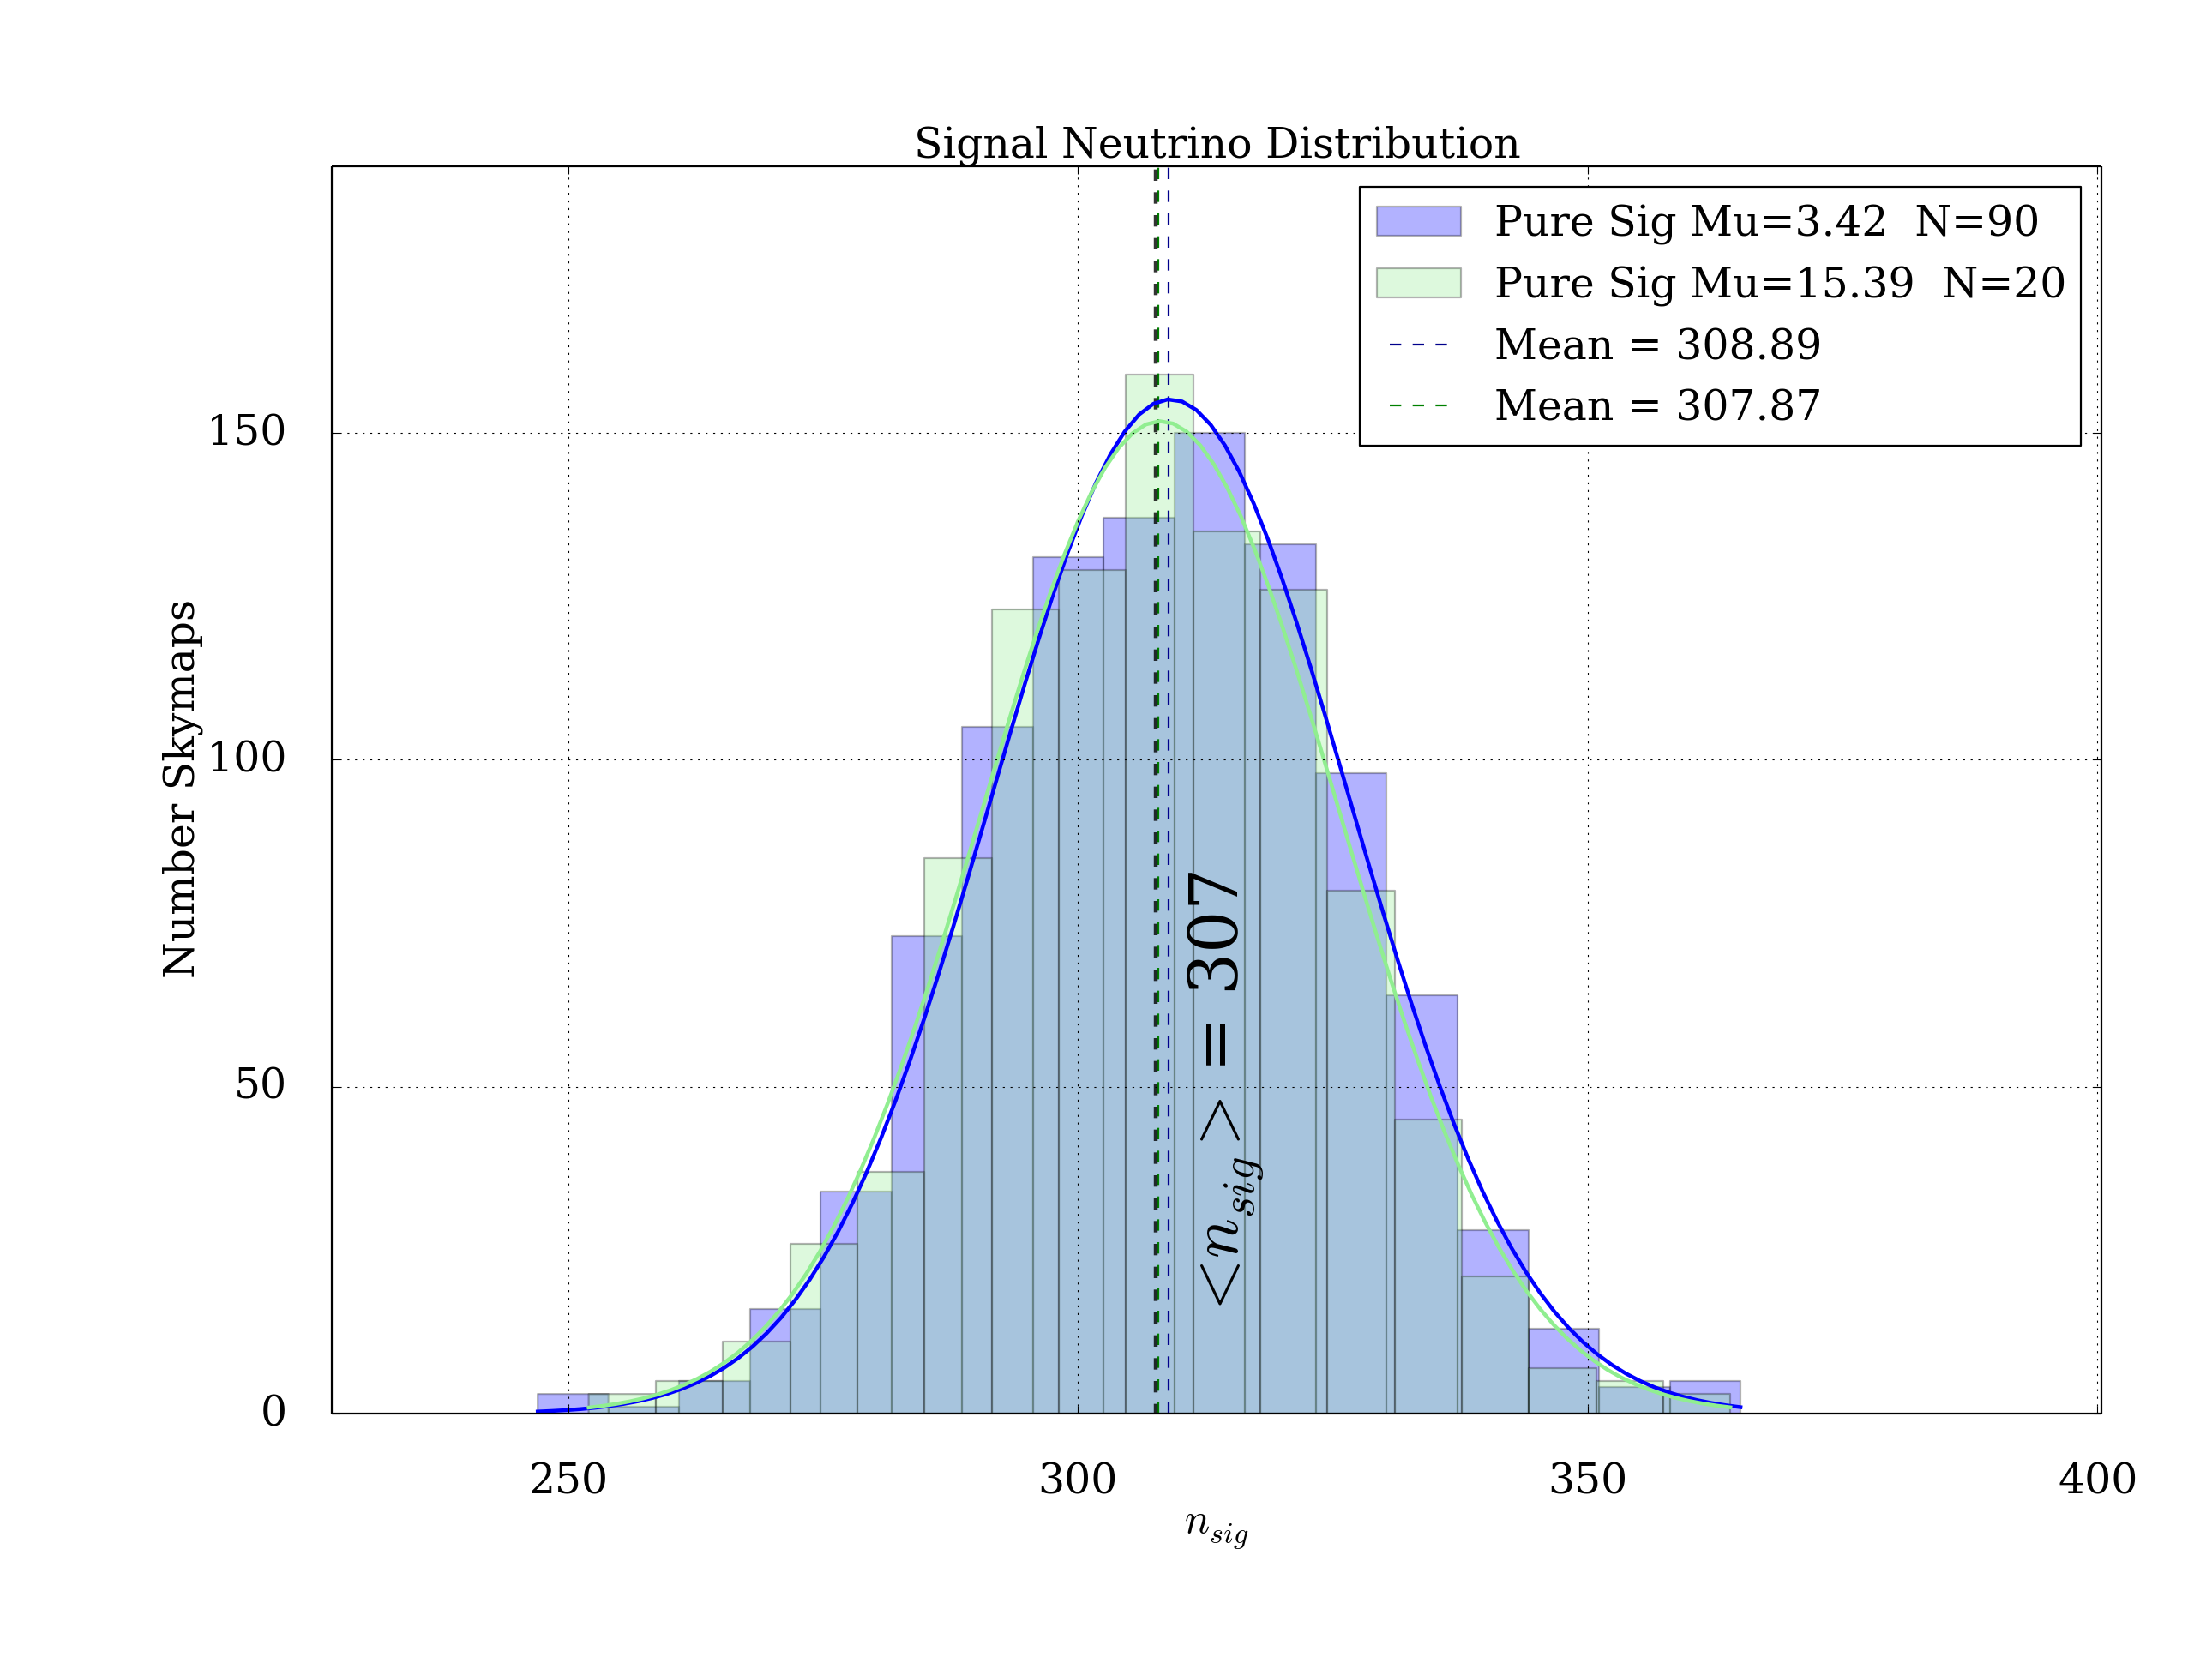
Fig. 18 Exemplary Signal Neutrino Distribution for Experimental-Like Skymaps
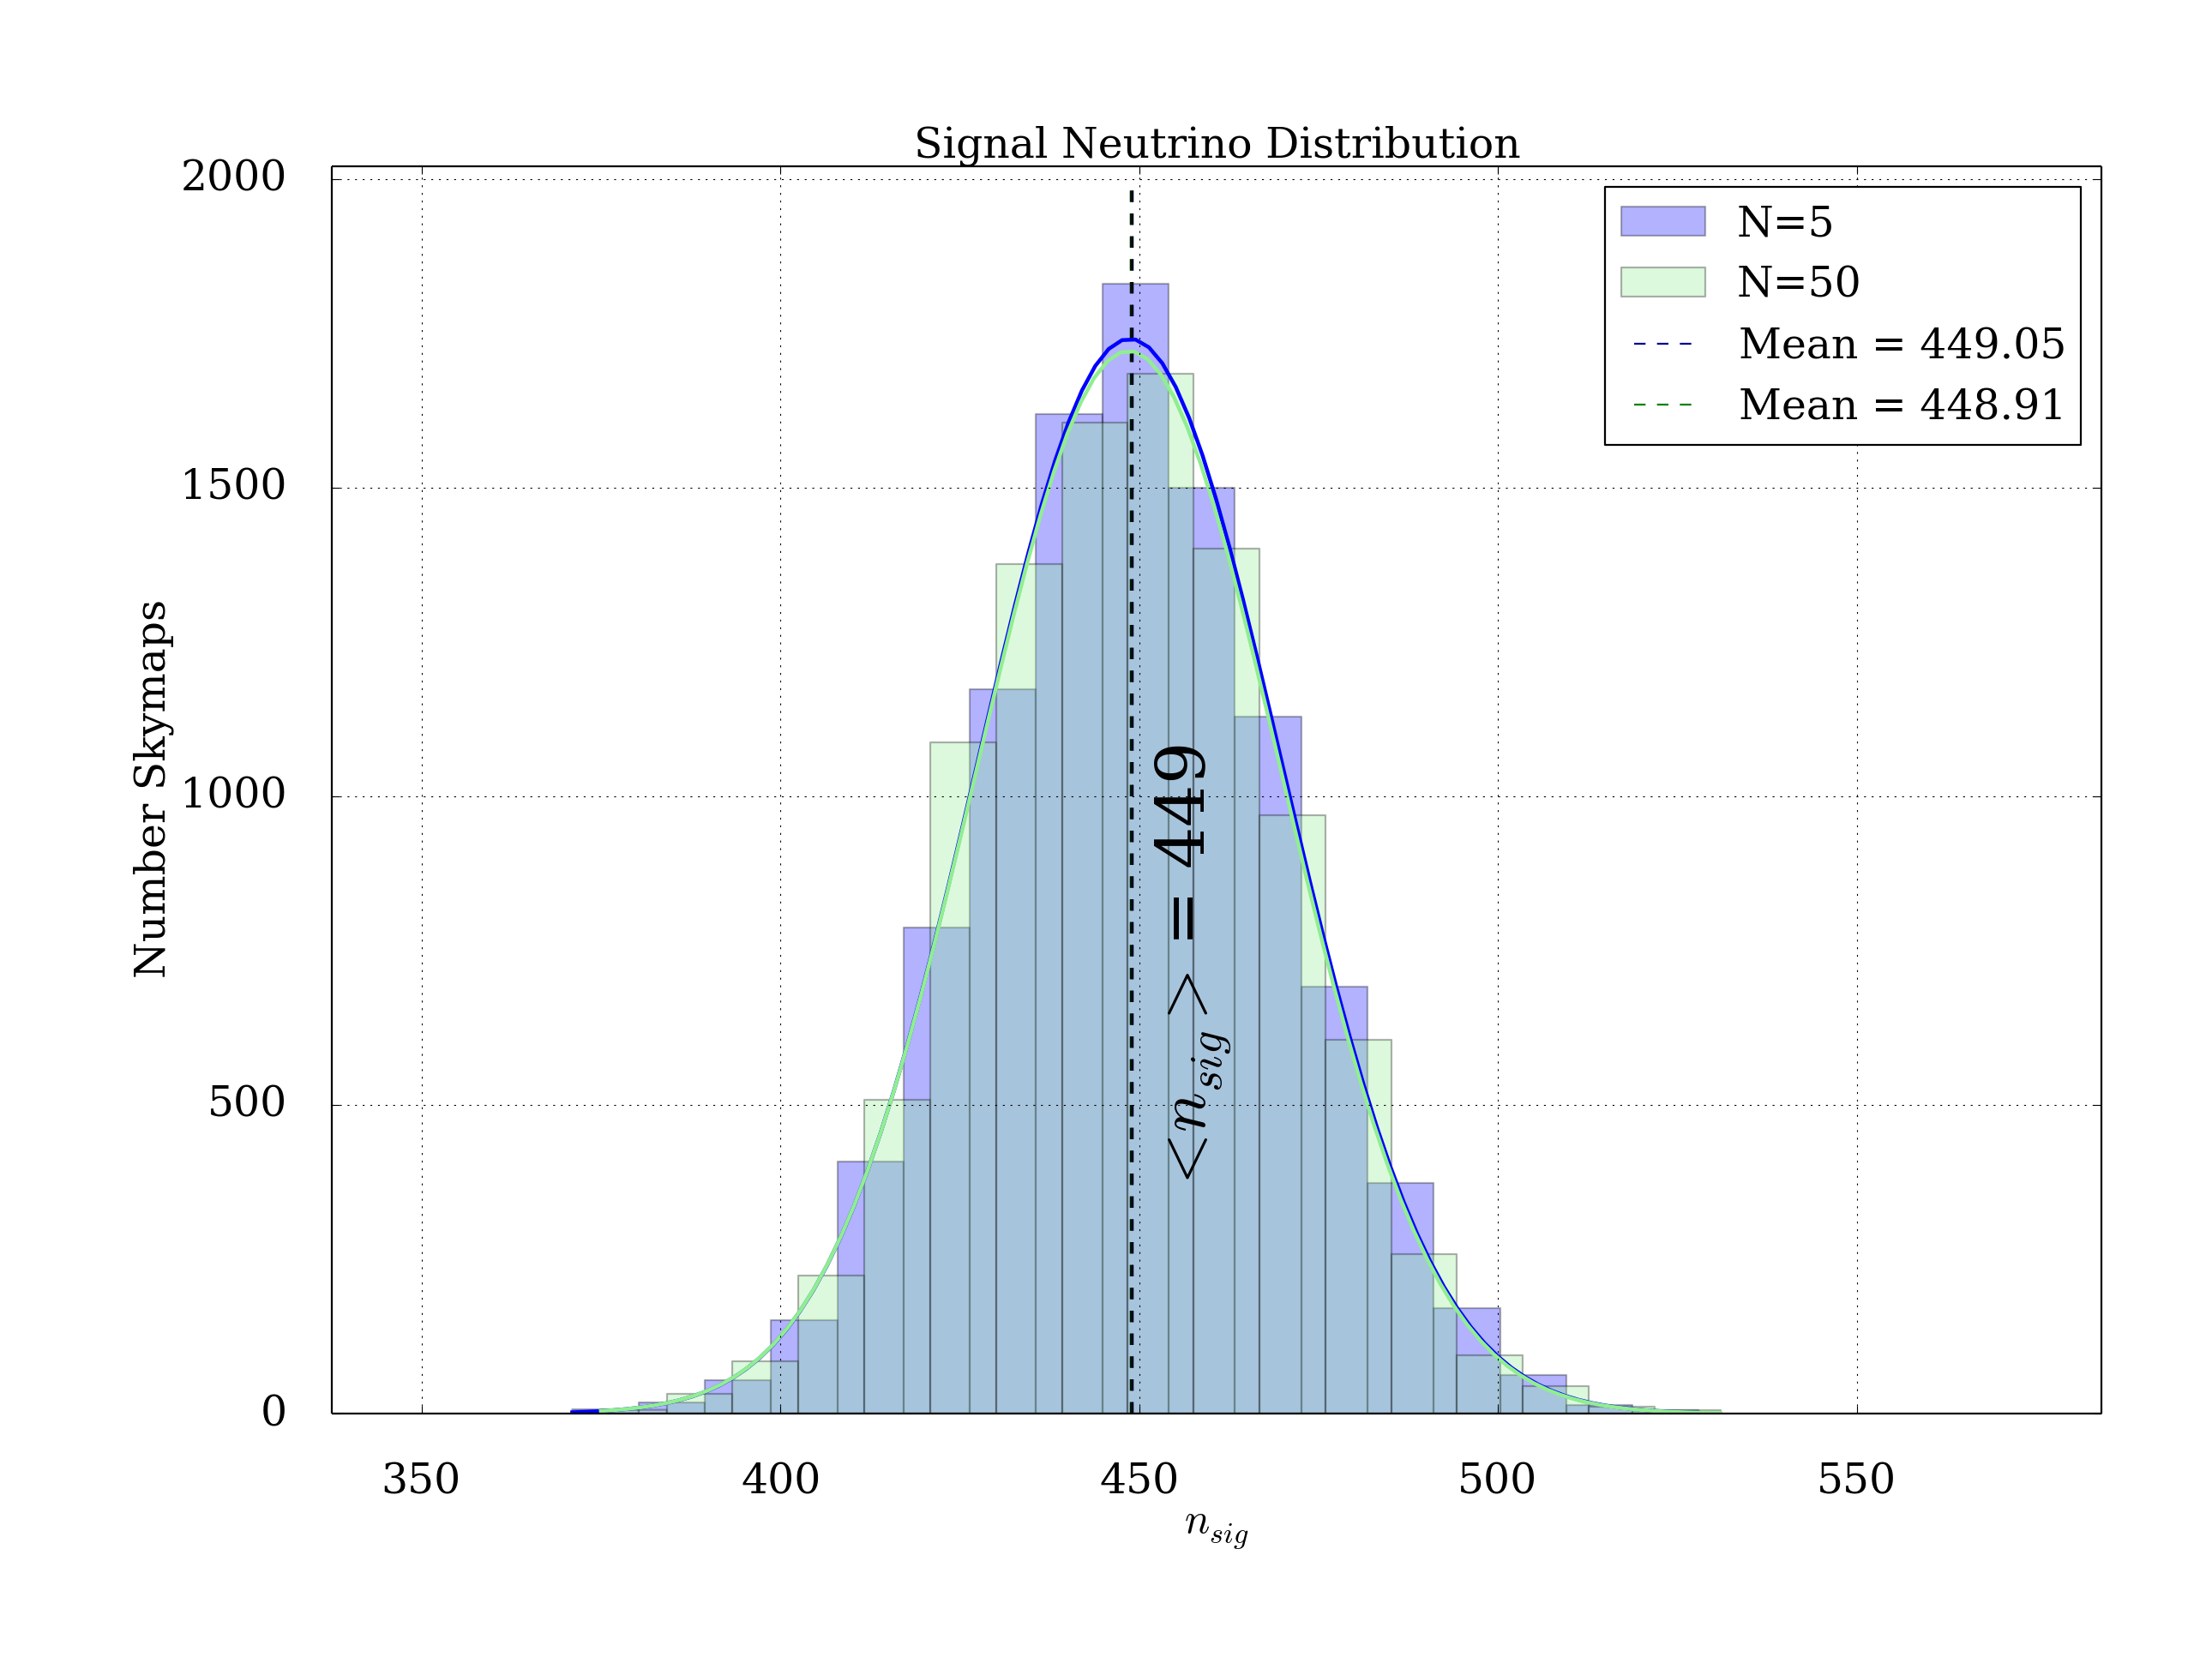
Fig. 19 Exemplary Signal Neutrino Distribution for Pure Signal Skymaps
- Zenith Distribution for the samples
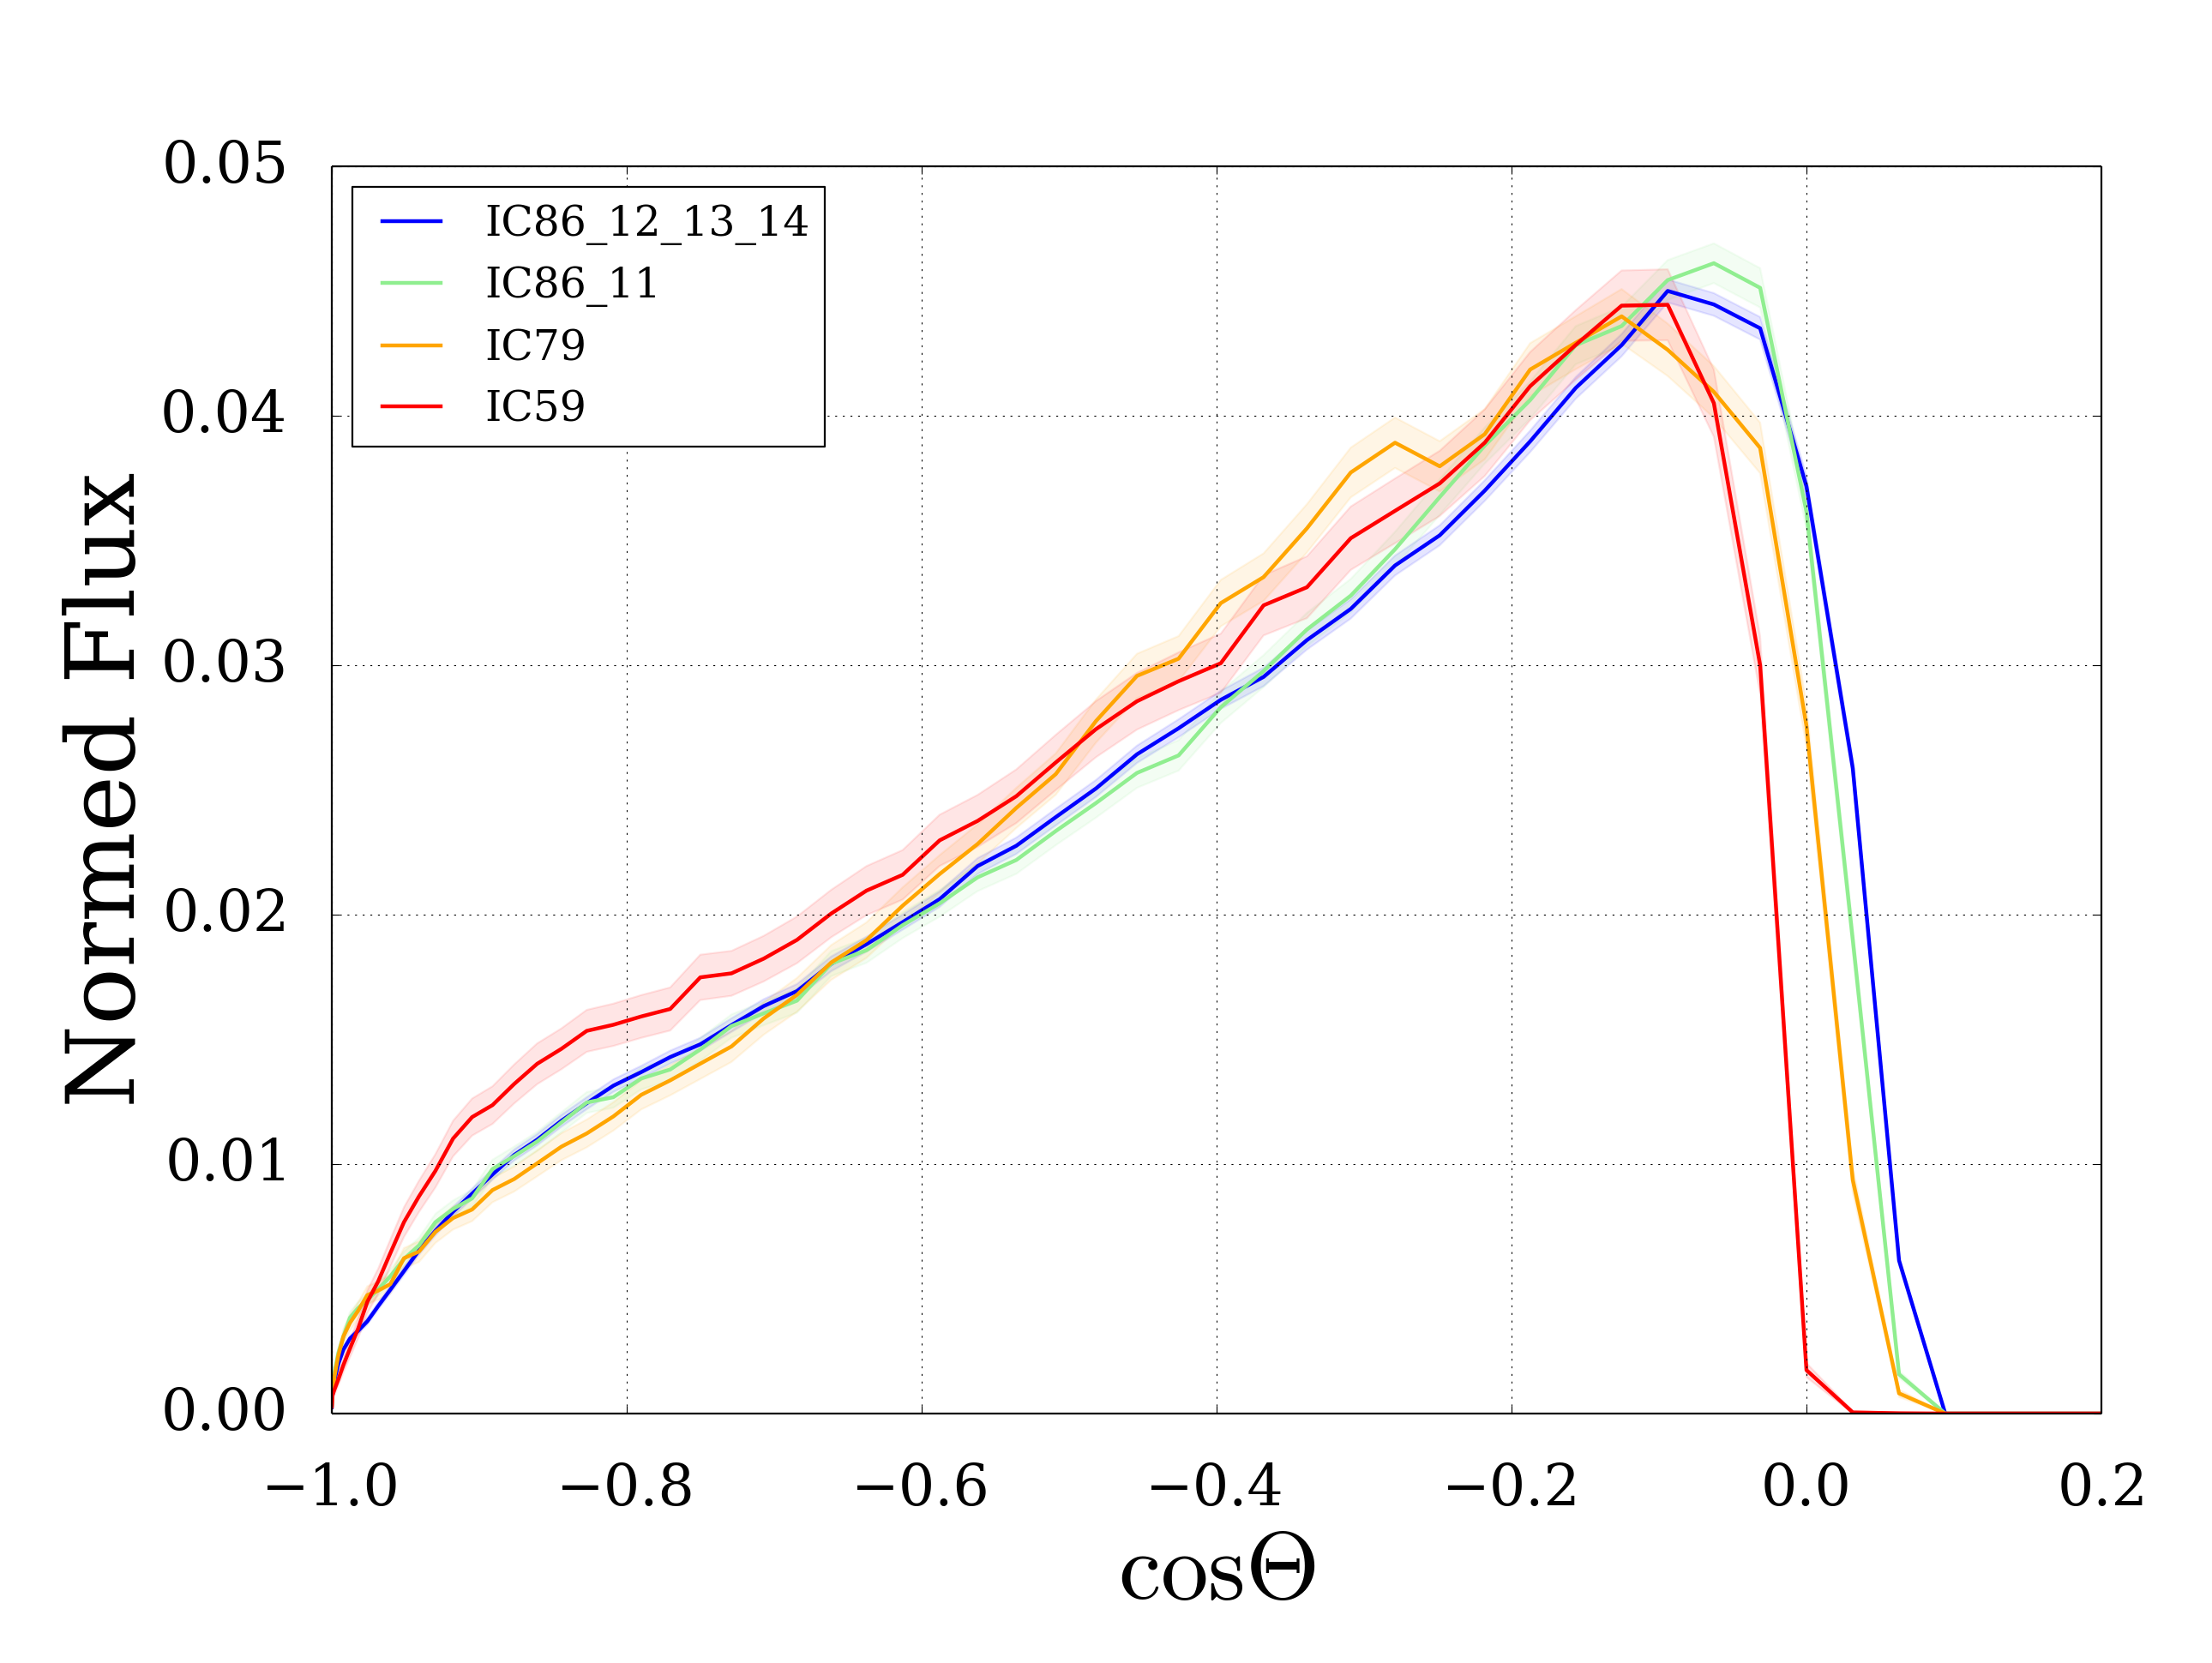
Fig. 20 Exemplary Zenith Distribution for Pure Signal Skymaps
- Energy Distribution for the samples
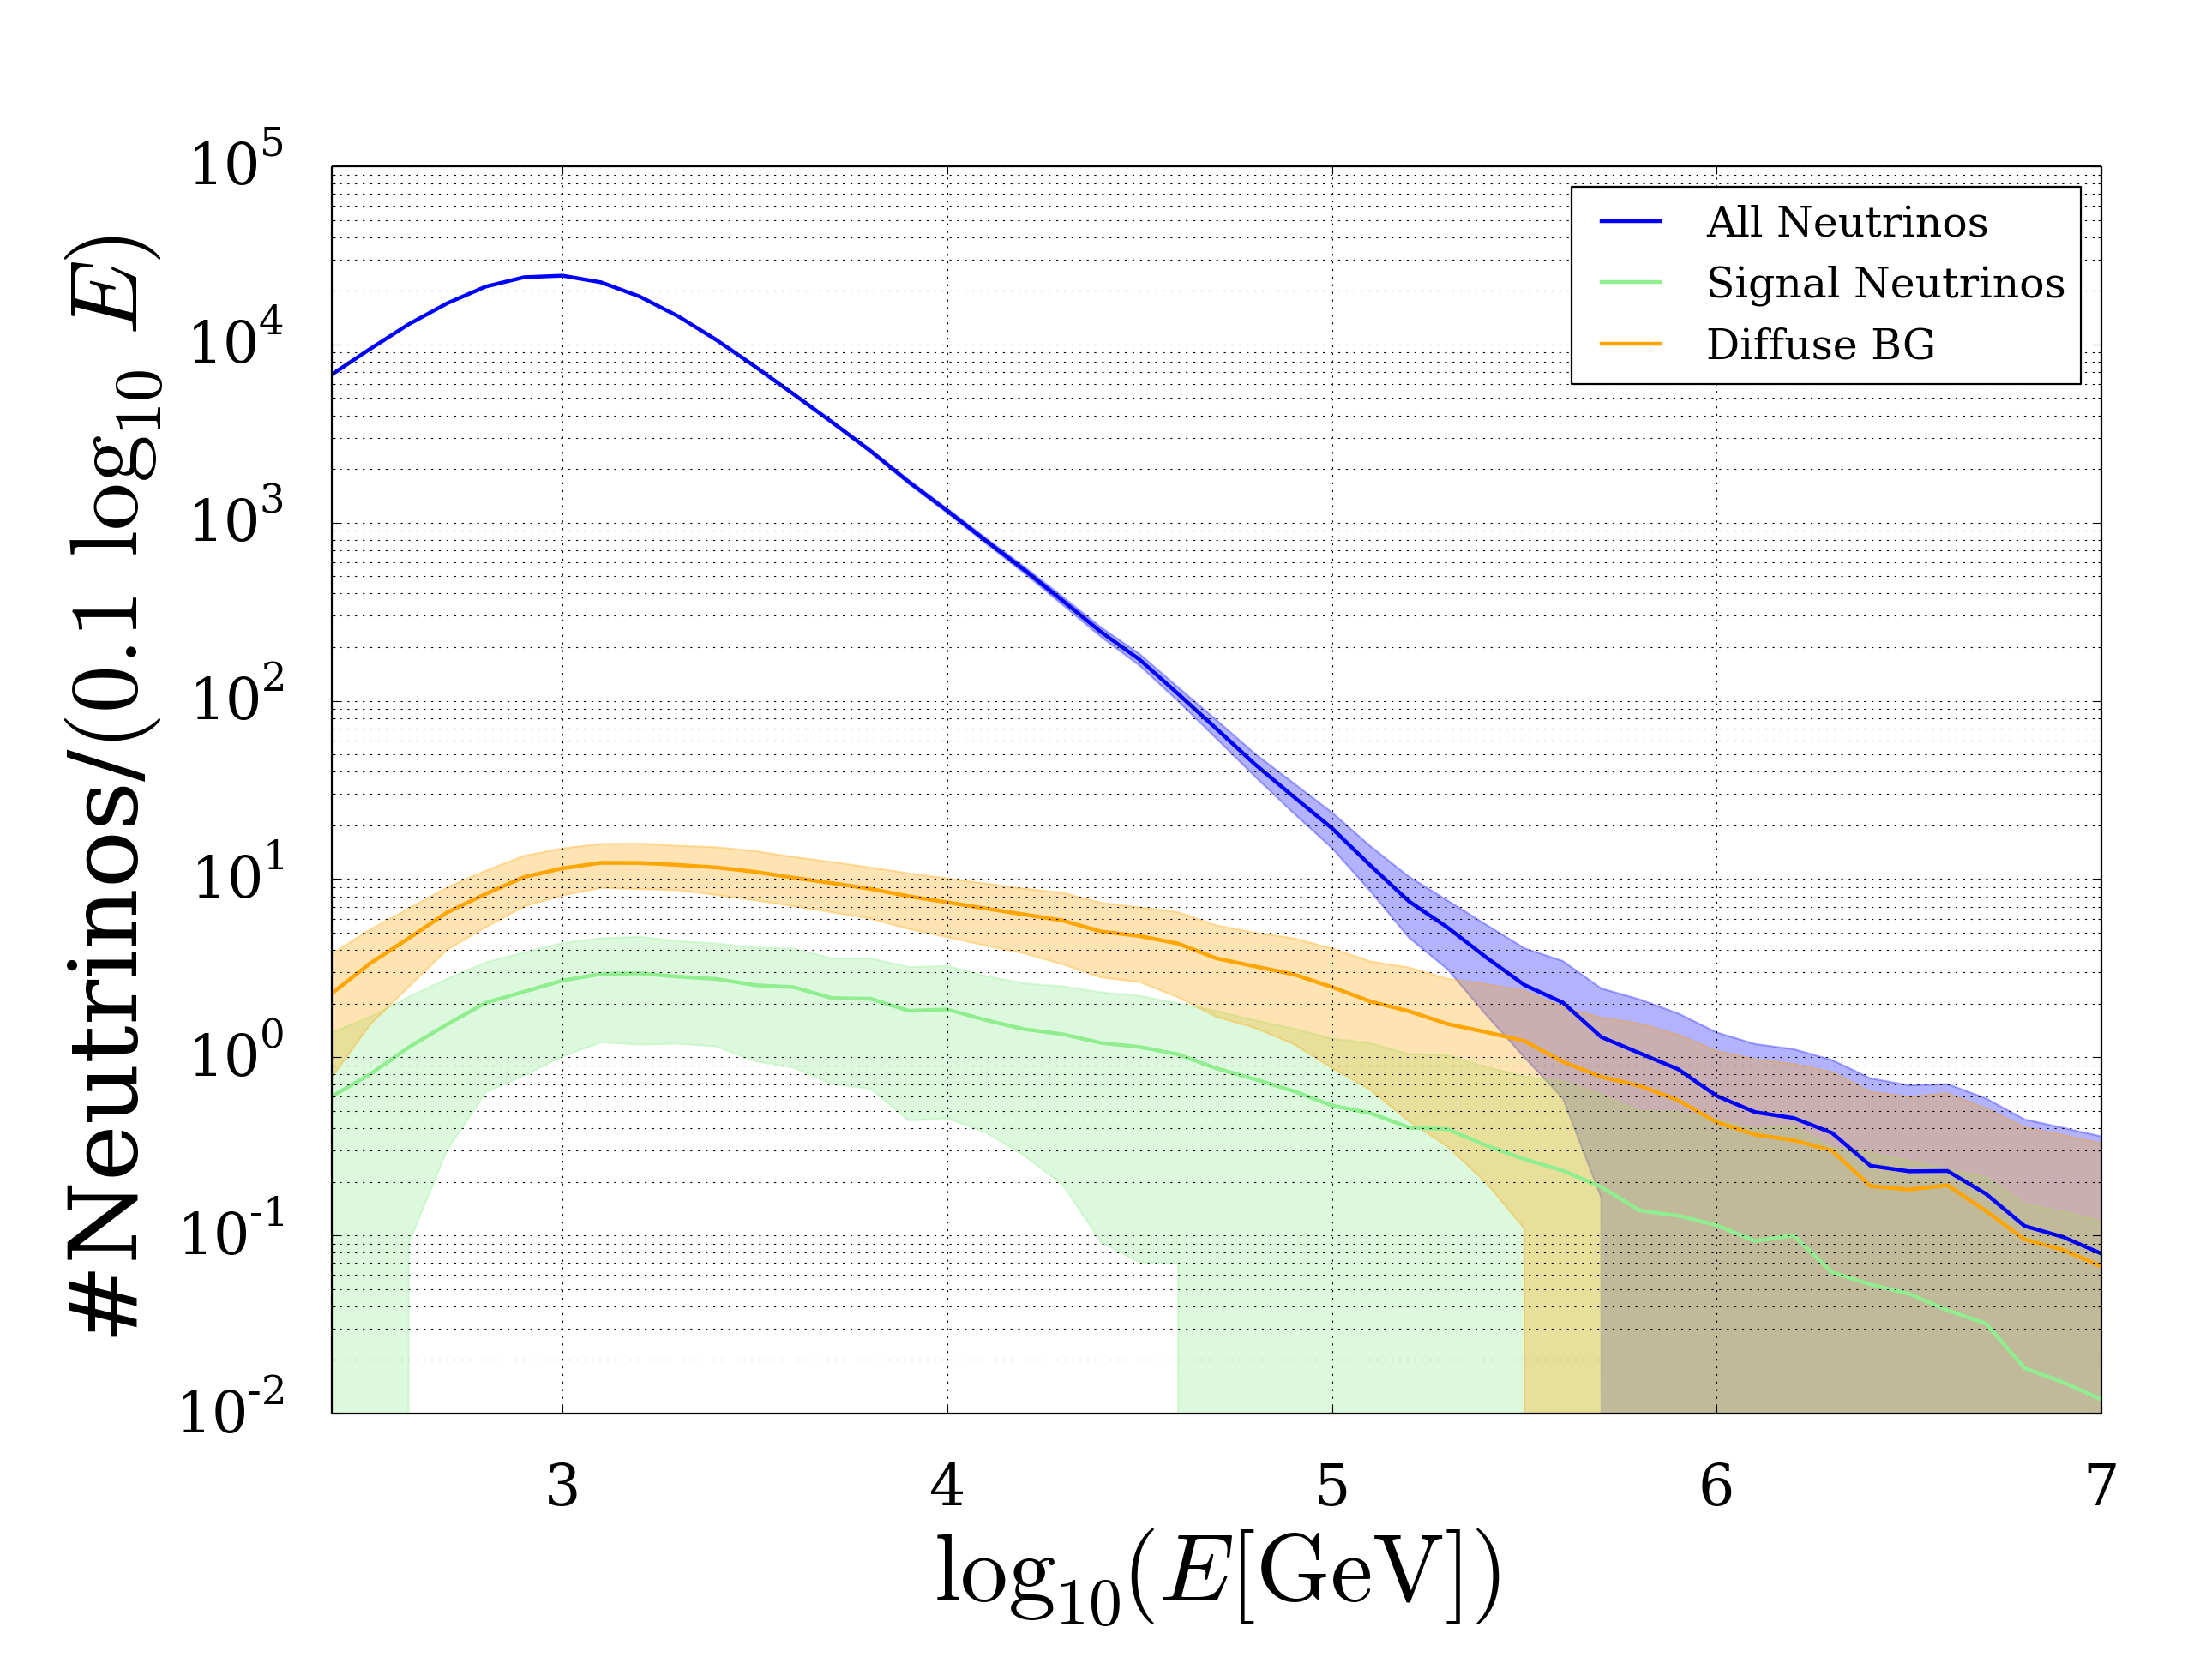
Fig. 21 Exemplary Energy Distribution for Experimental Like Skymaps in IC86 2012 13 14
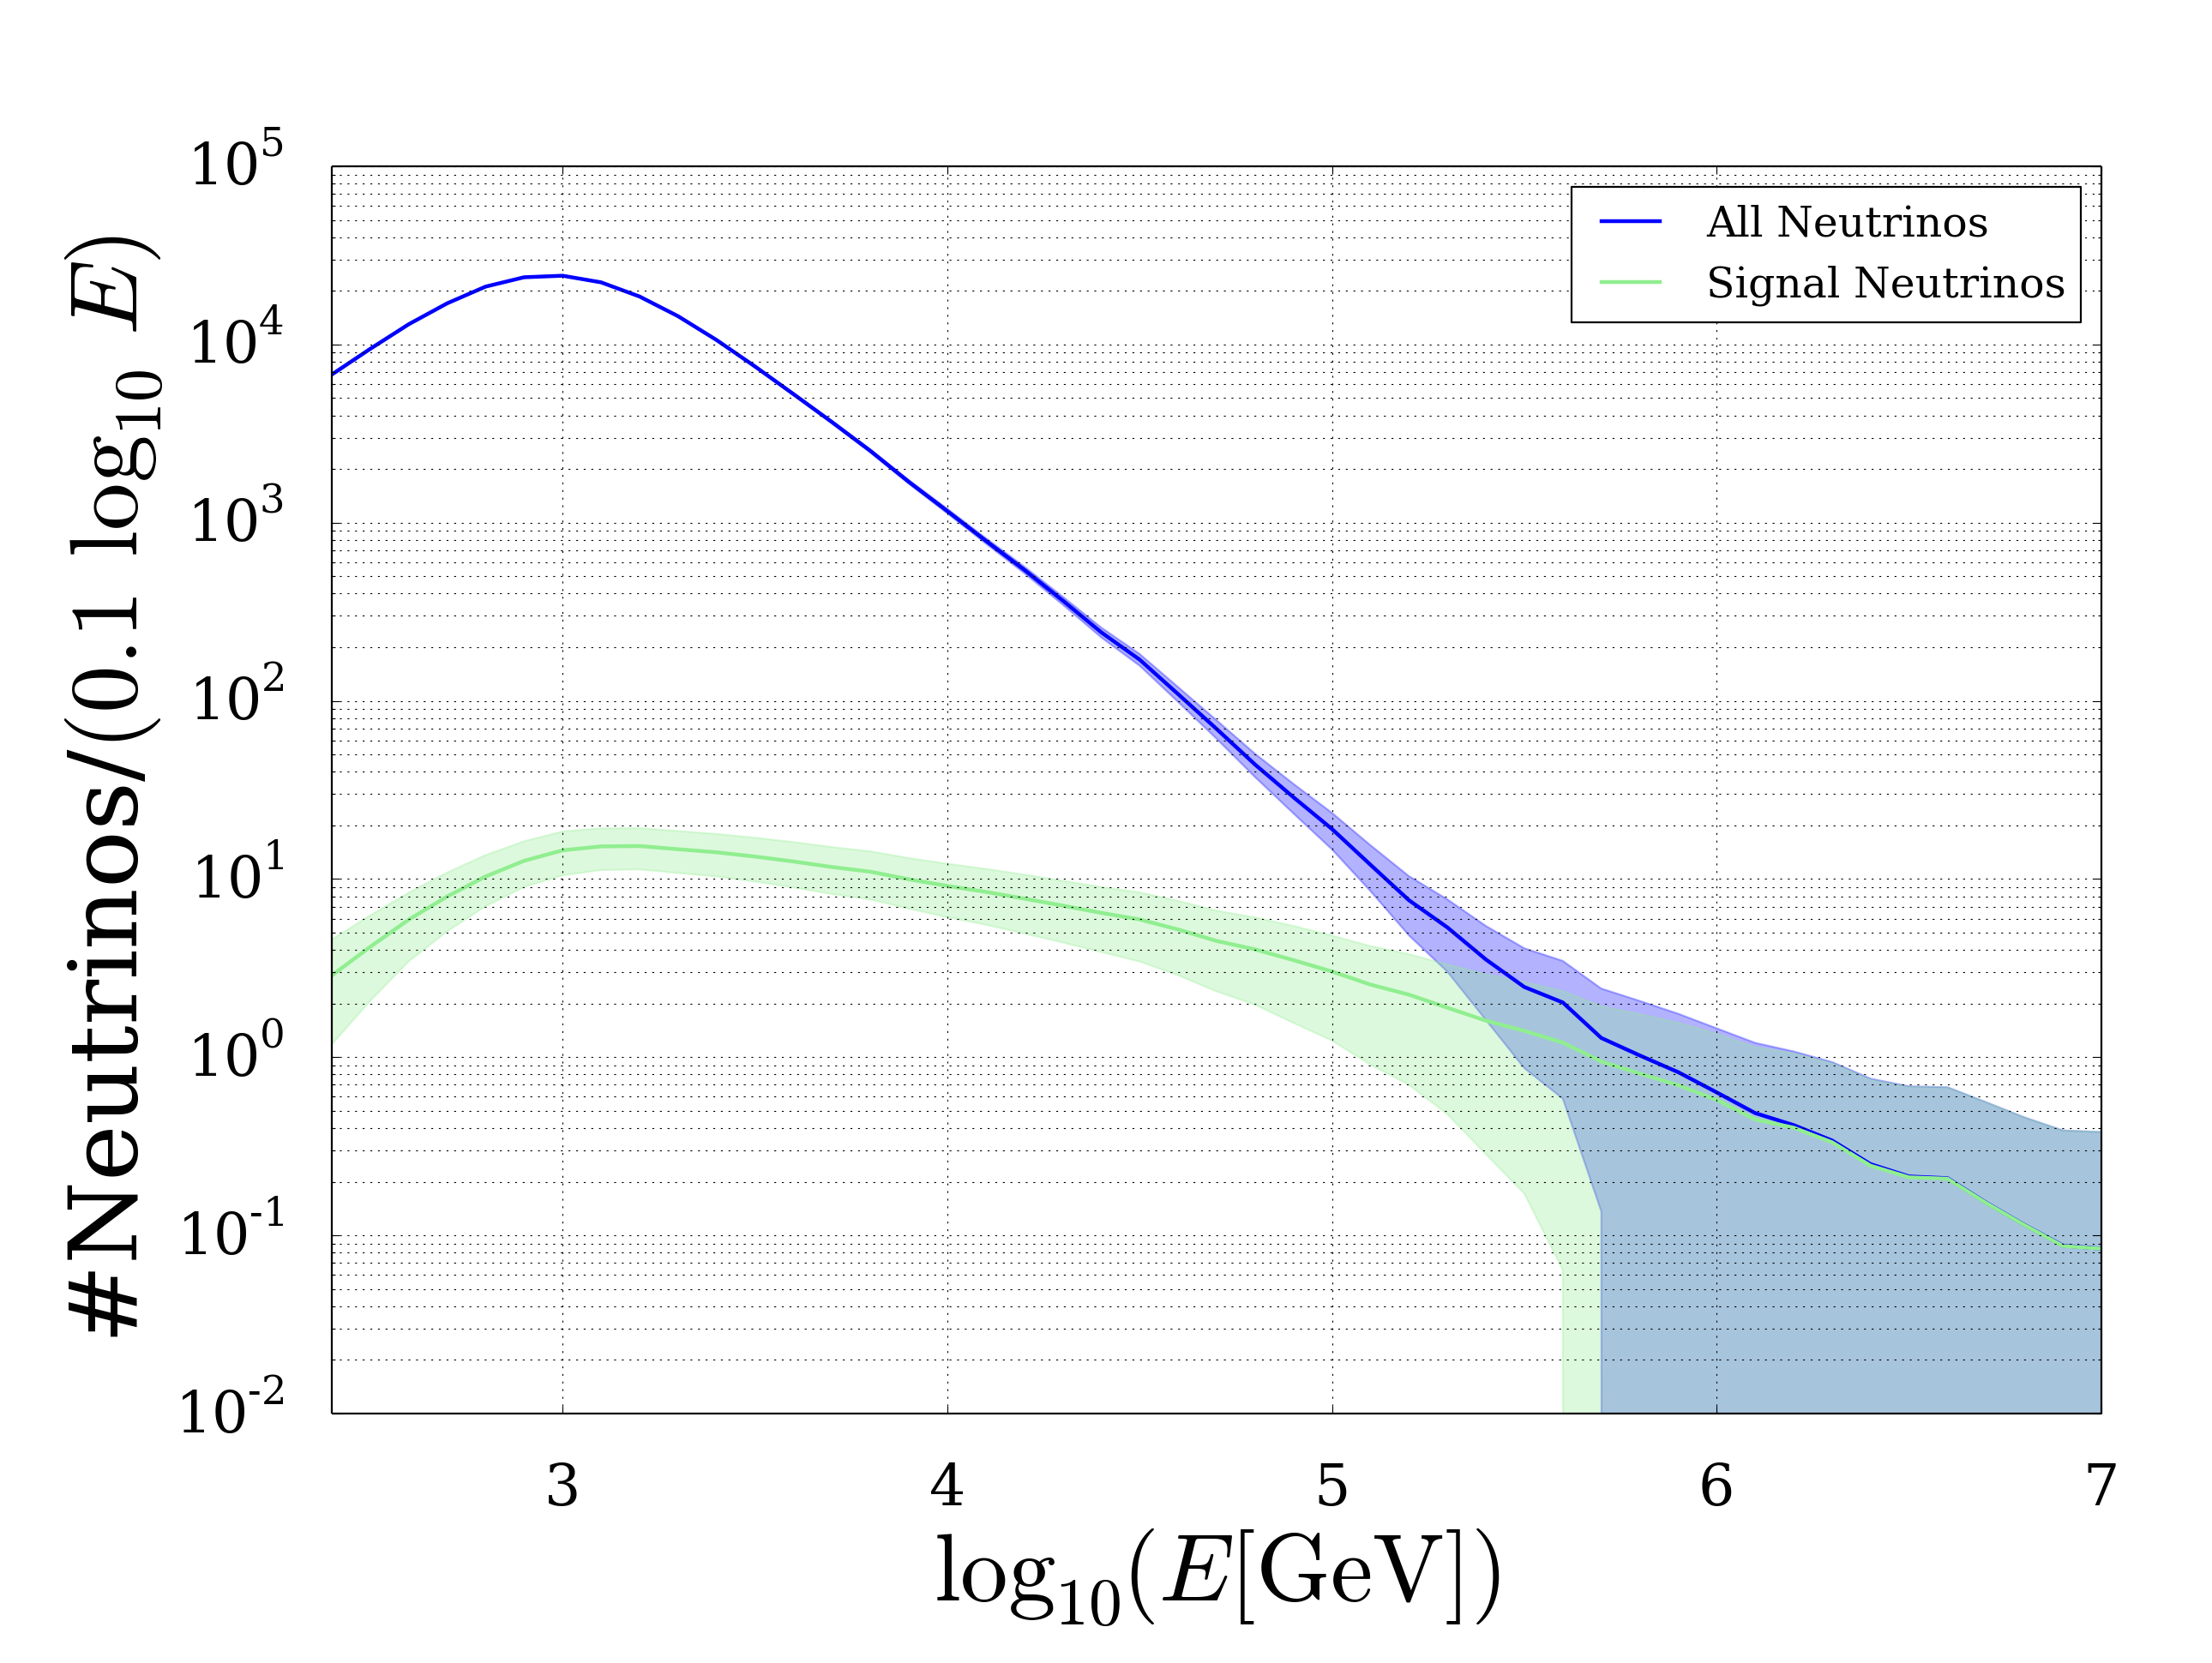
Fig. 22 Exemplary Energy Distribution for Pure Signal Skymaps in IC86 2012 13 14