Supplementary Plots and Material
This chapter is a collection of plots which are supplementary to the explanation and the plots in the other chapters.
Effective Area
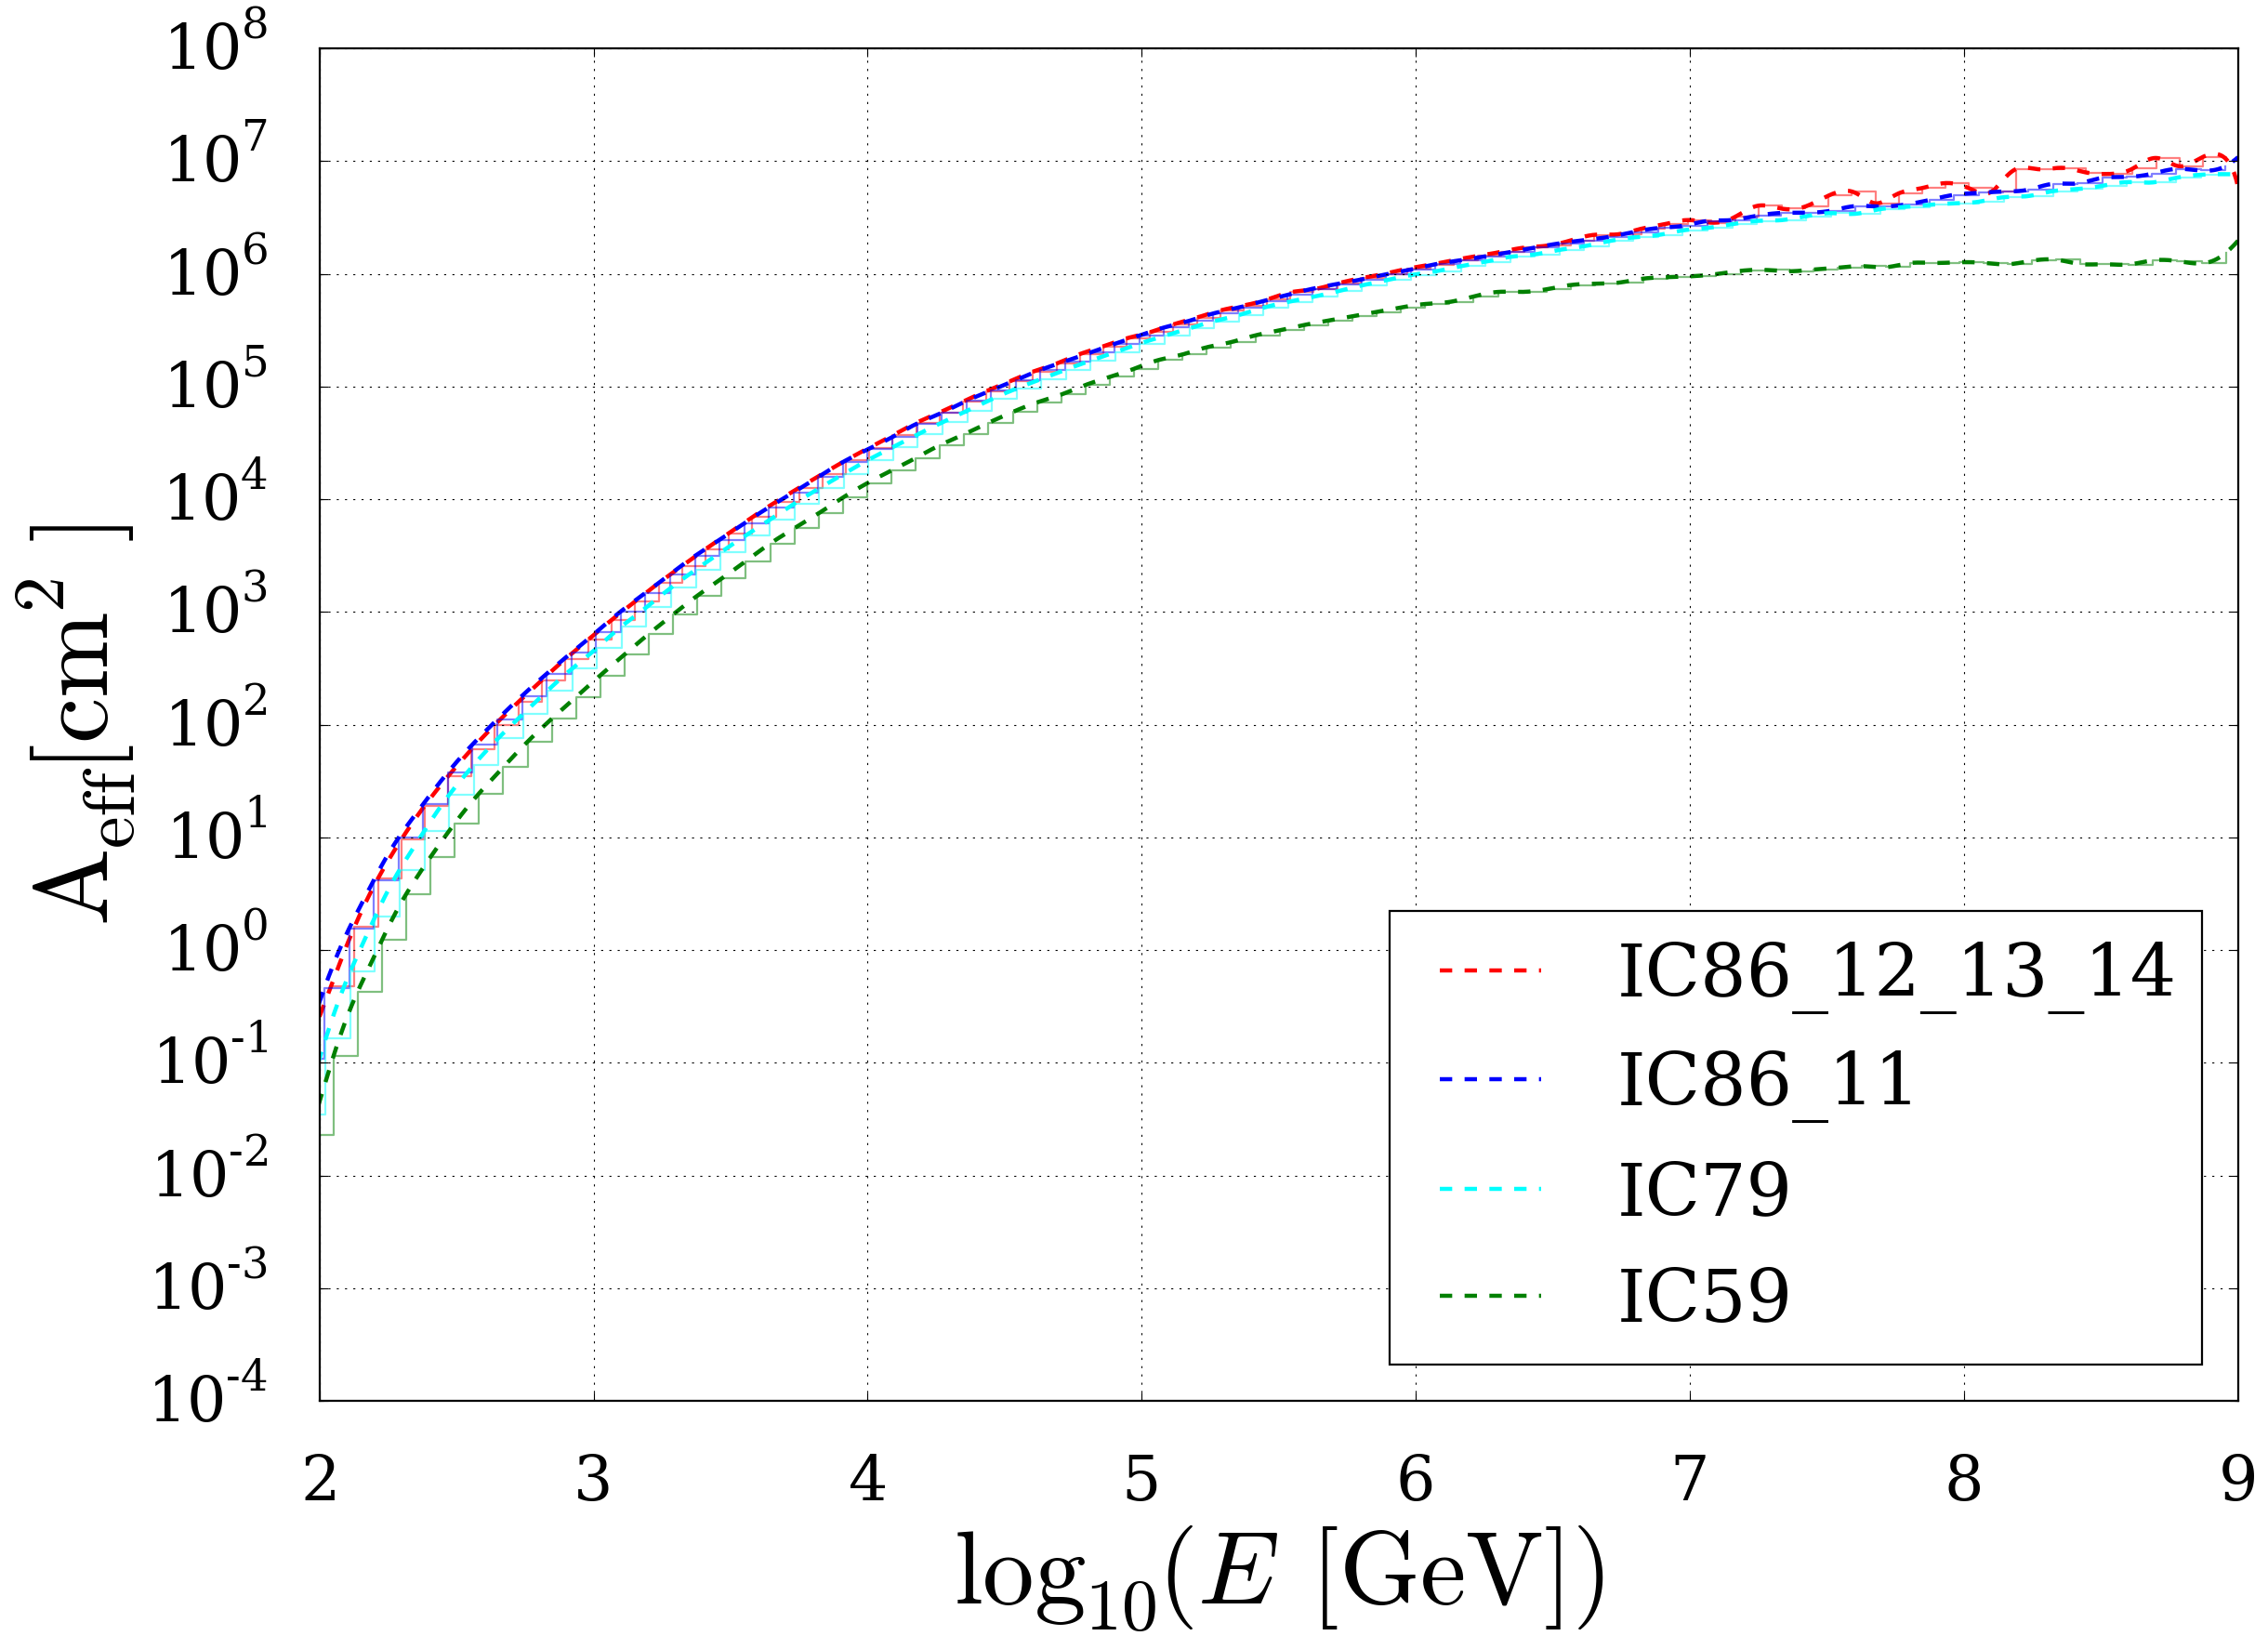
Fig. 27 The effective area \(A_{eff}\) in dependency of the energy assuming an astrophysical spectral index of \(\gamma=2.13\)
Significance Plots
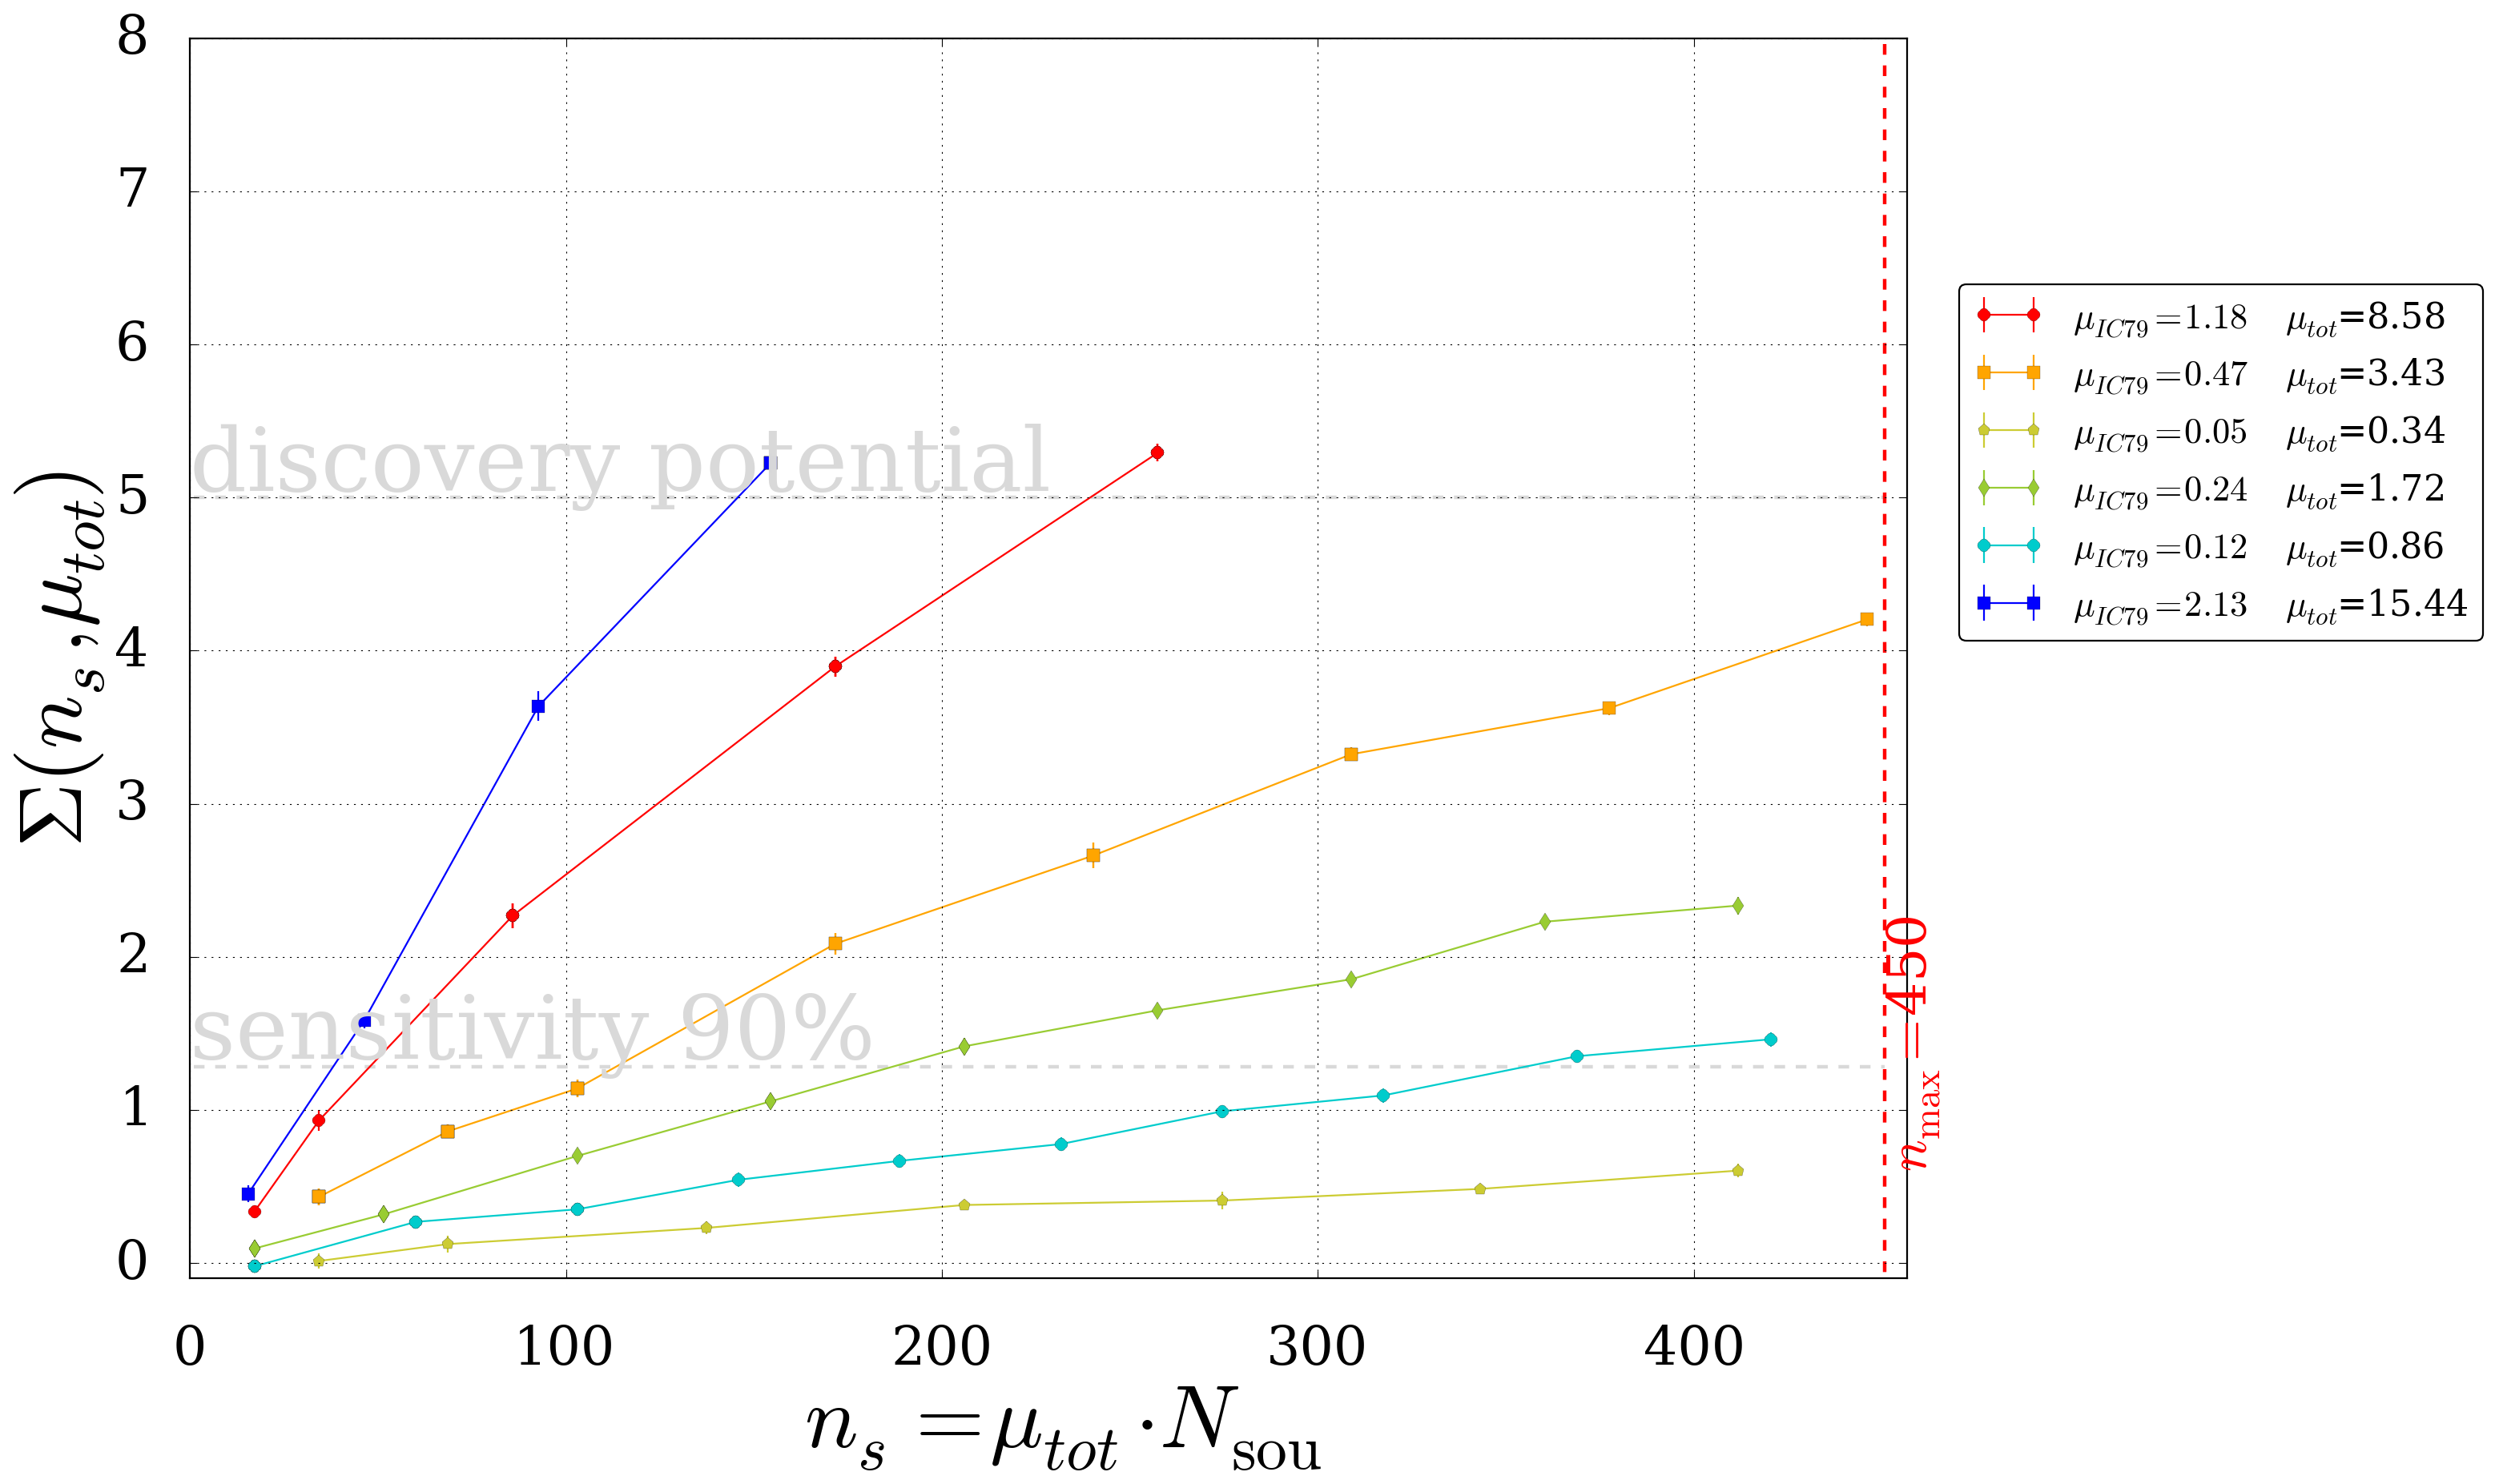
Fig. 28 Significance Plot for \(\gamma=2.13\)
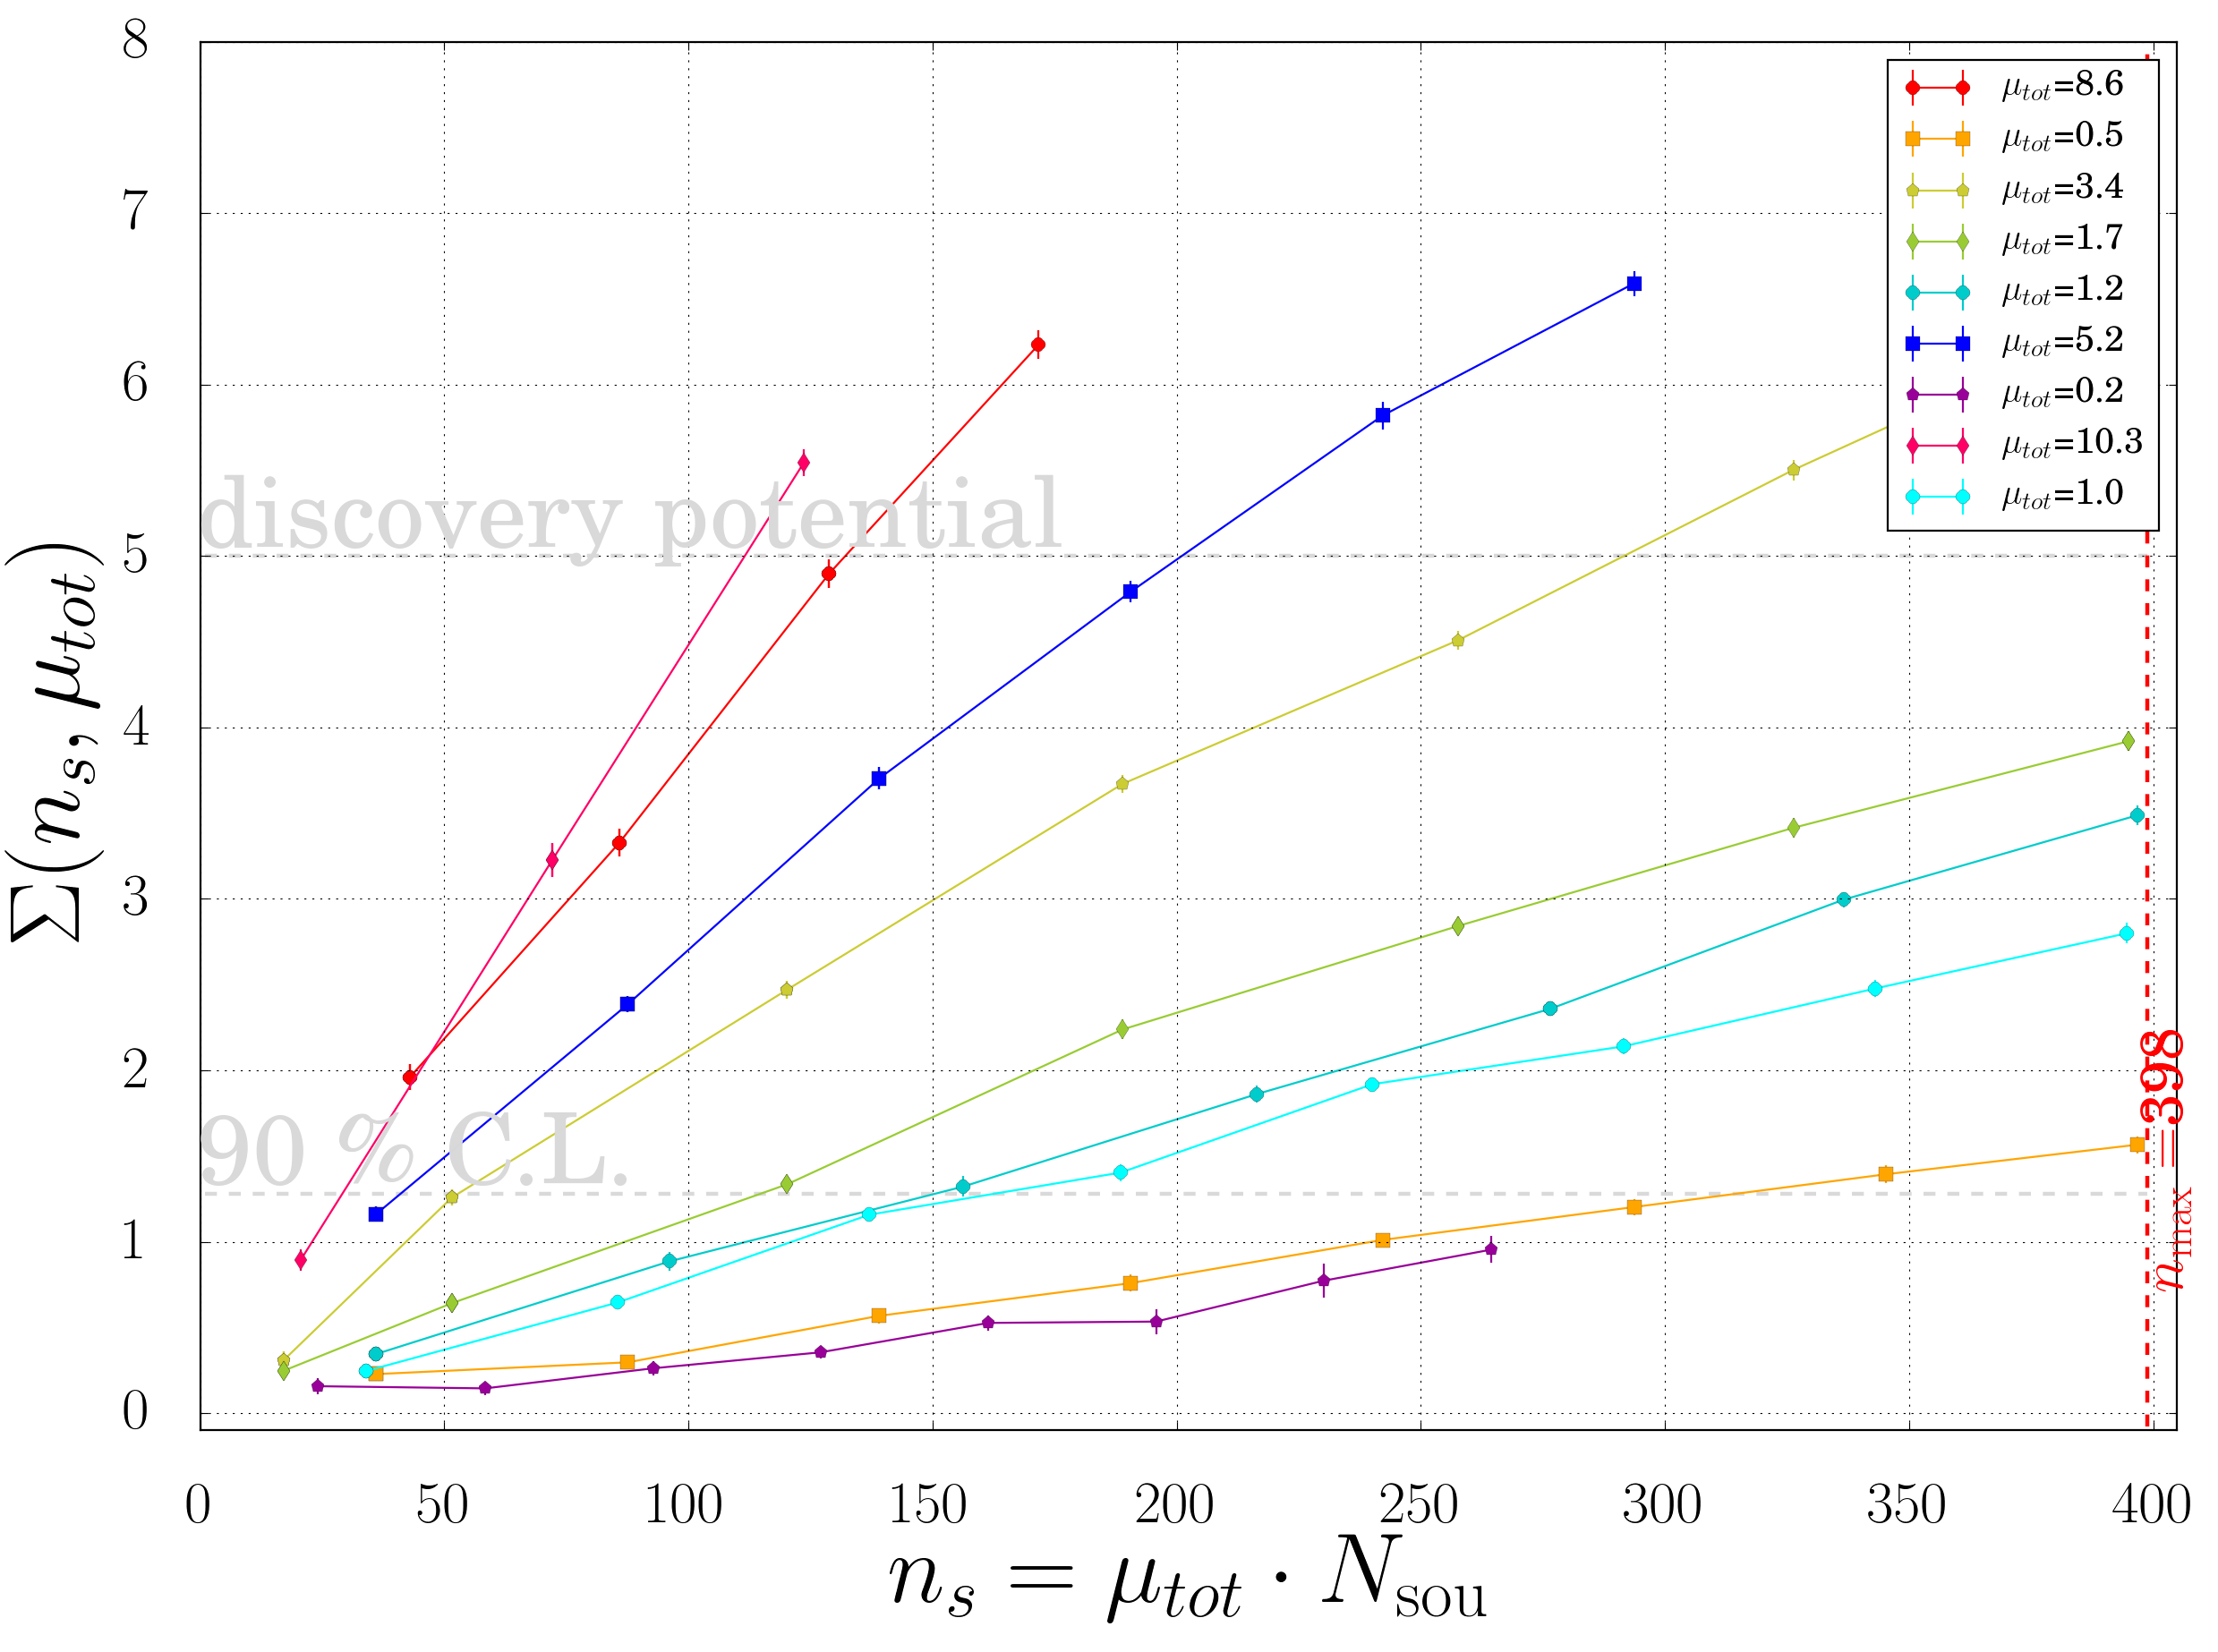
Fig. 29 Significance Plot for \(\gamma=2.0\)
Power-Spectrum Distribution
Shown is the power spectrum for pure signal maps (all events clustered). Hence for small \(N_{Sou}\) the corresponding \(\mu\) is pretty large.
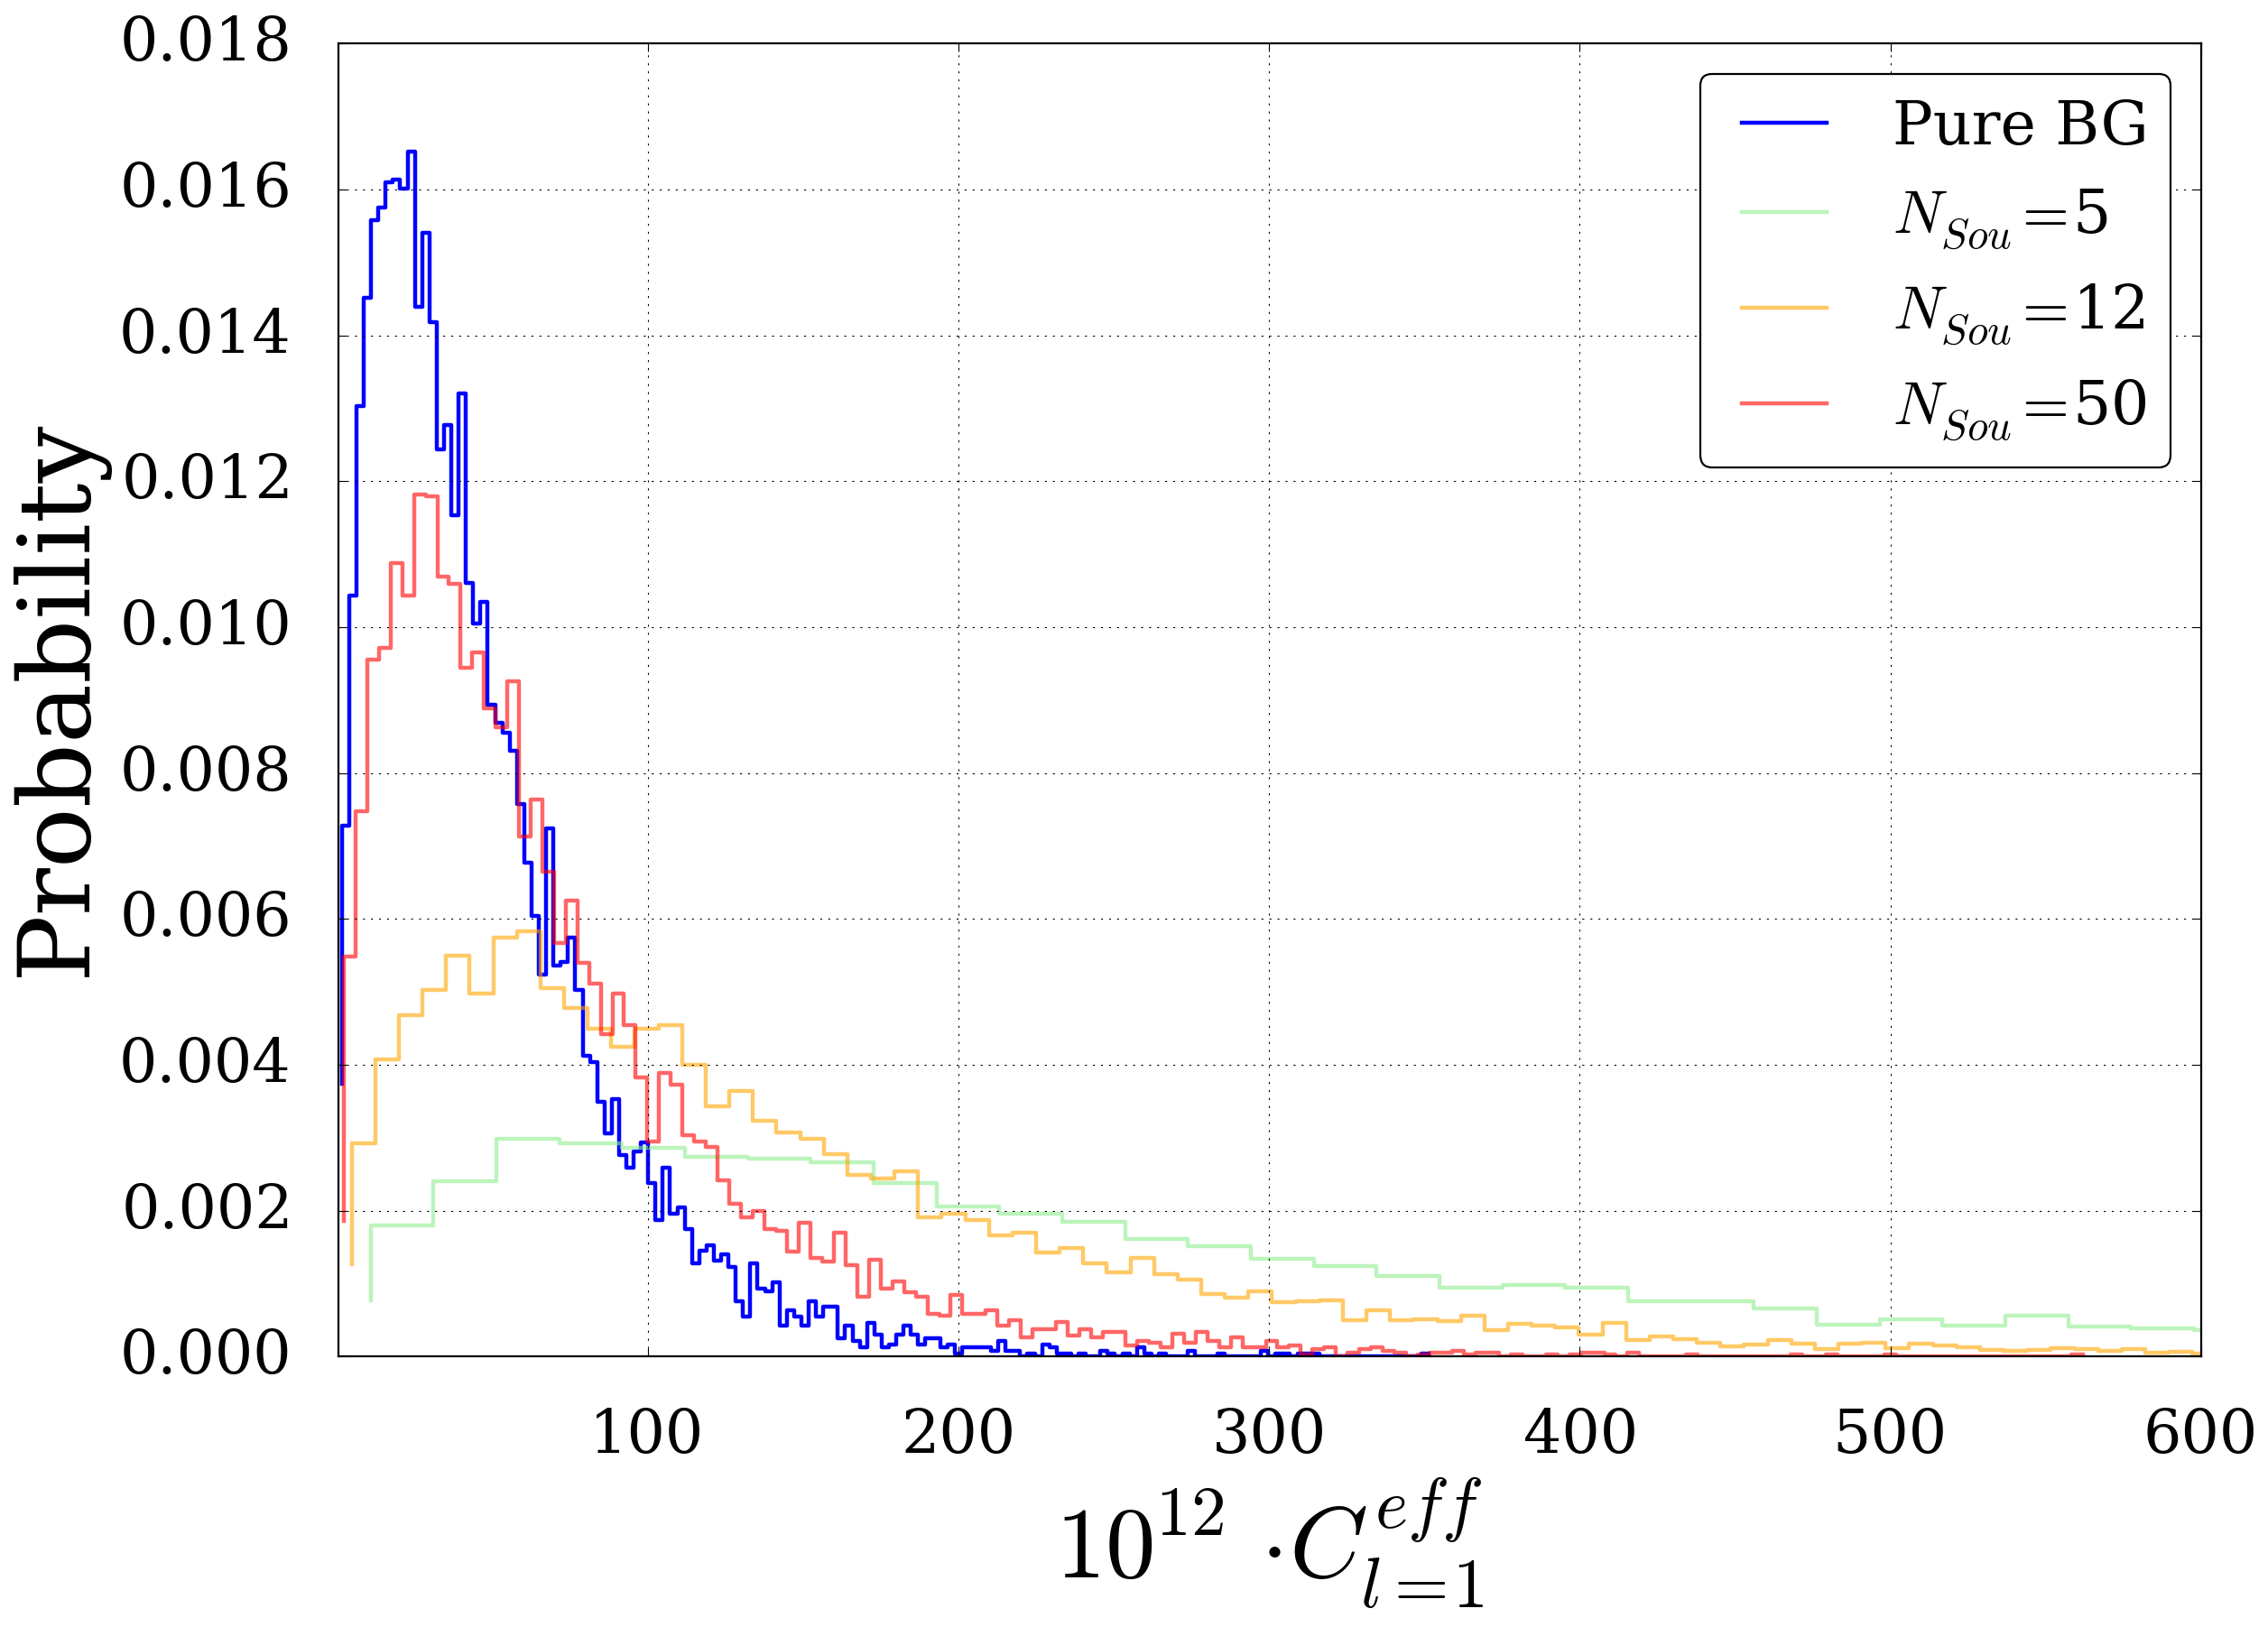
Fig. 30 The probability distribution of the power spectra for l=1
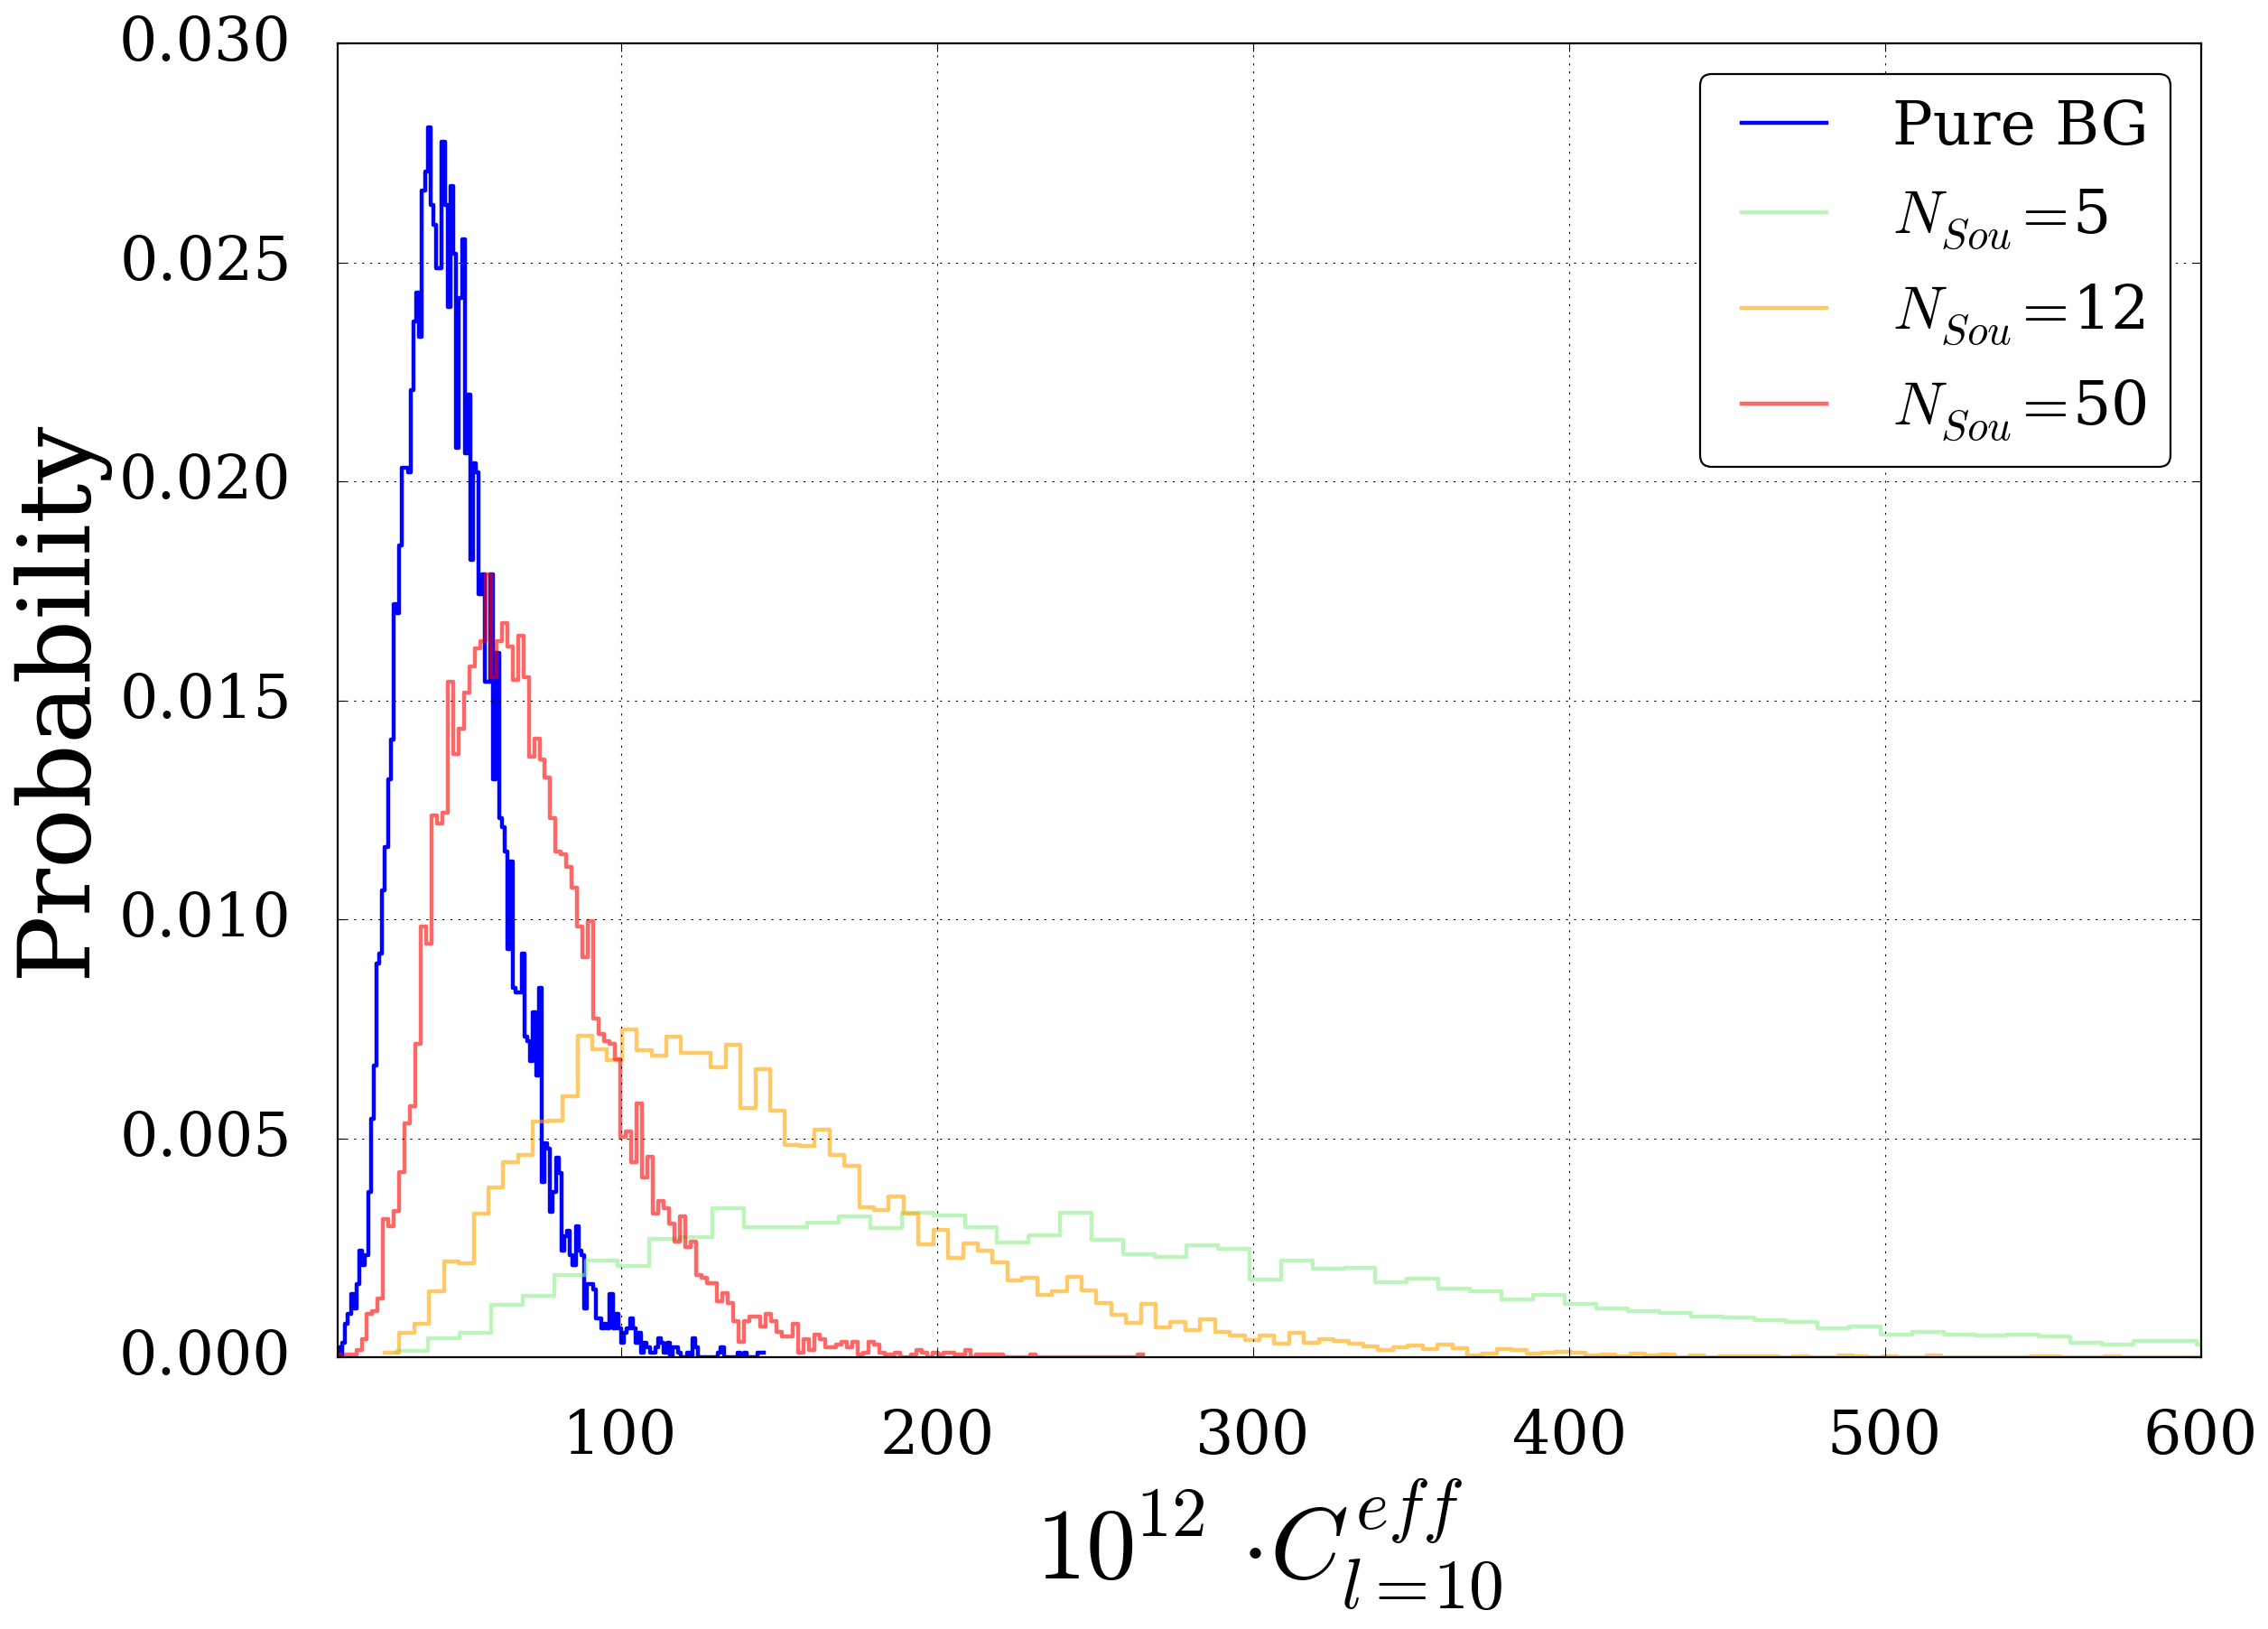
Fig. 31 The probability distribution of the power spectra for l=10
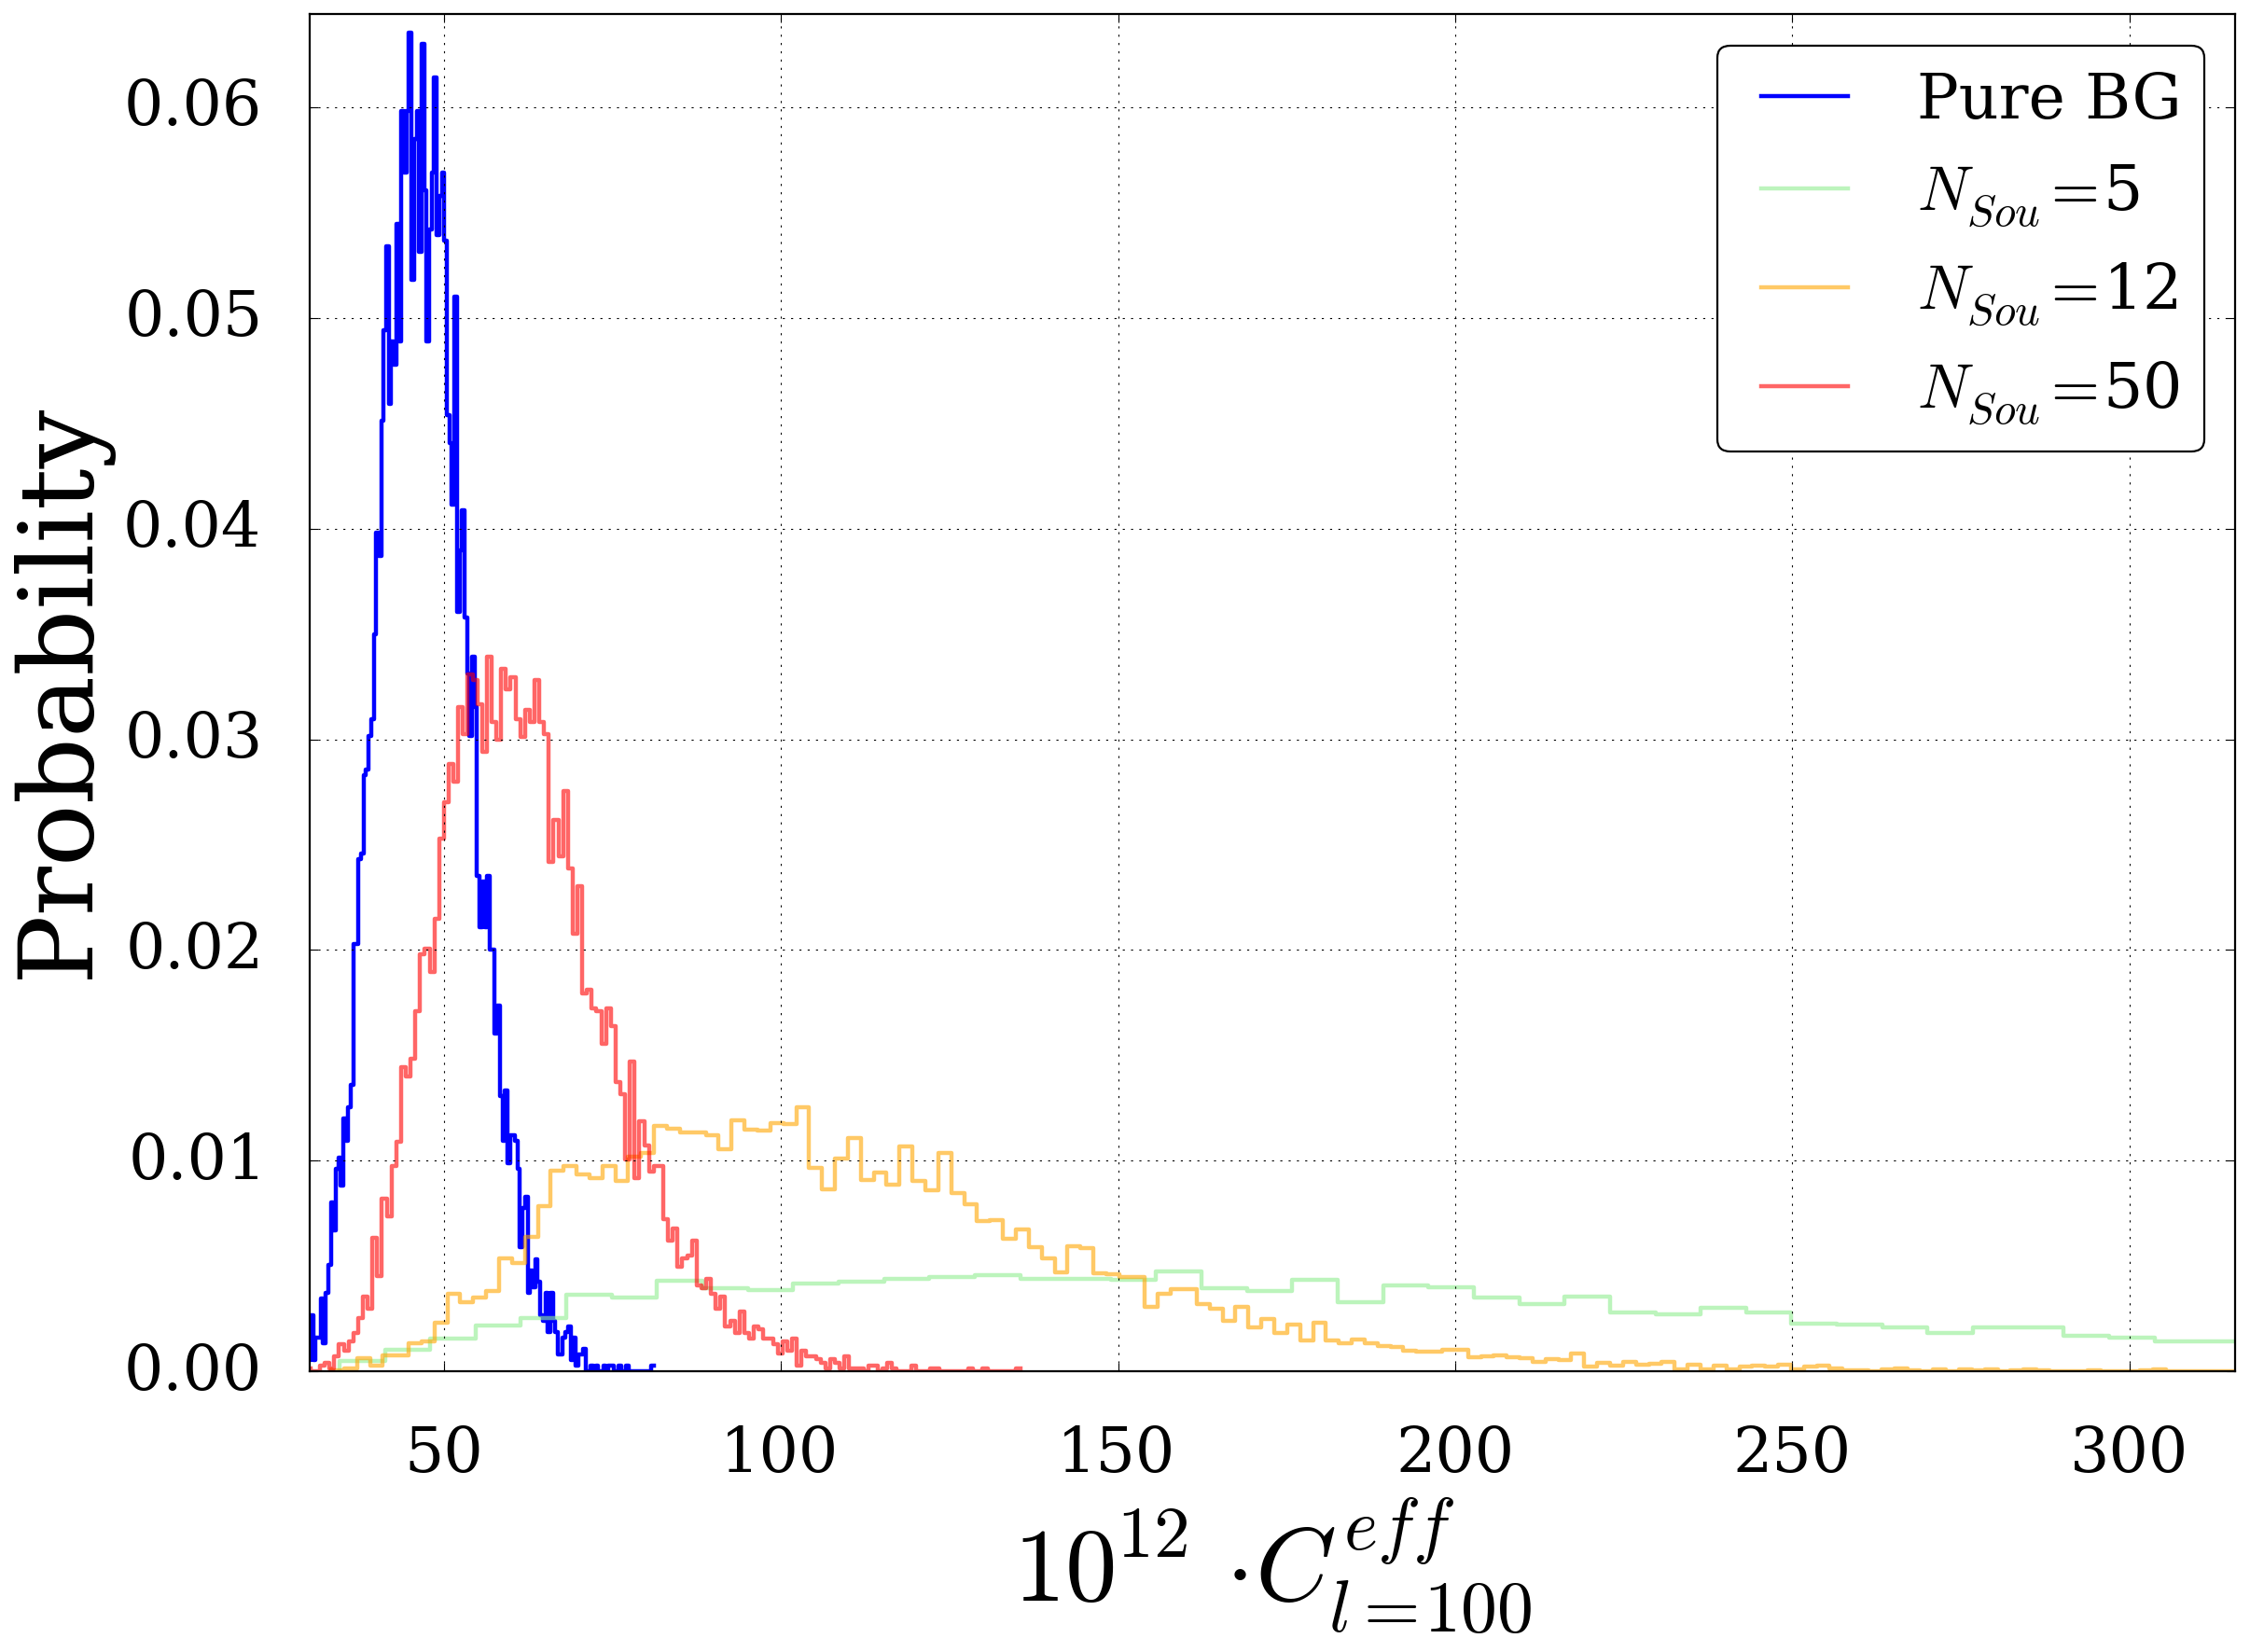
Fig. 32 The probability distribution of the power spectra for l=100
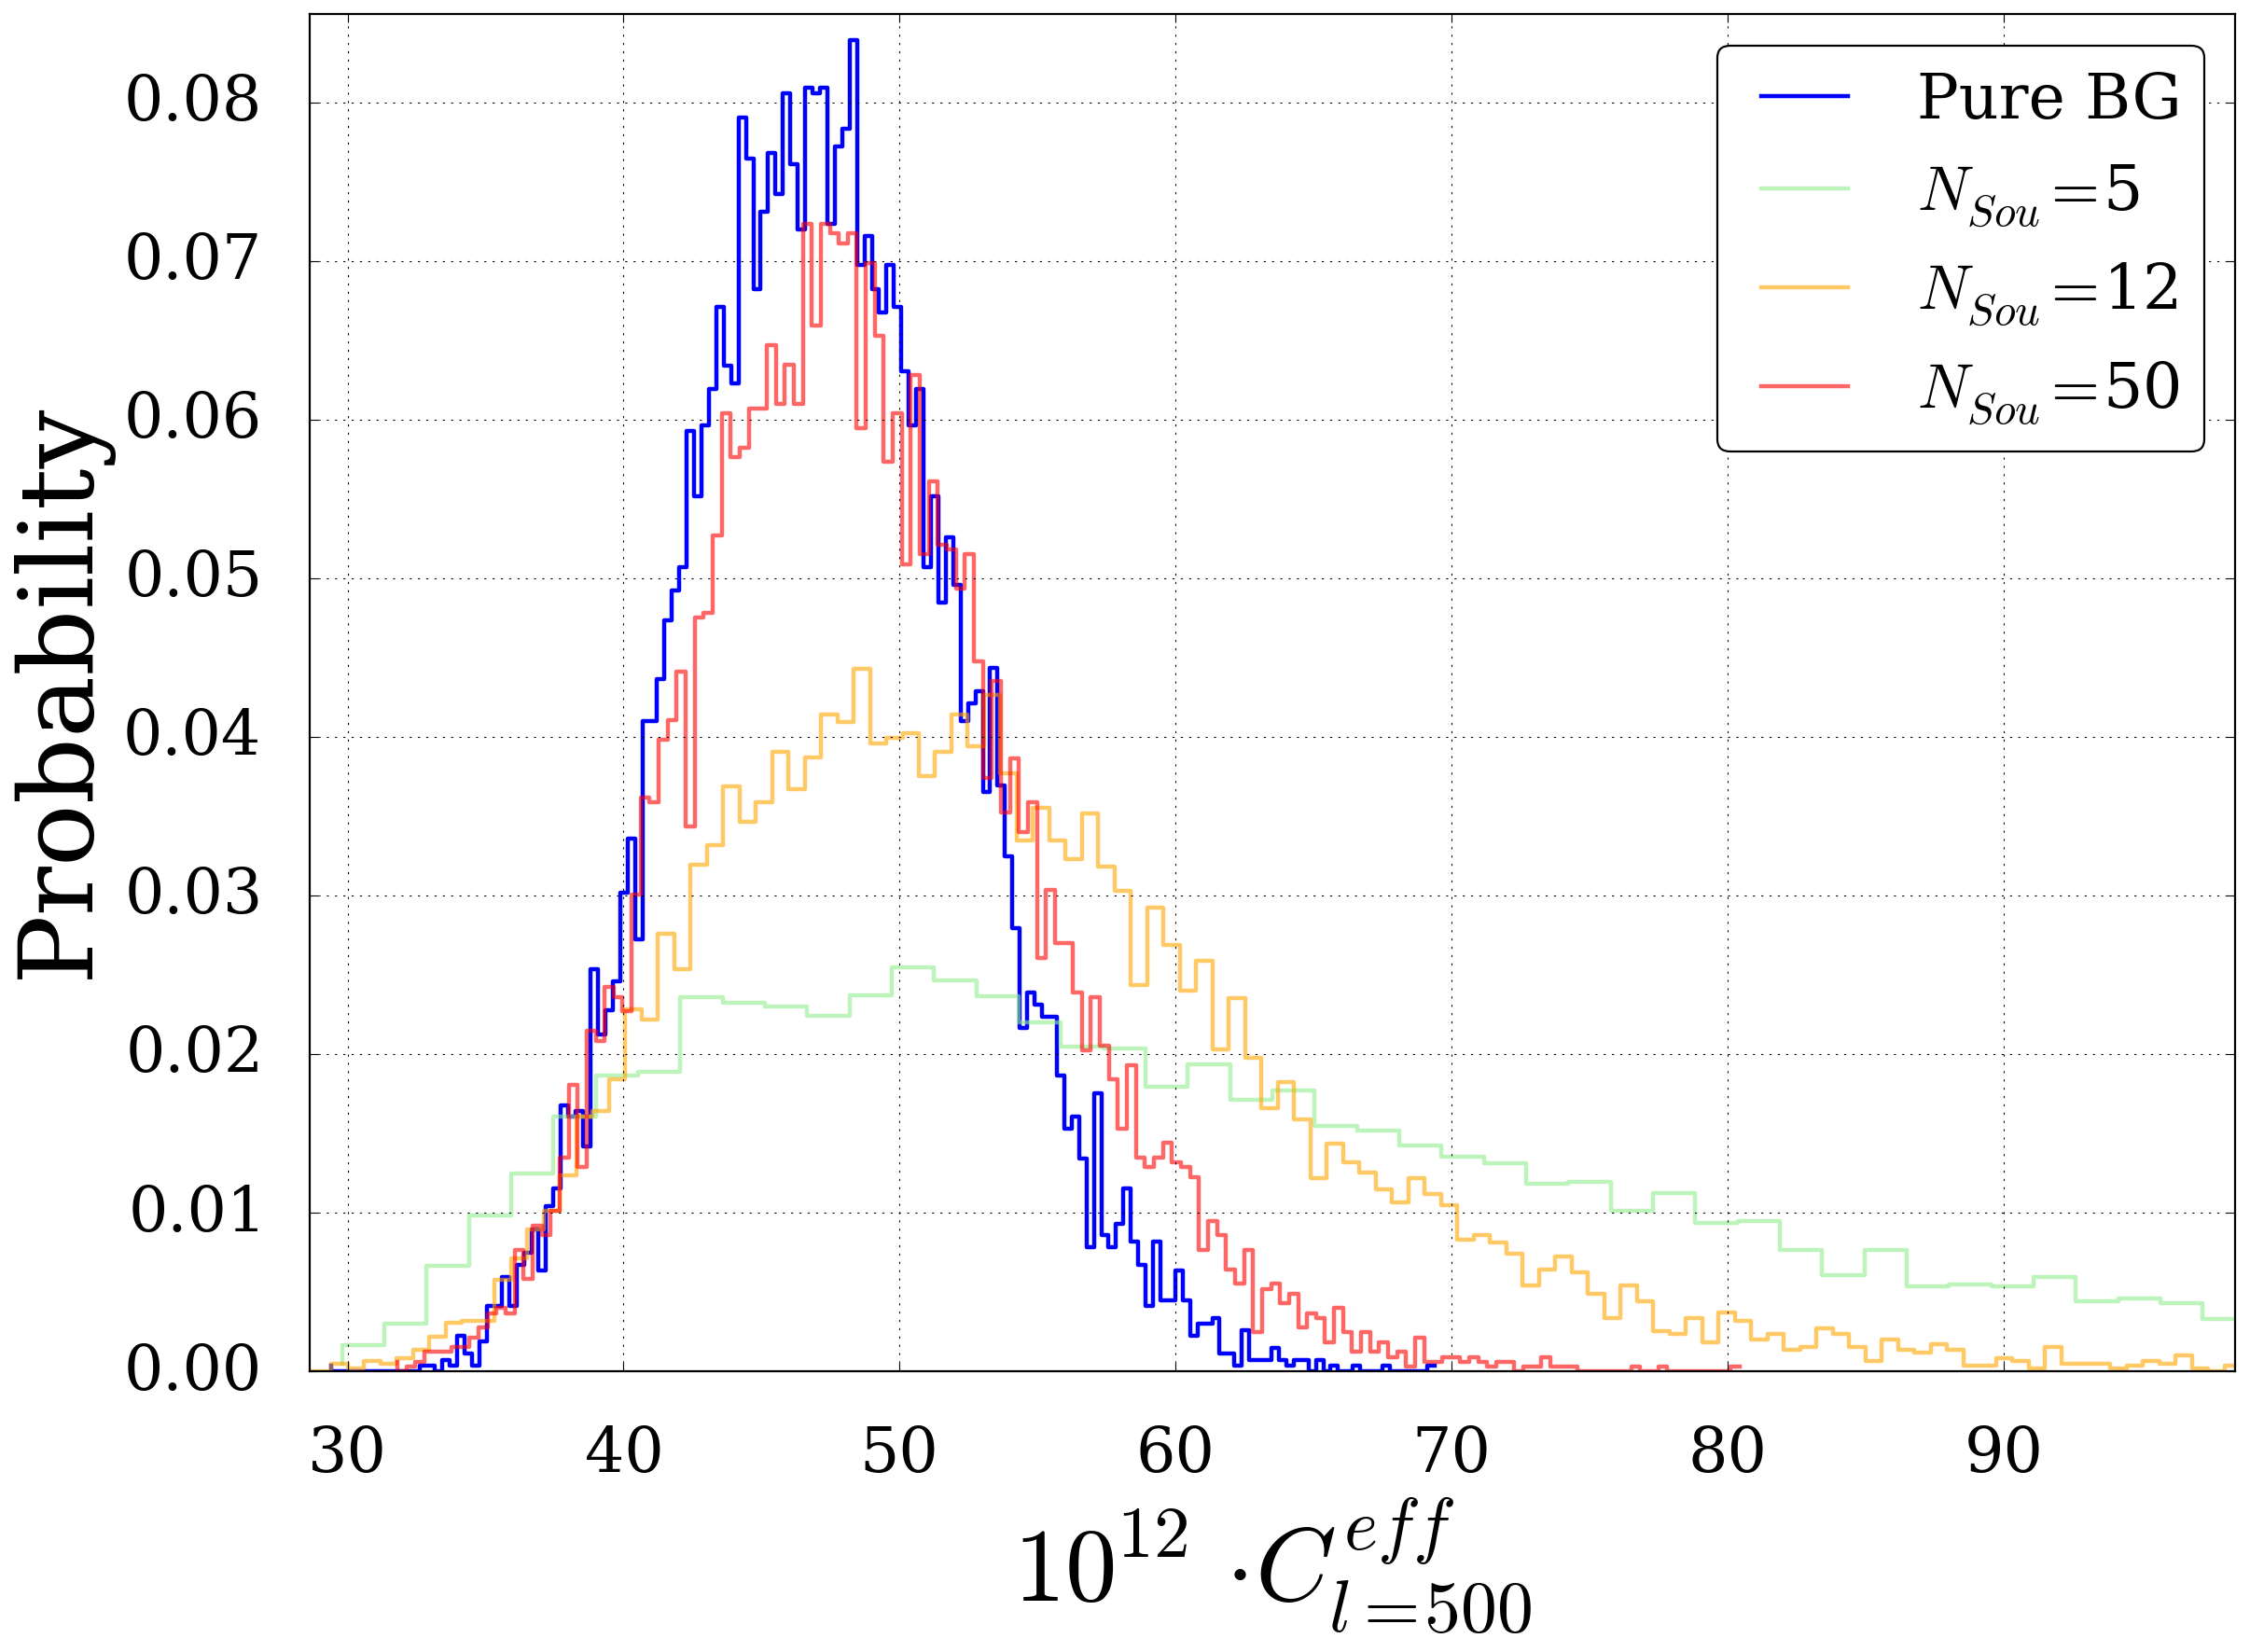
Fig. 33 The probability distribution of the power spectra for l=500
Significance Check
Only important when testing astrophysical models.
![_images/check_sigma[15,10,1,1].png](_images/check_sigma[15,10,1,1].png)
Fig. 34 Comparison of the significance of simulated multi-mu skymaps with the integral calculation
![_images/check_sigma[16,7,4,3,1,1].png](_images/check_sigma[16,7,4,3,1,1].png)
Fig. 35 Comparison of the significance of simulated multi-mu skymaps with the integral calculation
![_images/check_sigma[300,60,30,15].png](_images/check_sigma[300,60,30,15].png)
Fig. 36 Comparison of the significance of simulated multi-mu skymaps with the integral calculation