Proposed Paper Outline
This section the paper proposel for summarizing the unfolded seasonal variation strength in the zenith range from 90° to 110° from the ICRC proceedings in more detail. Model comparisons are added to the results.
General Info
Target Journal: EPJ-C (same as other seasonal variation analysis & unfolded IceCube spectra)
Proposed Title: Energy-dependent measurement of seasonal variations in the atmospheric neutrino flux with IceCube
Abstract:
Atmospheric neutrinos are produced by meson decays in extensive air showers, mainly by kaons and pions. The critical energy at which neutrino production is equally driven by the decay or reinteraction of the parent meson depends on air temperature and atmospheric depth. This dependence introduces a seasonal variation in the atmospheric neutrino flux, which increases with temperature and inversely with air density. The strength of the seasonal variation is expected to increase with energy due to higher cross section and decay at higher altitudes, at which the temperature variations throughout the year are larger. Seasonal energy spectra are determined by spectrum unfolding with the Dortmund Spectrum Estimation Algorithm (DSEA+), which estimates energy as a target quantity model-independently with machine learning classifiers, with 11.5 years of atmospheric muon neutrino data from IceCube. We provide the first energy-dependent determination of the seasonal variation strength in the energy range from 125GeV to 10TeV at a percentage level.
Key Messages:
Measurement of seasonal variation strength energy-dependently (zenith:90°-110°, energy range: 125GeV-10TeV)
Agreement of measured seasonal variations with MCEq (in particular NRLMSISE-00 atmospheric model)
Proposed Outline
Introduction (seasonal variations theory)
Conventional component: seasonal variations expected
Prompt component: no variation expected
Data
IceCube description
Event selection
Choice of zenith region
Spectrum Unfolding
DSEA+ algorithm
Energy proxies & data-MC-agreement
Treatment of systematic uncertainties
Determination of variation strength on pseudo data (proof-of-concept)
Results
Seasonal variation strength
Model comparison
Conclusion and Prospects
Agreement with static atmospheric model
Analysis only up to 10TeV only conventional component can be analyzed
Descriptions of Sections and Figures
1. Introduction
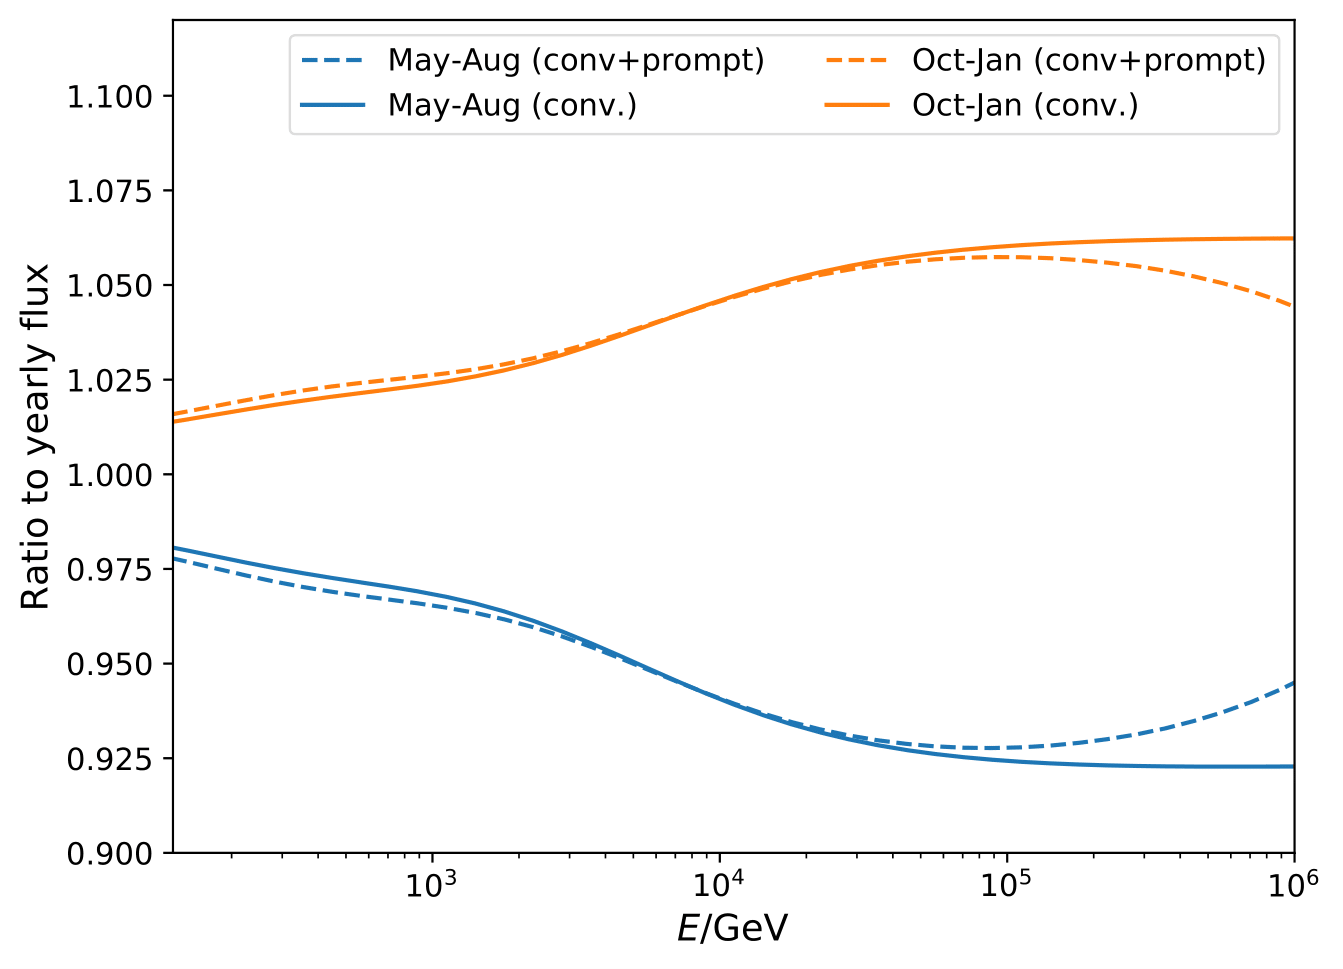
Fig. 1: The calculated ratio of the seasonal muon neutrino flux to the annual average with MCEq (H3a as primary composition, Sibyll2.3c as hadronic interaction model, and NRLMSISE-00 as atmospheric parametrization) for the zenith range from 90° to 110° for austral summer and winter. The total flux including the presence of a prompt flux component is indicated by dashed lines, the conventional flux component by solid lines. The seasonal variation strength is expected to decrease when prompt neutrinos become the major flux component.
2. Data
IceCube
Event Selection
Zenith cut
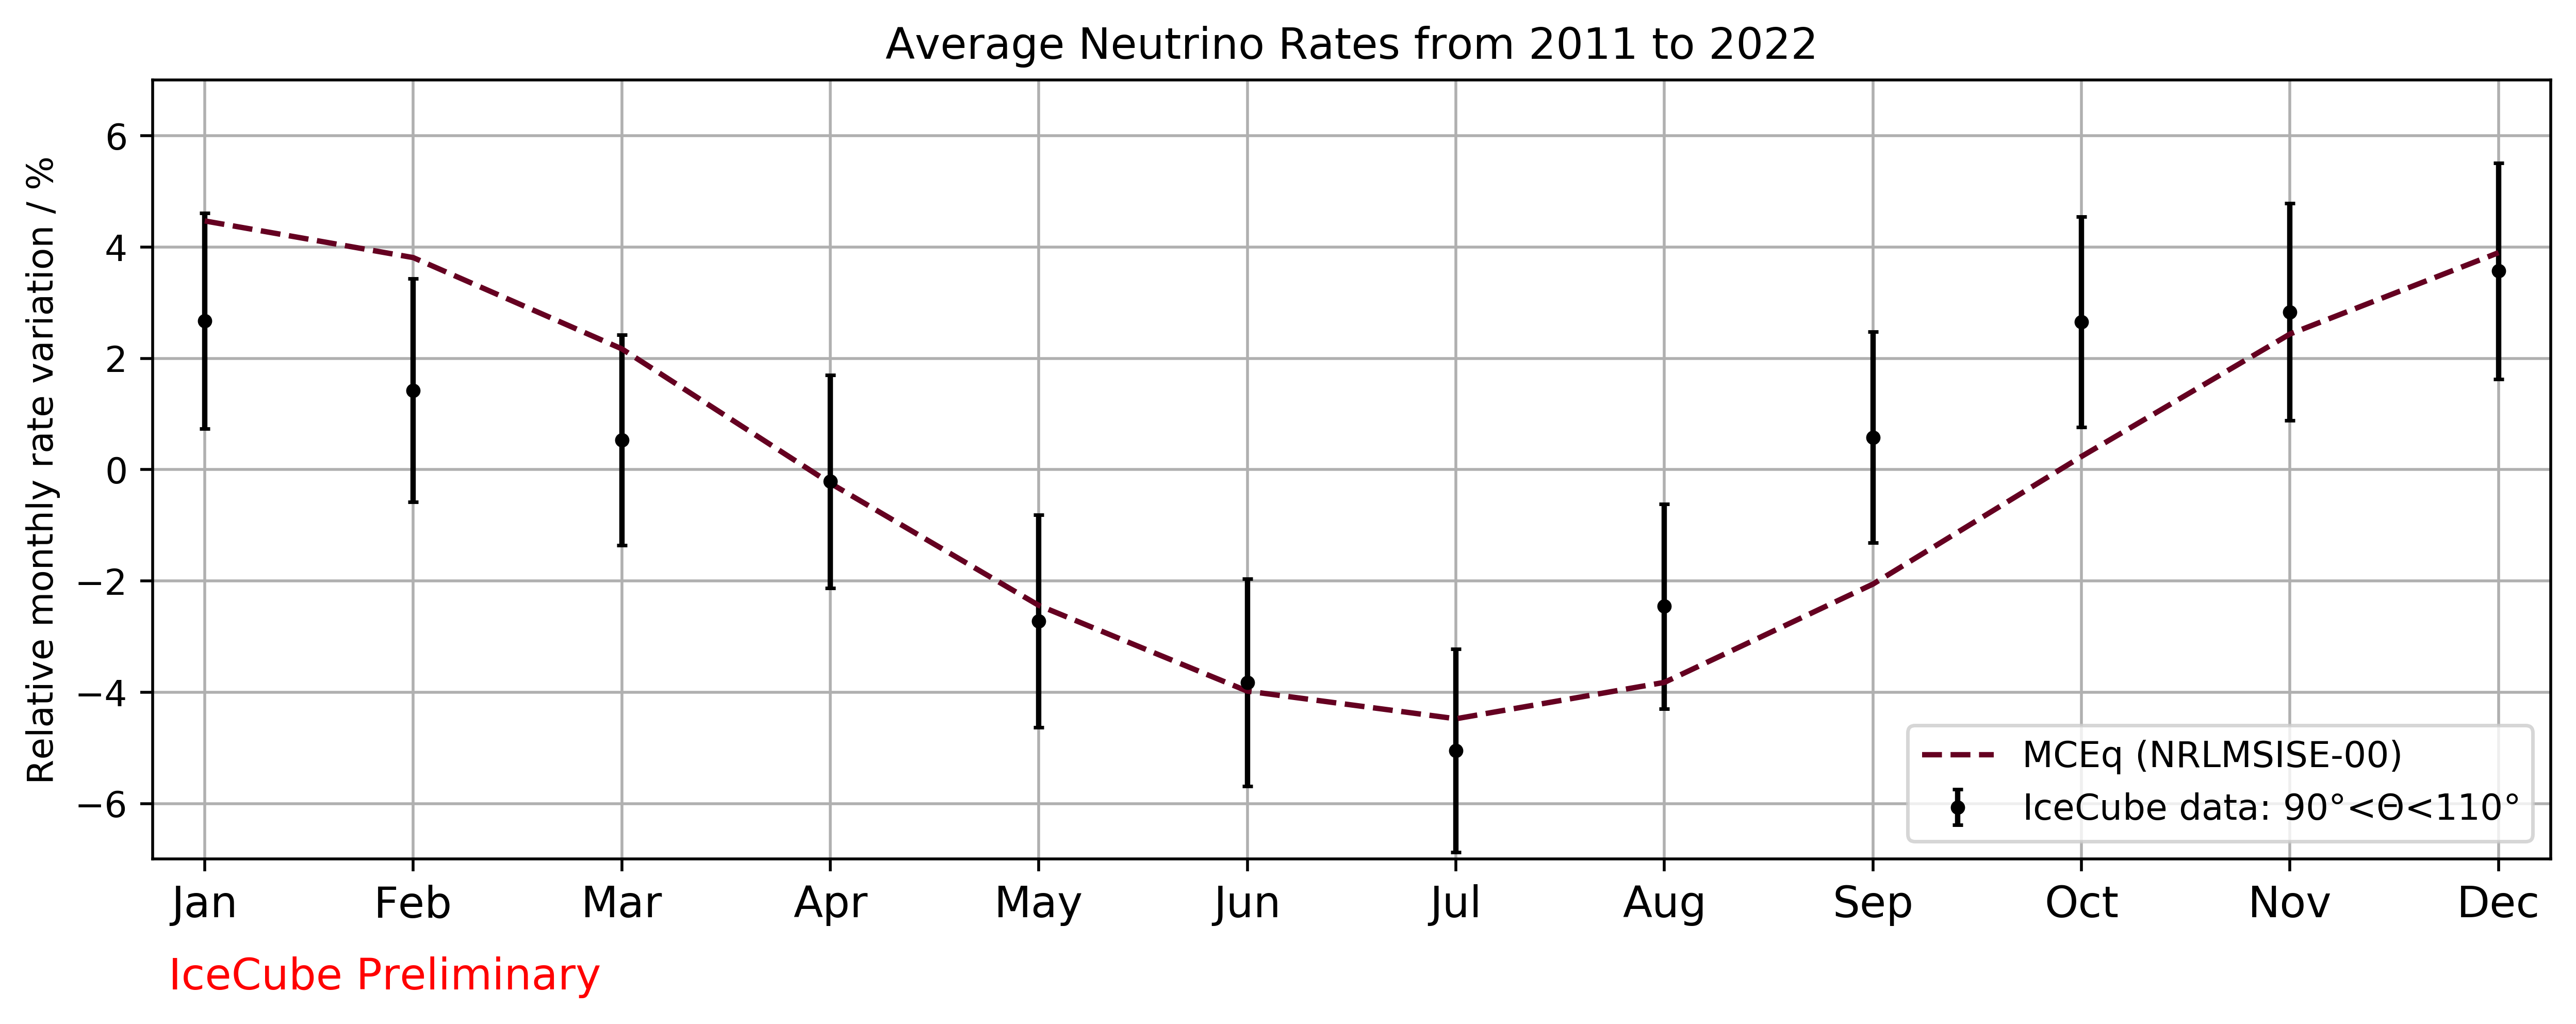
Fig. 2: Relative monthly rate variation in the zenith range from 90° to 110° with statistical uncertainty averaged from May 2011 to December 2022. Error bars depict the statistical uncertainty of the rate.
3. Spectrum Unfolding
Description of unfolding
Unfolding algorithm: DSEA+
Energy proxies
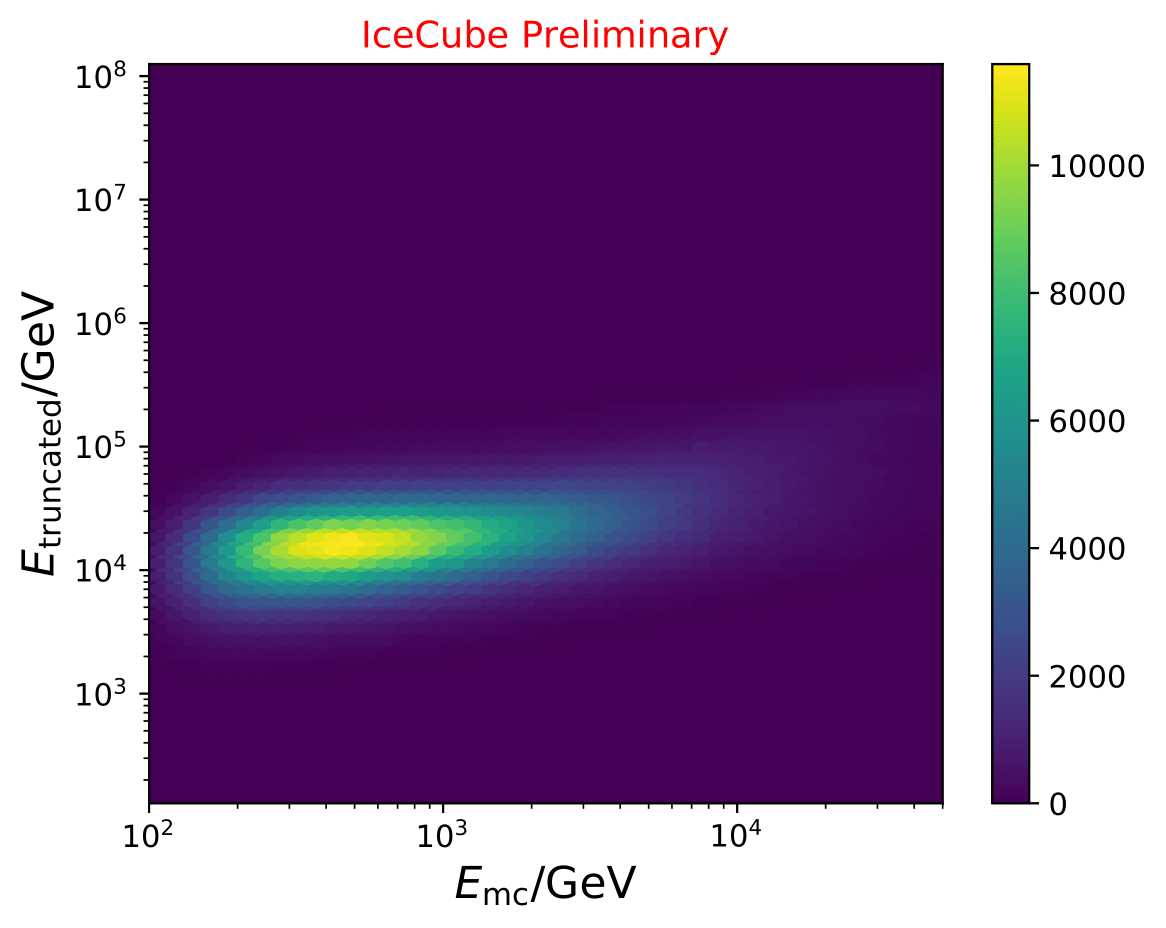
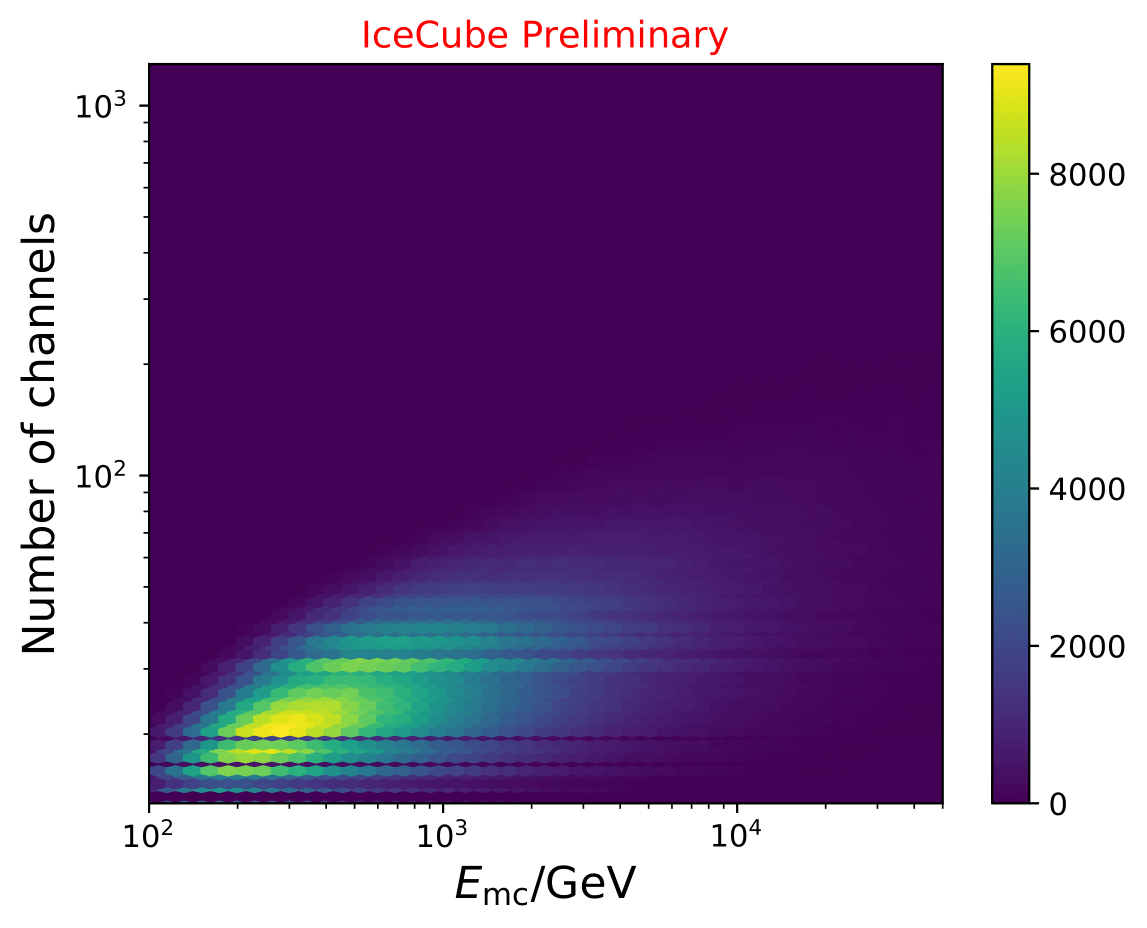
Fig. 3: Correlation between energy proxies and simulated neutrino energy \(E_{mc}\).
Data-MC-Agreement
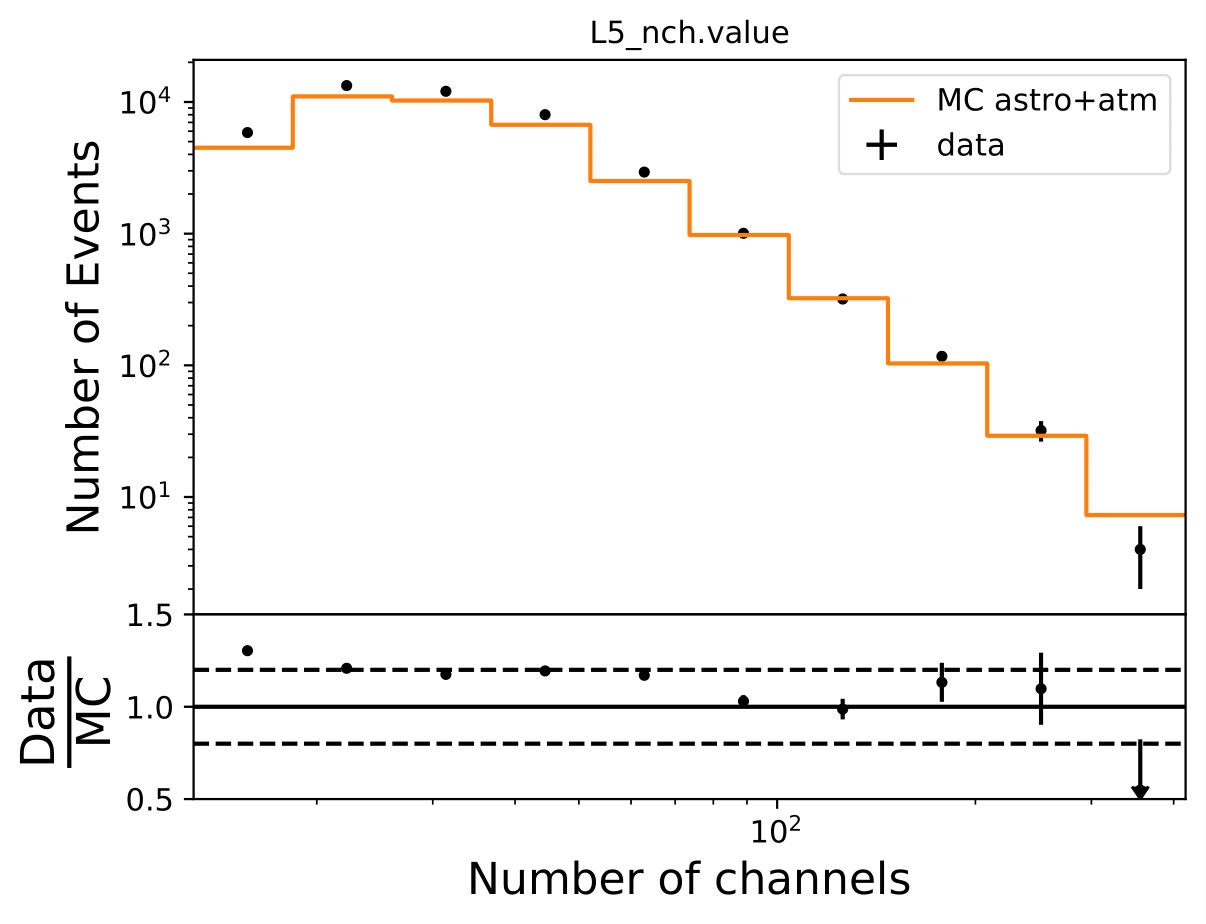
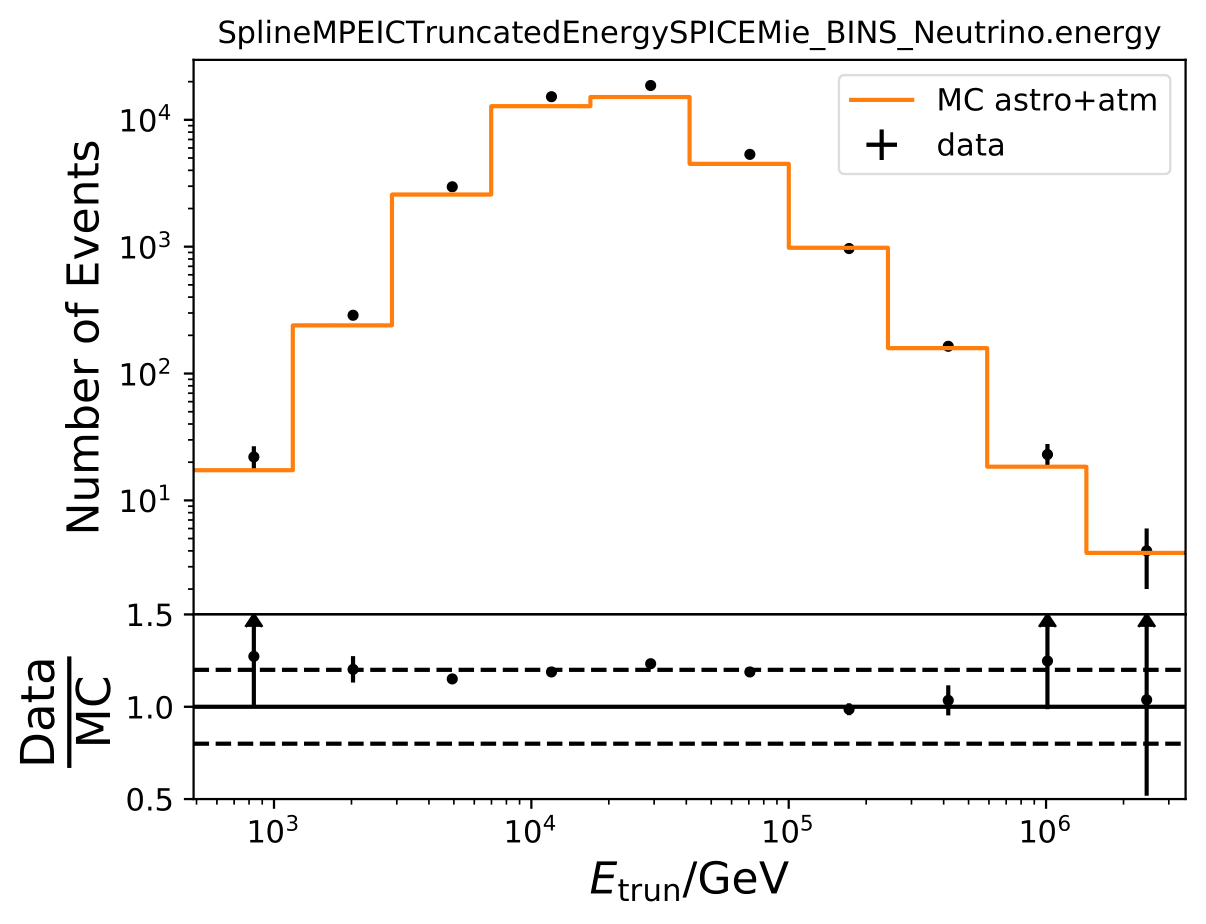
Fig. 4: Data-MC-agreement for both energy proxies used in unfolding. Dashed lines indicate a ratio of +/- 20%. Simulated events are weighted to the MCEq flux prediction (H3a, Sybill2.3c, NRLMSISE-00 yearly average) and astrophysical neutrino flux.
Treatment of systematic uncertainties (either as plot or table)
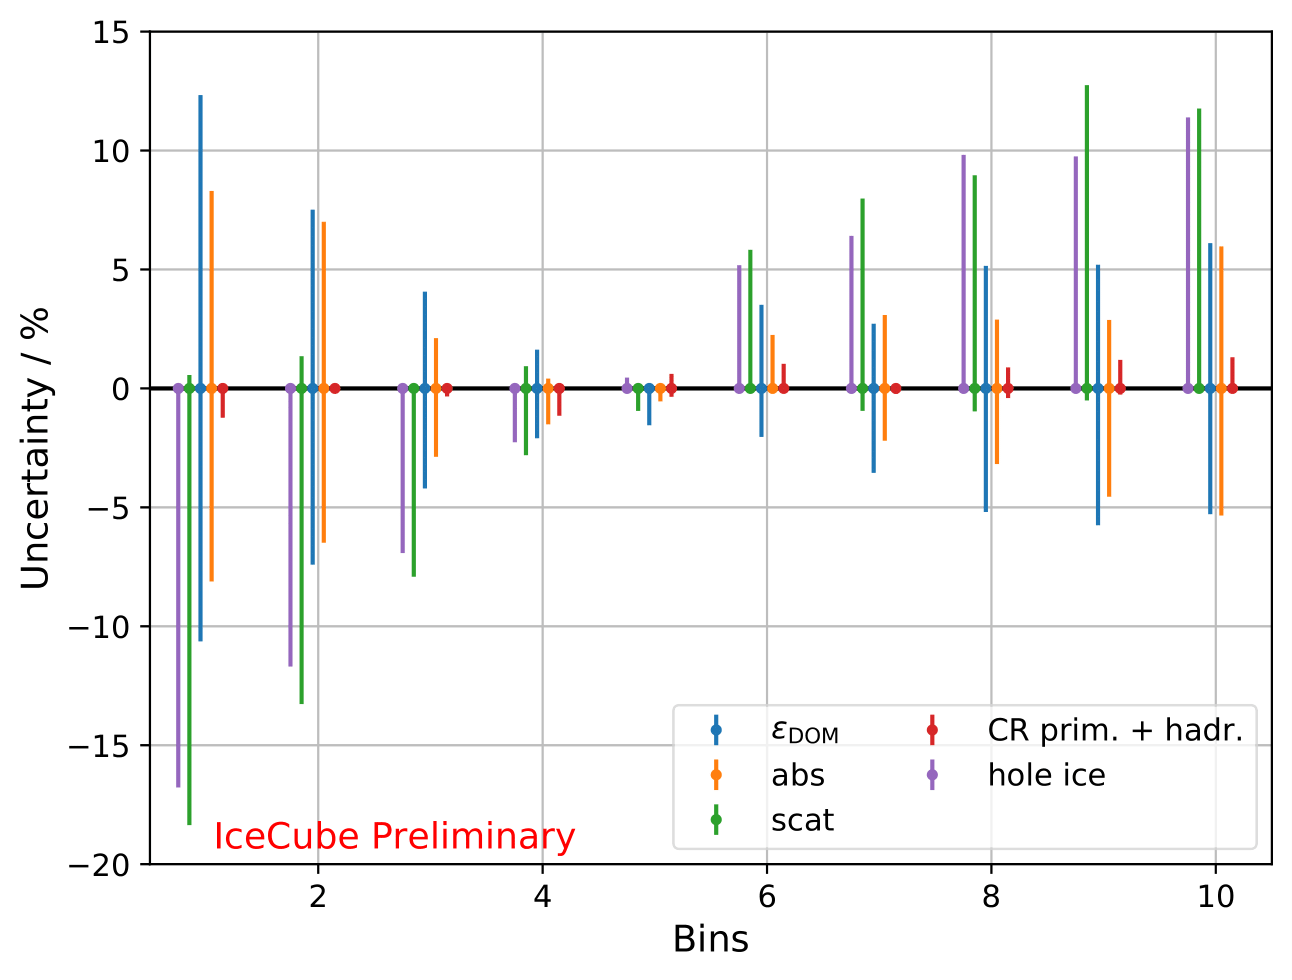
Fig. 5: Detailed overview of systematic uncertainties of the unfolded spectrum per source and energy bin. The systematic uncertainty remains constant for all seasons, as the uncertainty is determined relatively.
Proof-of-concept: Pseudo-data unfolding
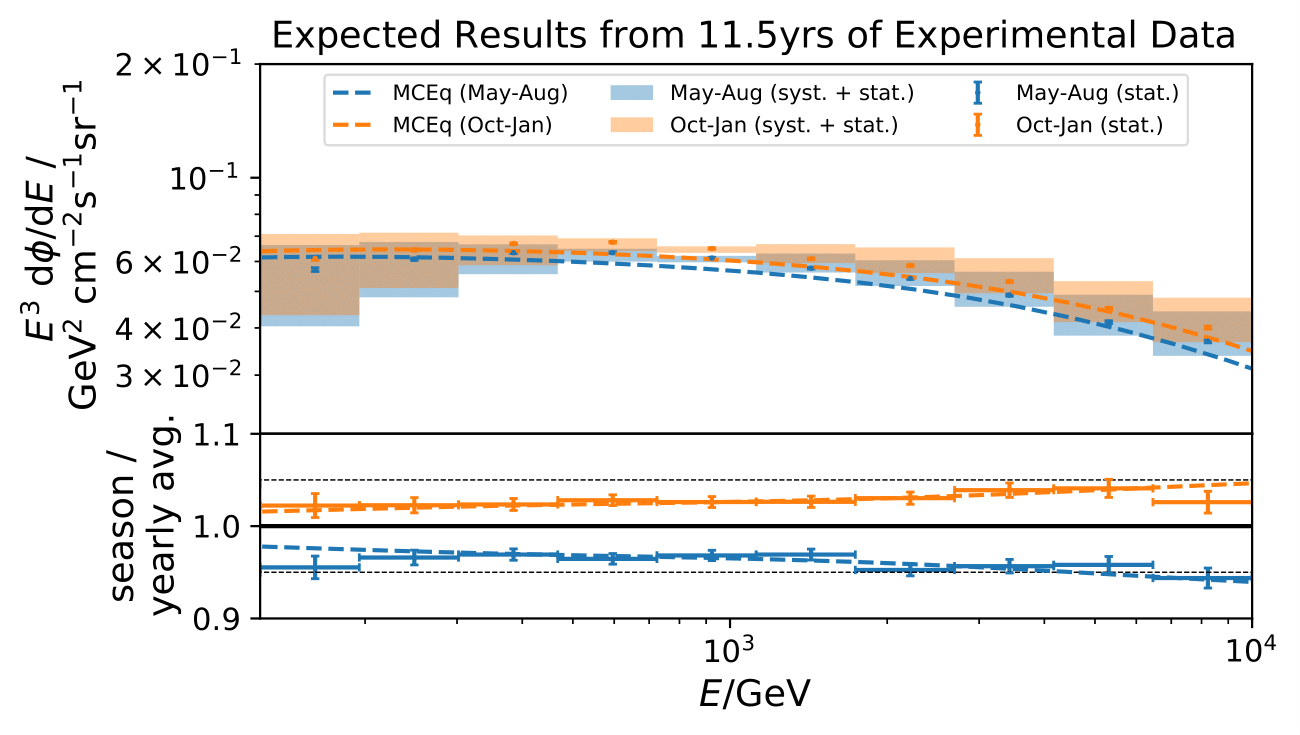
Fig. 6: The upper panel shows the unfolded seasonal spectrum of a pseudo sample corresponding to 11.3 years of experimental data. Statistical uncertainties are depicted as error bars, and systematic uncertainties as shaded areas. The lower panel shows the ratio of the unfolded seasonal pseudo samples to the annual average. The systematic uncertainties remain the same for each season and cancel in the ratio, which is only attributed to statistical uncertainties. The theory predictions from MCEq (H3a, Sybill2.3c, NRLMSISE-00) are depicted in dashed lines for the respective seasons.
4. Results
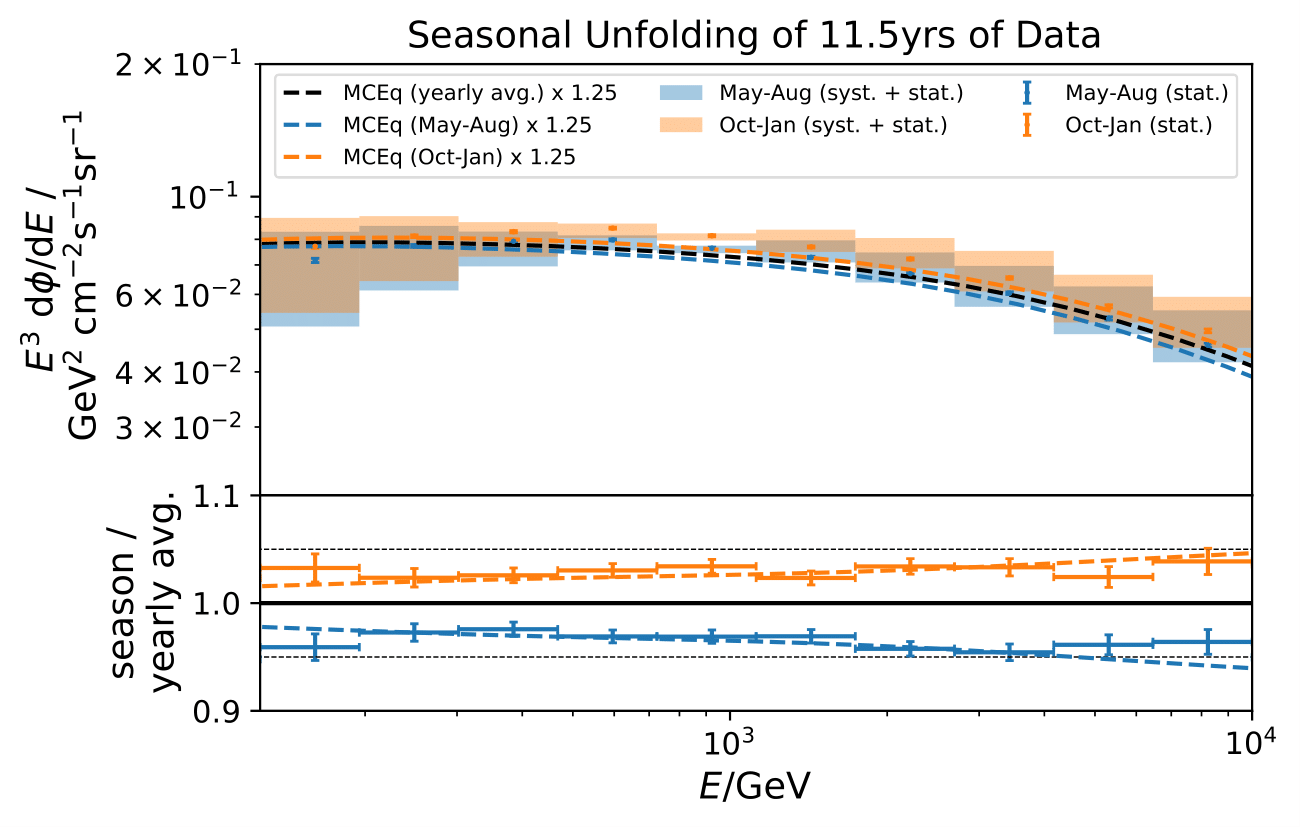
Fig. 7: The upper panel shows the unfolded seasonal for the seasons for austral summer from October to January and austral winter from May to August. Statistical uncertainties are depicted as error bars, and systematic uncertainties as shaded areas. The theory predictions from MCEq (H3a, Sybill2.3c, NRLMSISE-00) are depicted in dashed lines for the respective seasons, scaled by a constant normalization factor. The lower panel shows the ratio of the unfolded seasonal pseudo samples to the annual average. The systematic uncertainties remain the same for each season and cancel in the ratio, which is only attributed to statistical uncertainties.
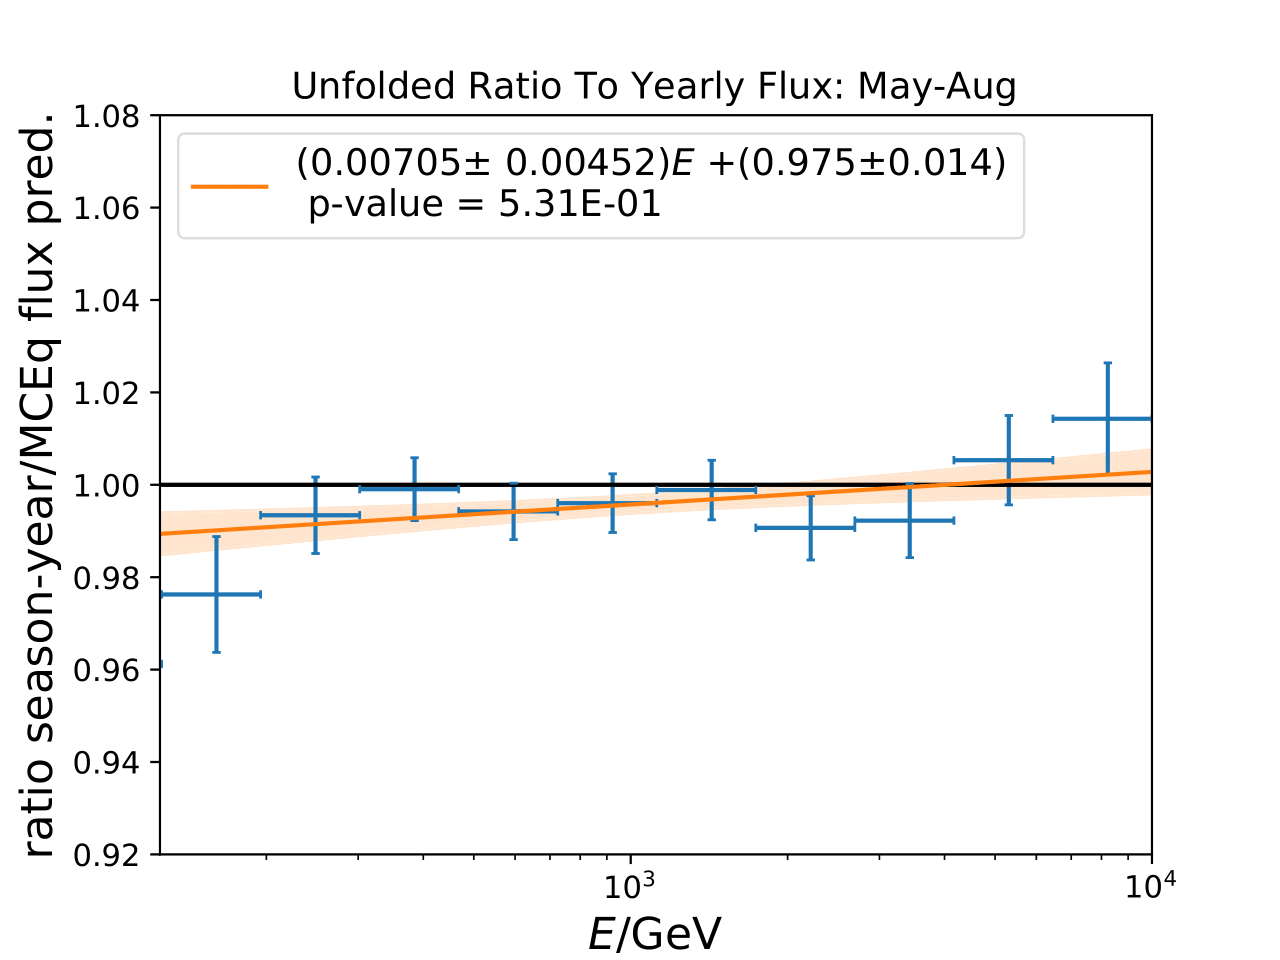
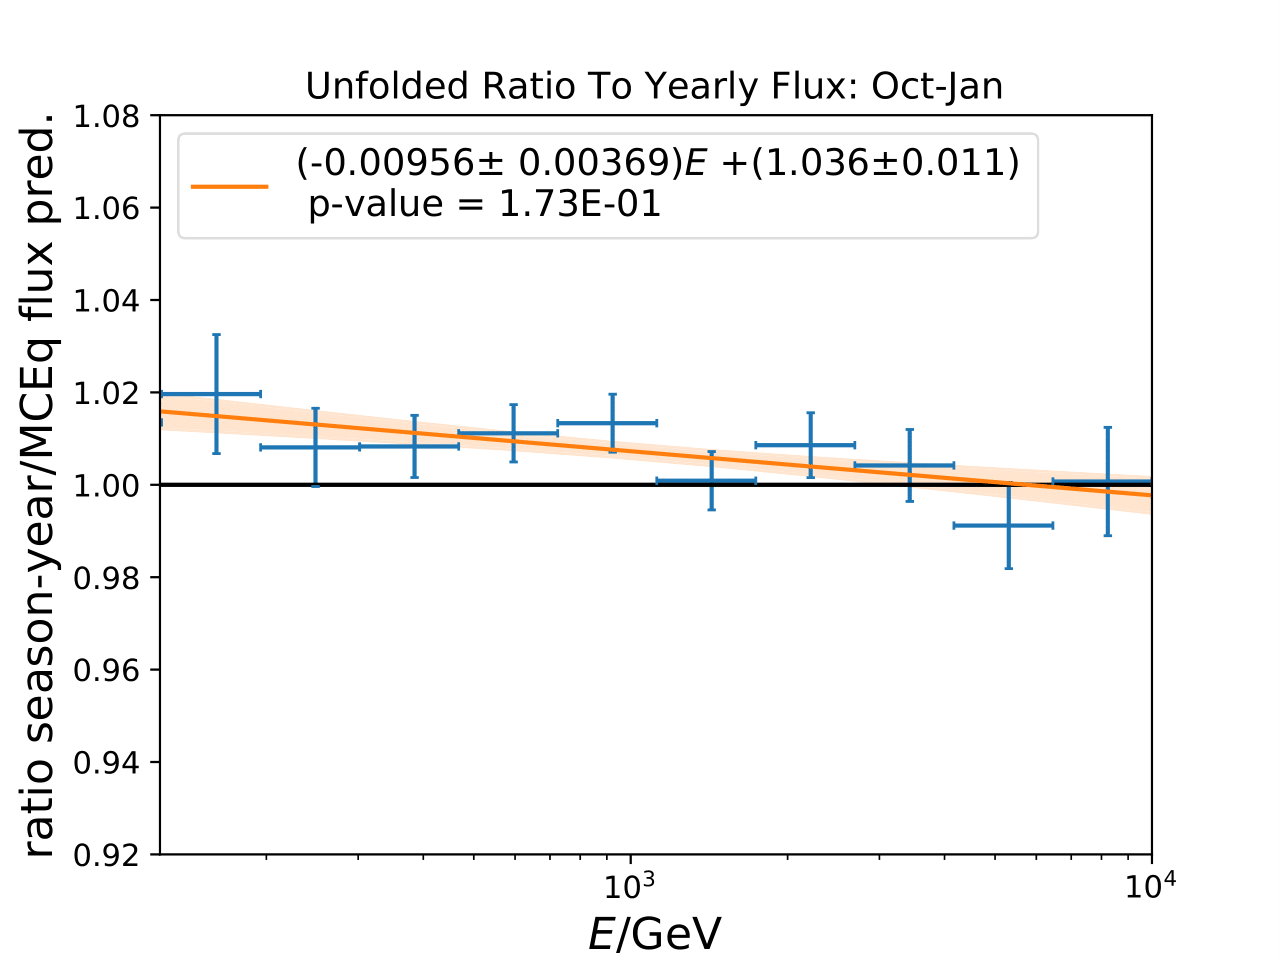
Fig. 8: Deviation of the unfolded seasonal flux ratio for austral summer and winter from the MCEq predictions evaluated in a \(\chi^2\)-test. Statistical uncertainties of the ratio are depicted as error bars. The null hypothesis is defined as a ratio of one, valid when the unfolded ratio is in agreement with the prediction. The slope of the ratio is fitted by a linear function to show potential offsets to the prediction.
– can alternatively only appear in text instead of figure
5. Conlcusion and Discussion
Main findings:
seasonal variation strength increases with energy
agreement with NRLMSISE-00 used in MCEq prediction
measurement only feasible up to 10TeV due to limited statistics at higher energies
determined seasonal variation amplitude is compatible with published result in Eur.Phys.J.C 83 (2023)