Systematic Checks
Bias Test of the Unfolding
Impact of Training Sample Size
Training and test set follow both the MCEq + astrophysical resampled distribution. The full MC sample is divided into the following. The first 2 mio. events are separated into an event pull of events for training, the remaining events for testing. The analysis was designed upon Pass1 MC where the training set was chosen to contain 100000 events. It is tested whether this number of events can train DSEA sufficiently well to obtain the true spectrum of the test set. The training set contains 100000, 200000 or 1 mio. events.The test set consists of 100000 events as a rough expectation from three months of data from the 10 year data set. The dashed lines in the bottom plot display a deviation of unfolded to true spectrum of +/- 5%. To accurately measure seasonal variations, a small effect of the order of 1-6% (depending on the energy), the deviation should be as small as possible.
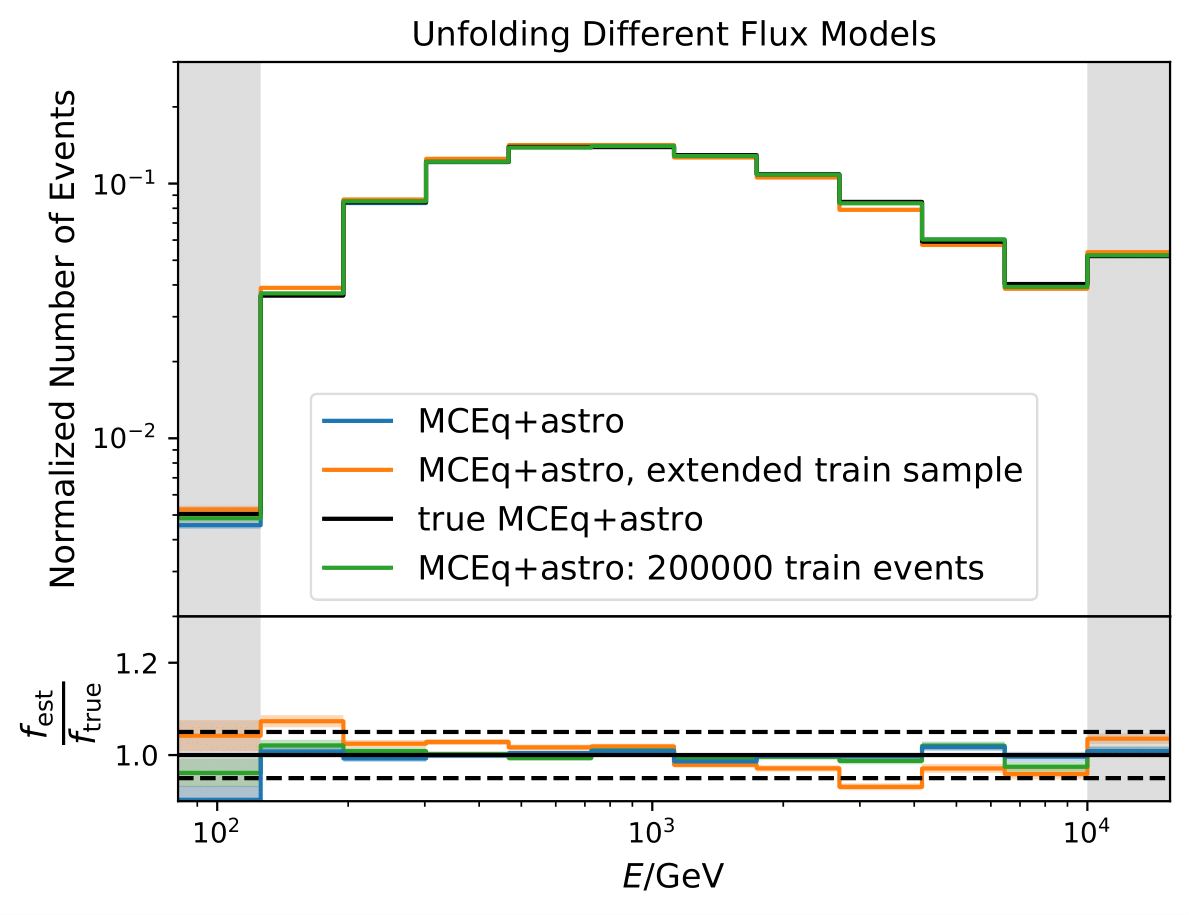
The training with 100000 events is sufficient and yields the closest spectrum to the underlying truth. The 200000 training sets performs better in bin1, but worse in bin 10. As the seasonal variations effect is most likely not measurable at energies contained in bin 1, the smaller training sample is preferred. Increasing the training sample to 1 mio. events worsens the unfolding.
The following unfoldings are done with the 100000 event training sample.
Impact of Input Spectrum
The training set for unfolding should be very similar to the data set. However, the bias of the algorithm can be tested with different input training spectra. The MC sample is split into the first, the training, part consisting of 2 mio. events. The remaining (about 1 mio.) events are considered as test set. DSEA is trained on an input \(E^{-2}\) spectrum and on the weighted MC (MCEq+astro) with 100000 events each. The unfolding is performed in a bootstrap approach, as explained below. The light bands are the corresponding statistical uncertainties from bootstrapping. The test set is resampled to the combined MCEq and astrophysical weighting. This test can determine the impact of the input training spectrum on the algorithm and its effect when training and test data follow different distributions.
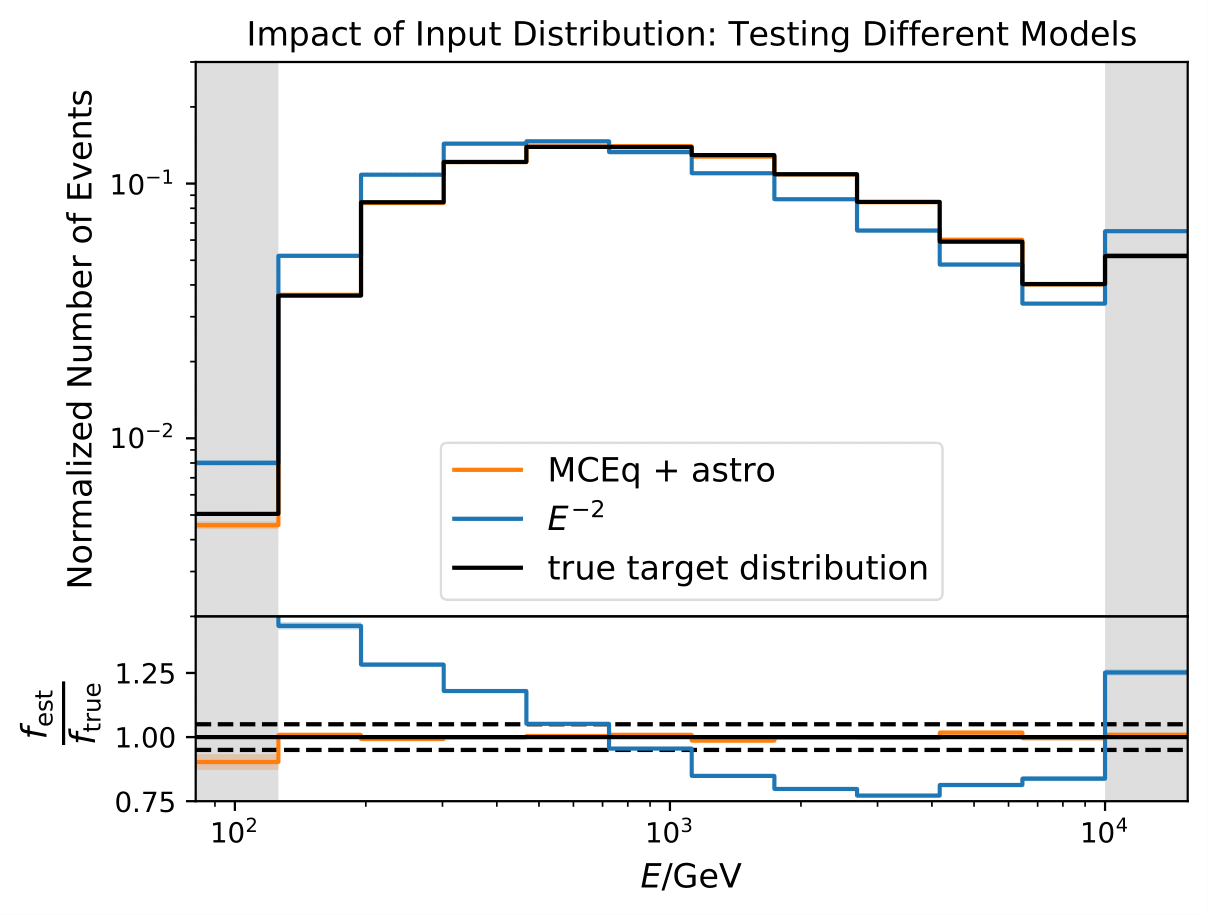
As expected, the unfolding of the same distributions as the algorithms has been trained on is performing very good (same result as shown in the previous section). Unfolding the \(E^{-2}\) MC sample does not work well since the training input resembles an atmospheric spectrum. This behavior is expected as the simple power law of \(E^{-2}\) is far off an atmospheric spectral distribution.
Unfolding of Different Models
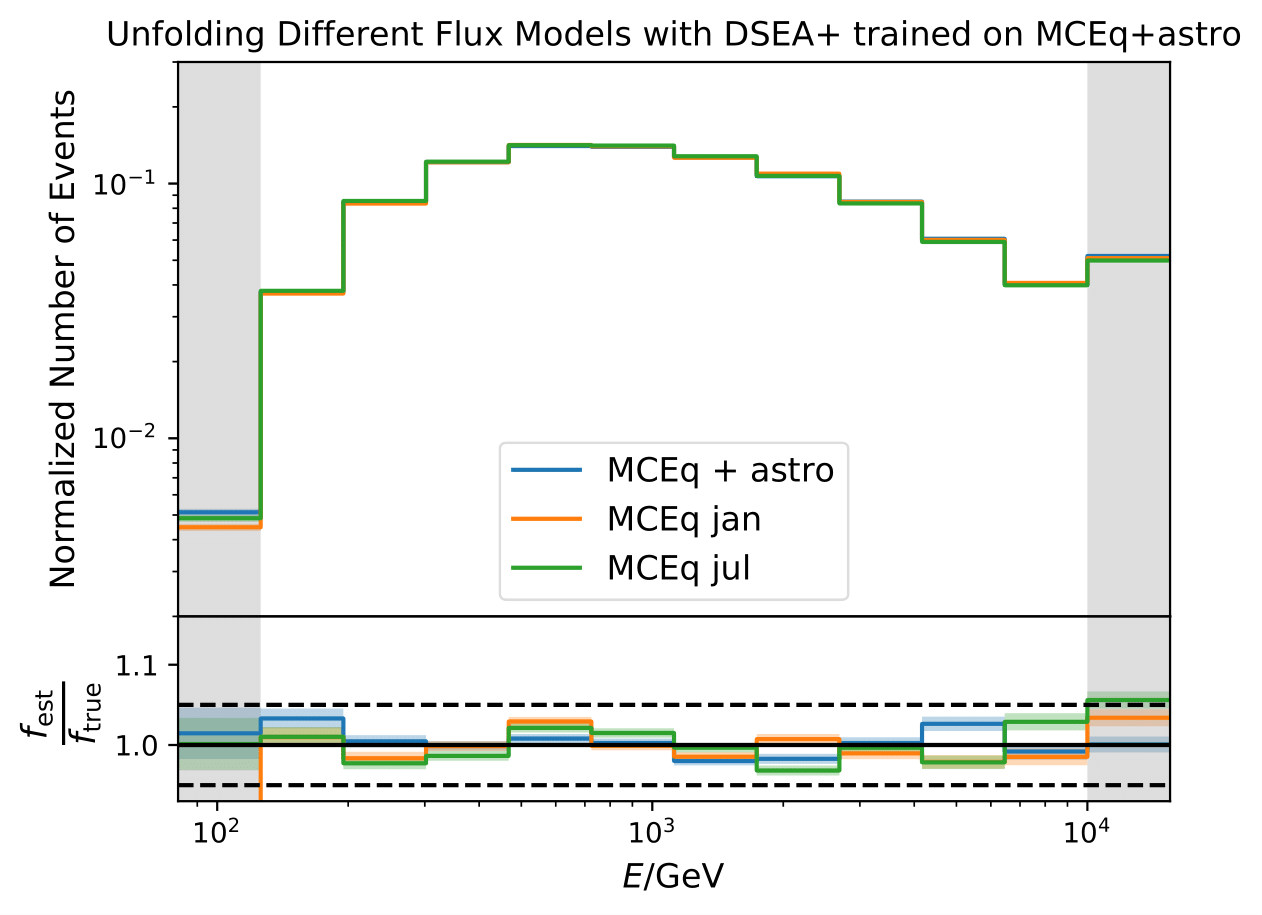
Unfolding the monthly fluxes for January and July lead to some deviations, still considered as small. This test will be repeated when the number of events is adjusted according to the seasonal predictions of the 10yr data set.
Impact of Prior
The impact of a prior estimate on the unfolded result is investigated as a systematic check. A uniform prior between 1 GeV and 1 TeV is selected as a difficult prior, which should not match the target distribution. Ideally, the impact of the prior should disappear latest after a few iterations. The unfolding should be independent on prior assumptions to avoid any model dependence of the result. The training set contains 100 000 events, the test set 100 000 events randomly drawn from the hold-out set (resampled to an atmospheric distribution). The test set is unfolded 2 000 times and the Wasserstein Distance to the MC truth is displayed below.
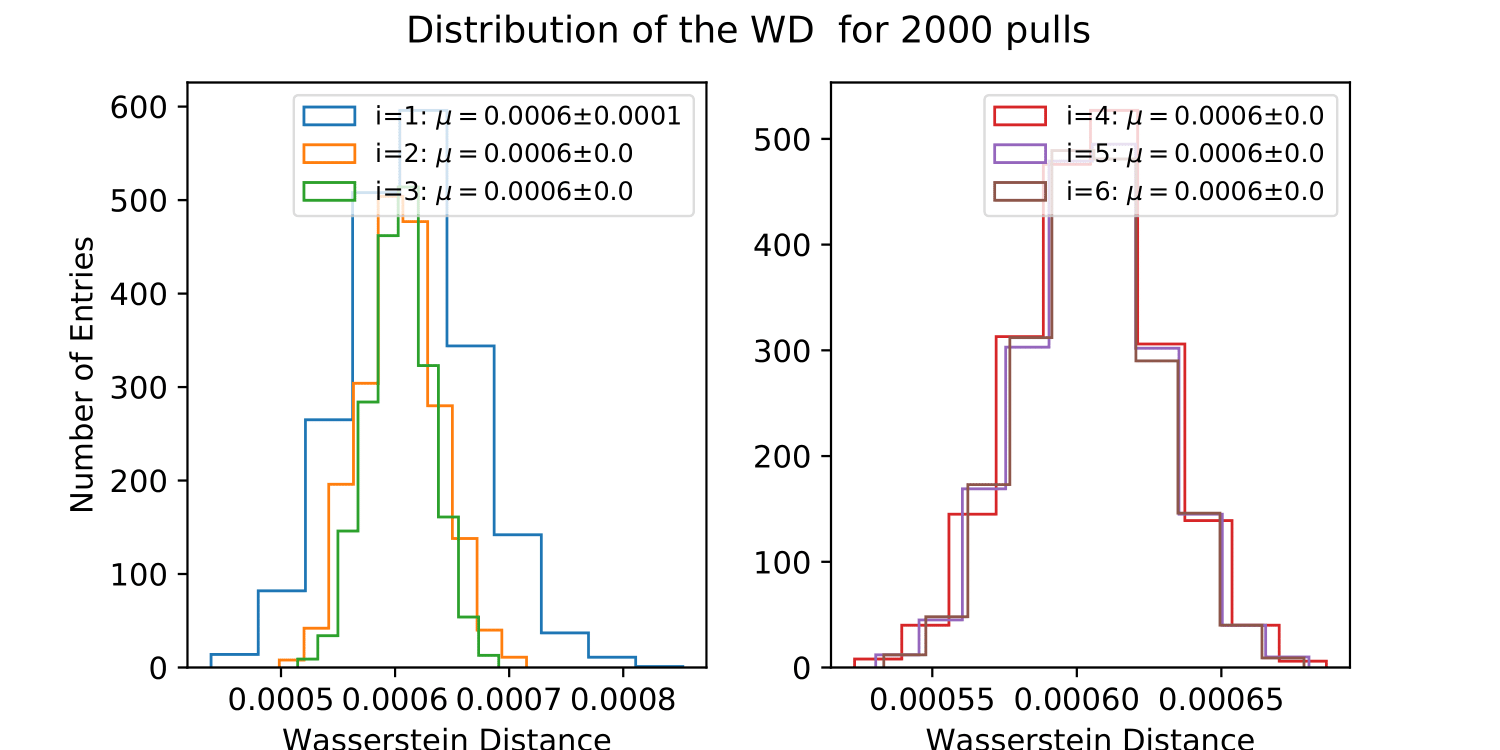
The prior impacts the result of the first iteration leading to a large Wasserstein Distance (bad approximation of the distribution). The Wasserstein Distance converges from iteration 2 on so that the prior has no impact on the final spectrum estimation. The number of DSEA iterations is set to 4 in the following.
Systematic Uncertainties in the Unfolding Process
The Bootstrap Approach - Estimation of Statistical Uncertainties
No uncertainty estimation is incorporated within DSEA yet. The statistical uncertainty of the unfolding can be estimated by the bootstrap approach. The data set is sampled via replacement in each of the 2 000 applications of DSEA while the number of events remains the same. An event can hence occur multiple times in the data set and possible statistical fluctuations caused by unfolding would become estimable. If the distributions per bin show a Gaussian shape, the mean value can be used to estimate the bin content. The standard deviation then acts as the statistical uncertainty of the unfolded results. An example of the bootstrap unfolding of the season June-August is displayed below for every bin:
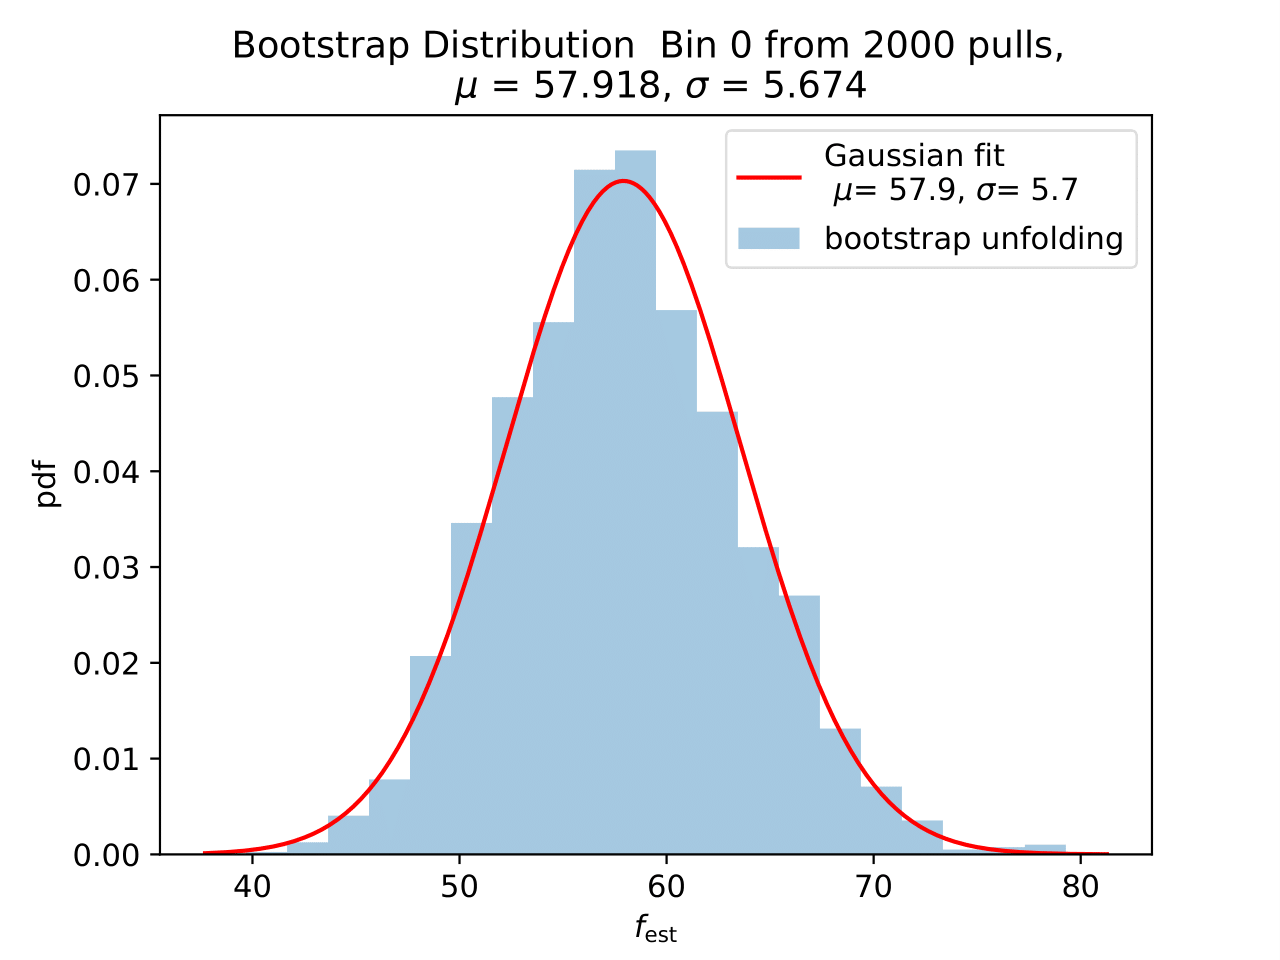
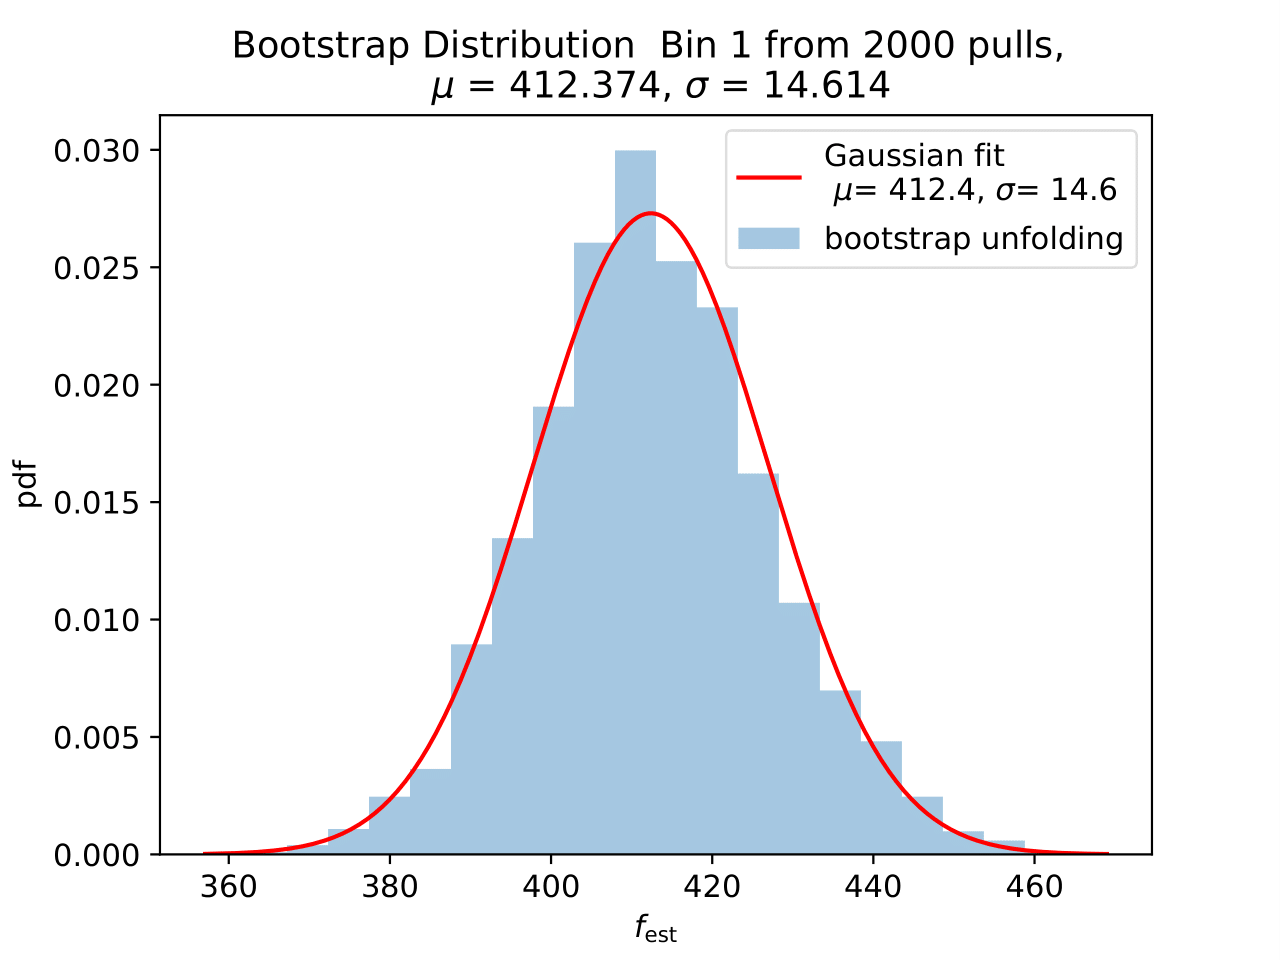
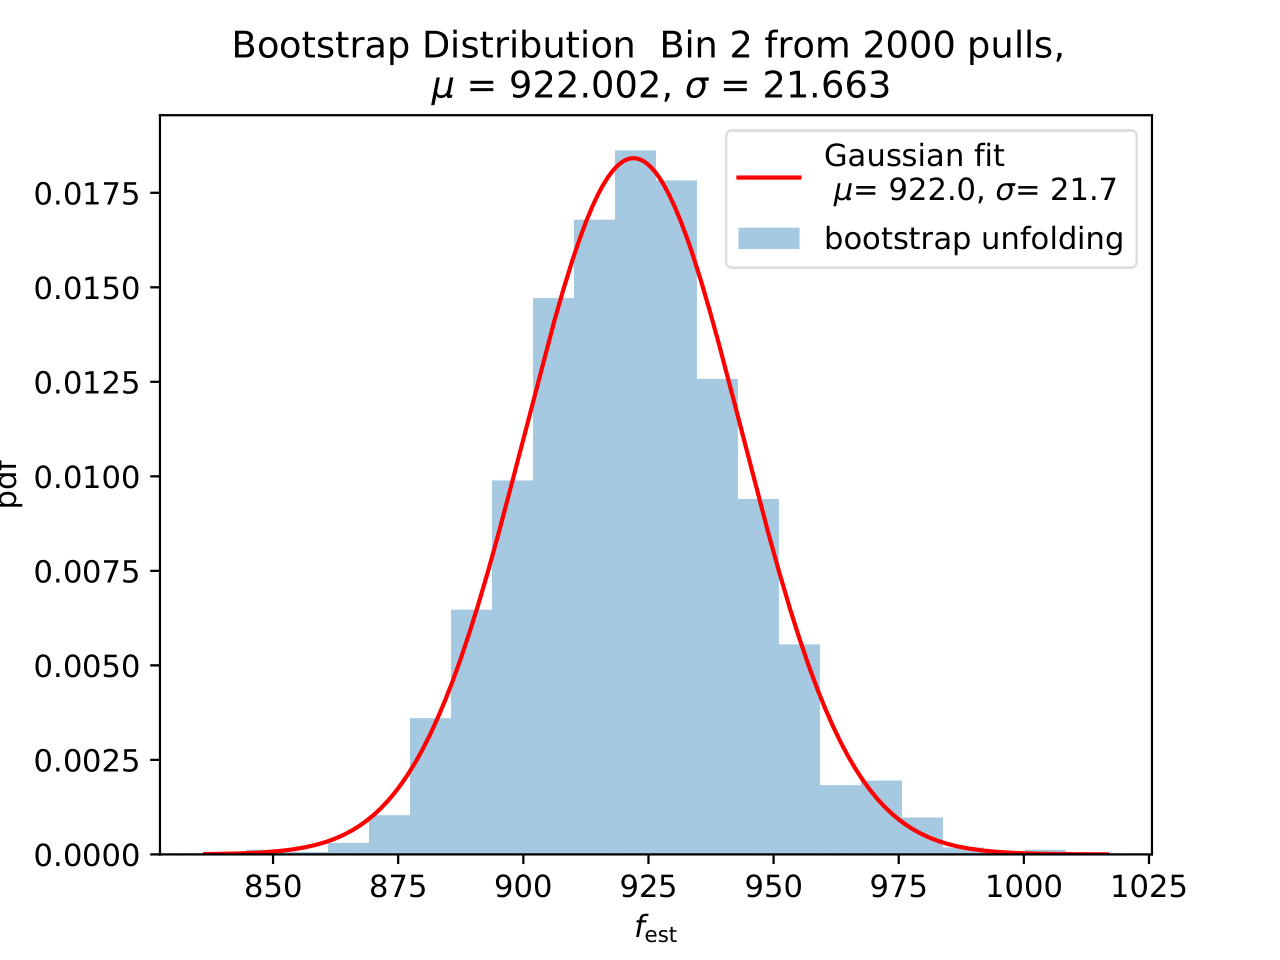
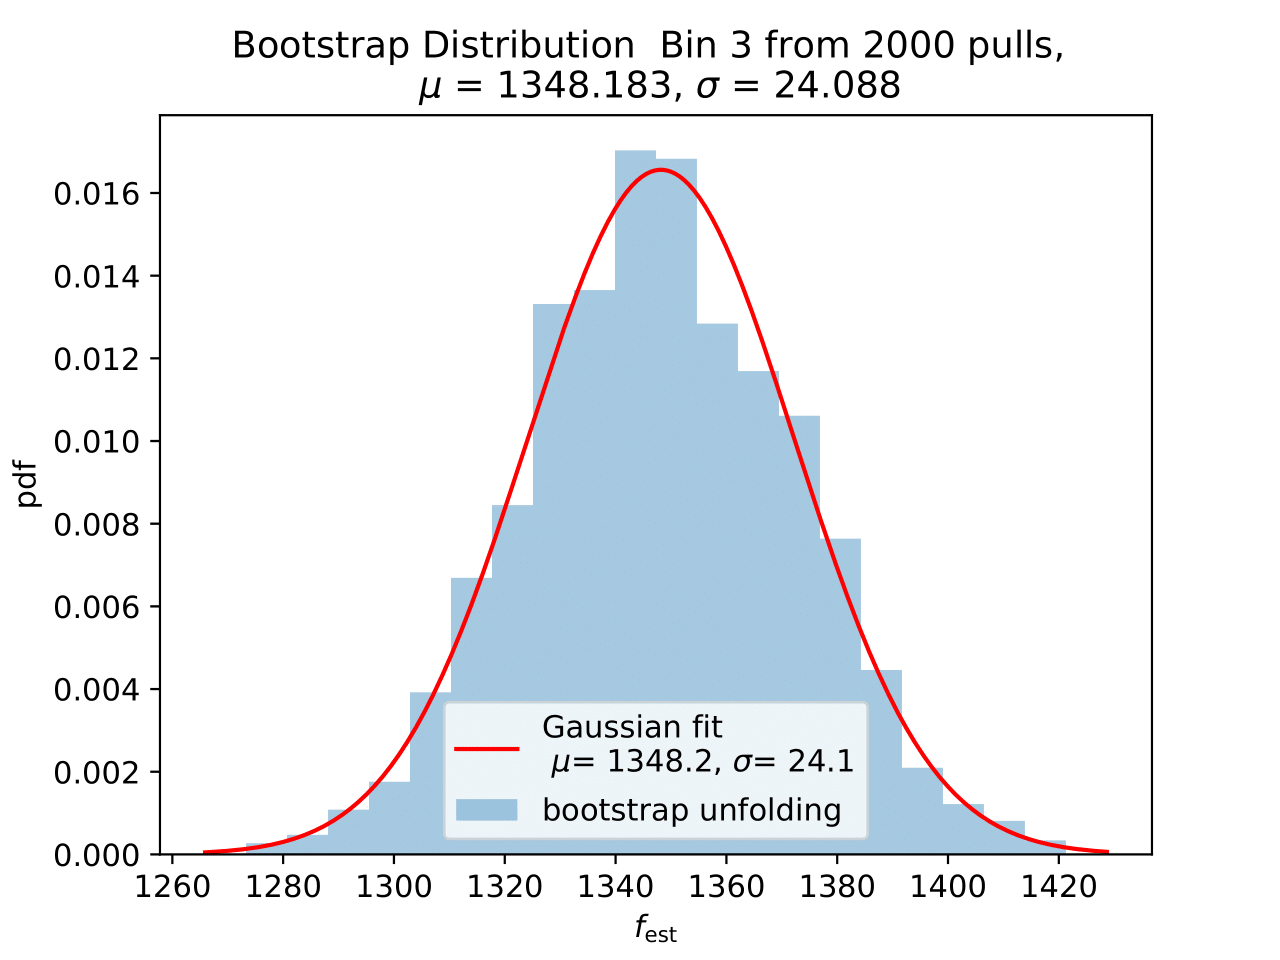
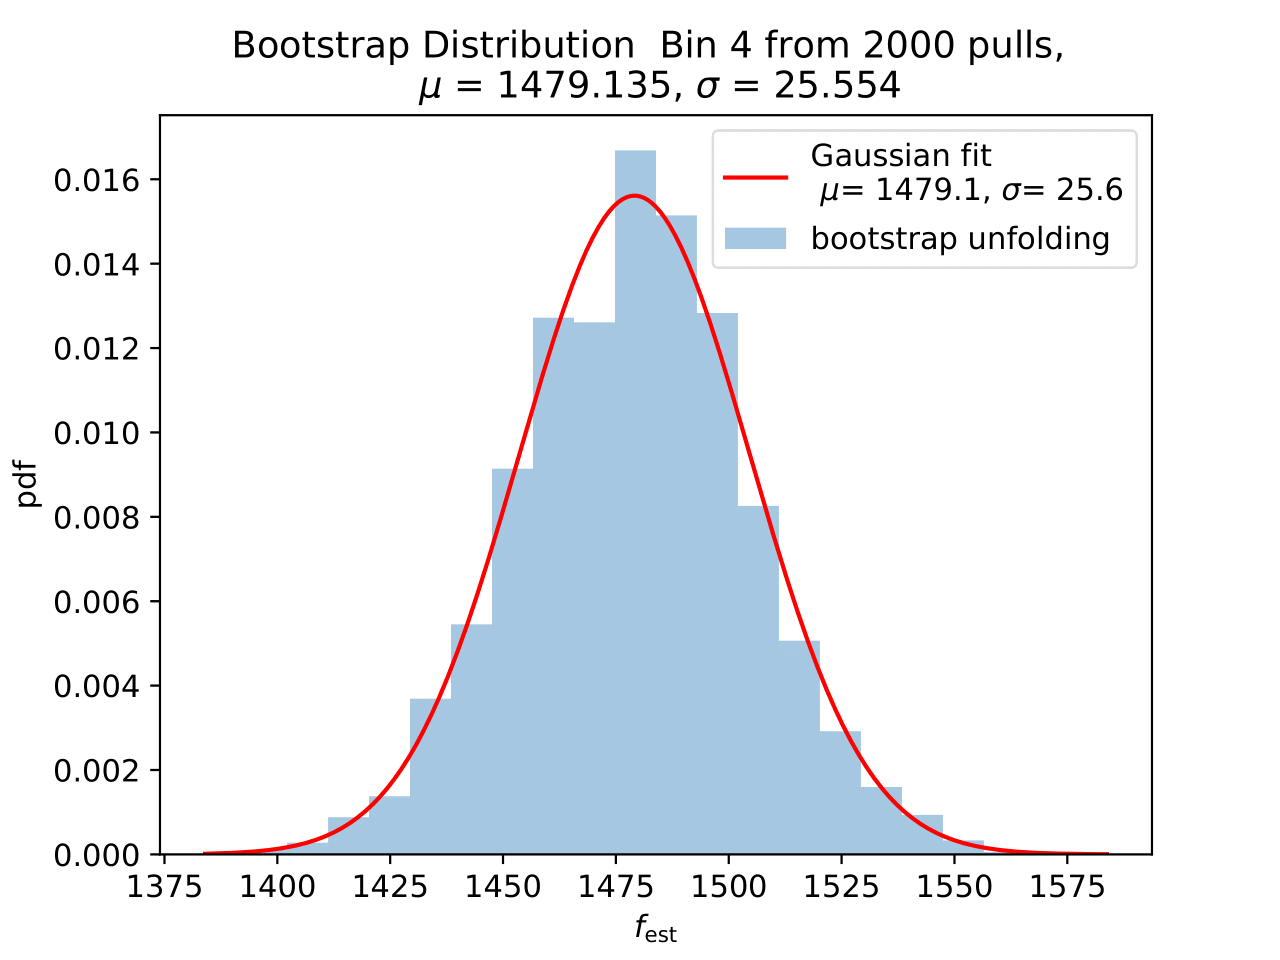
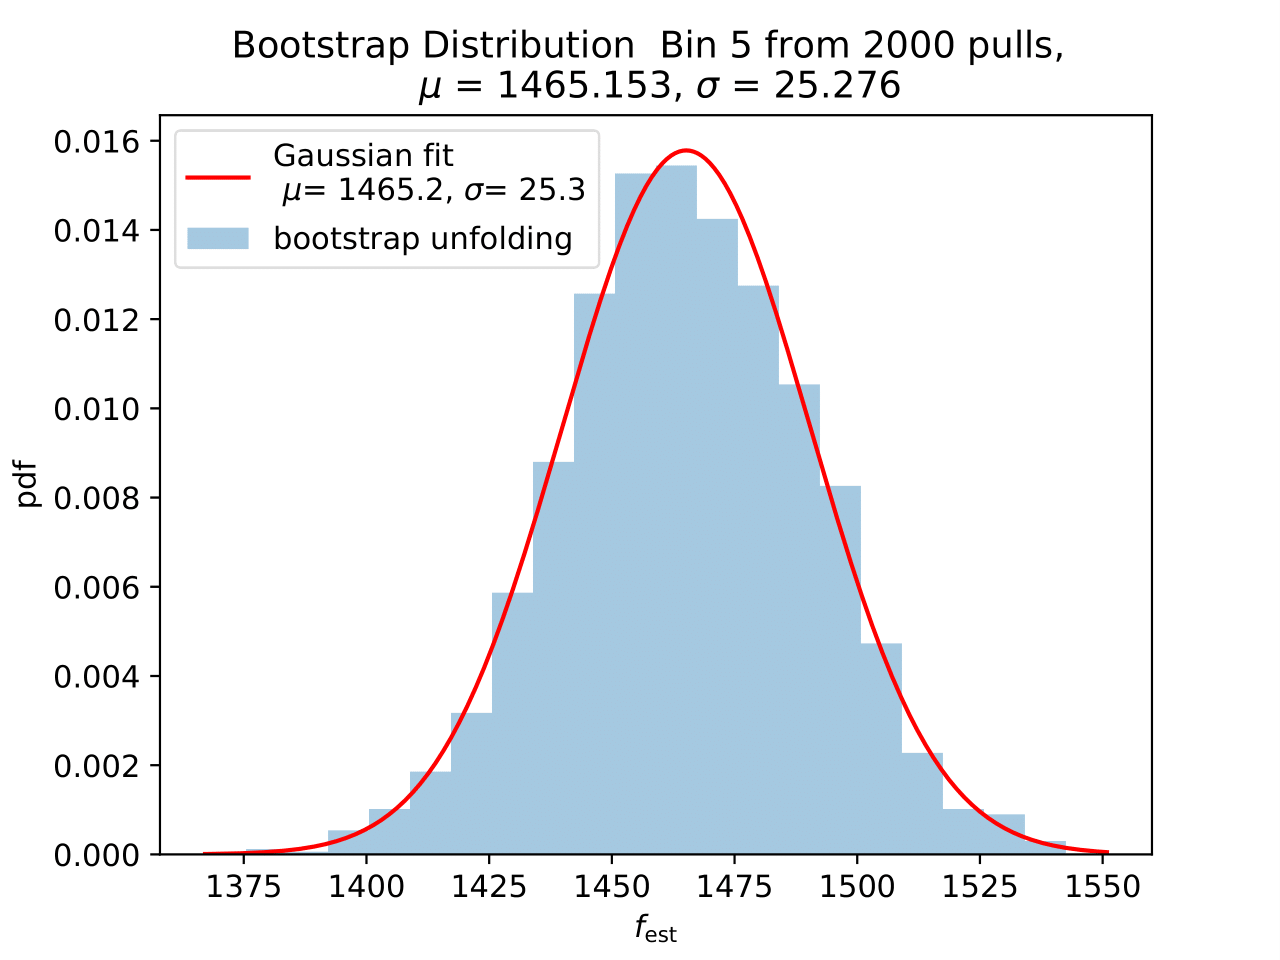
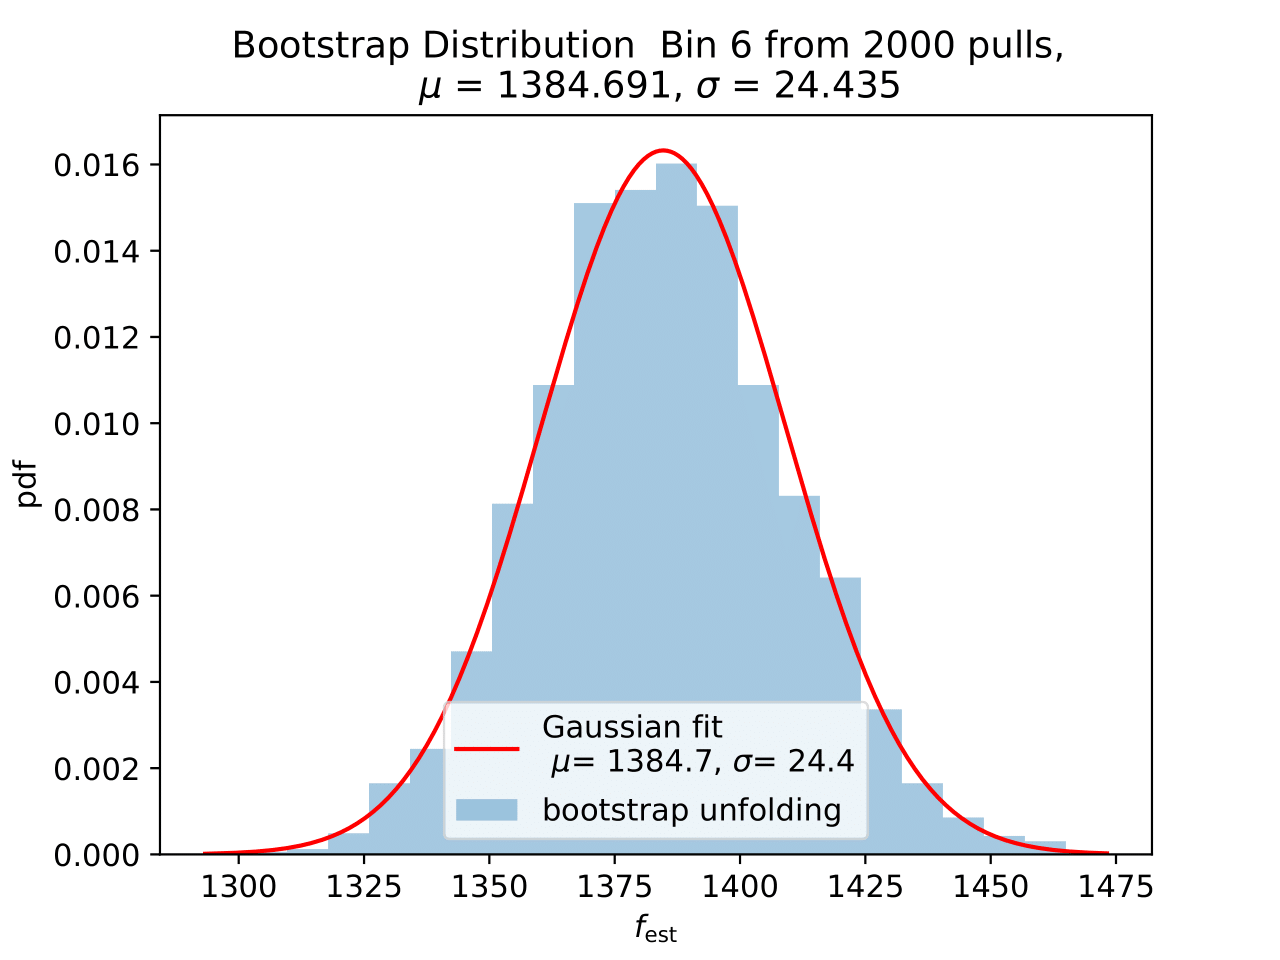
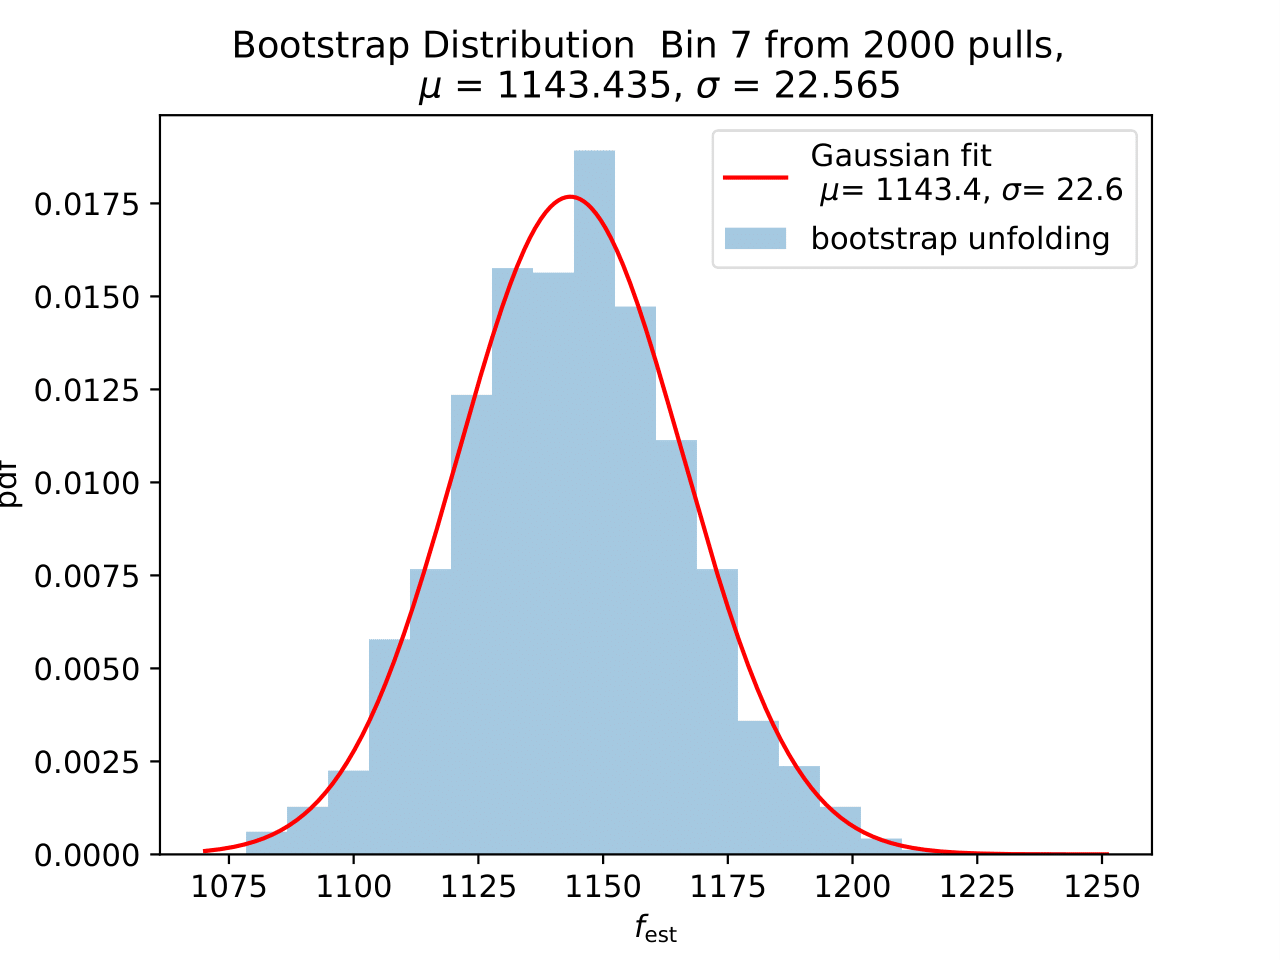
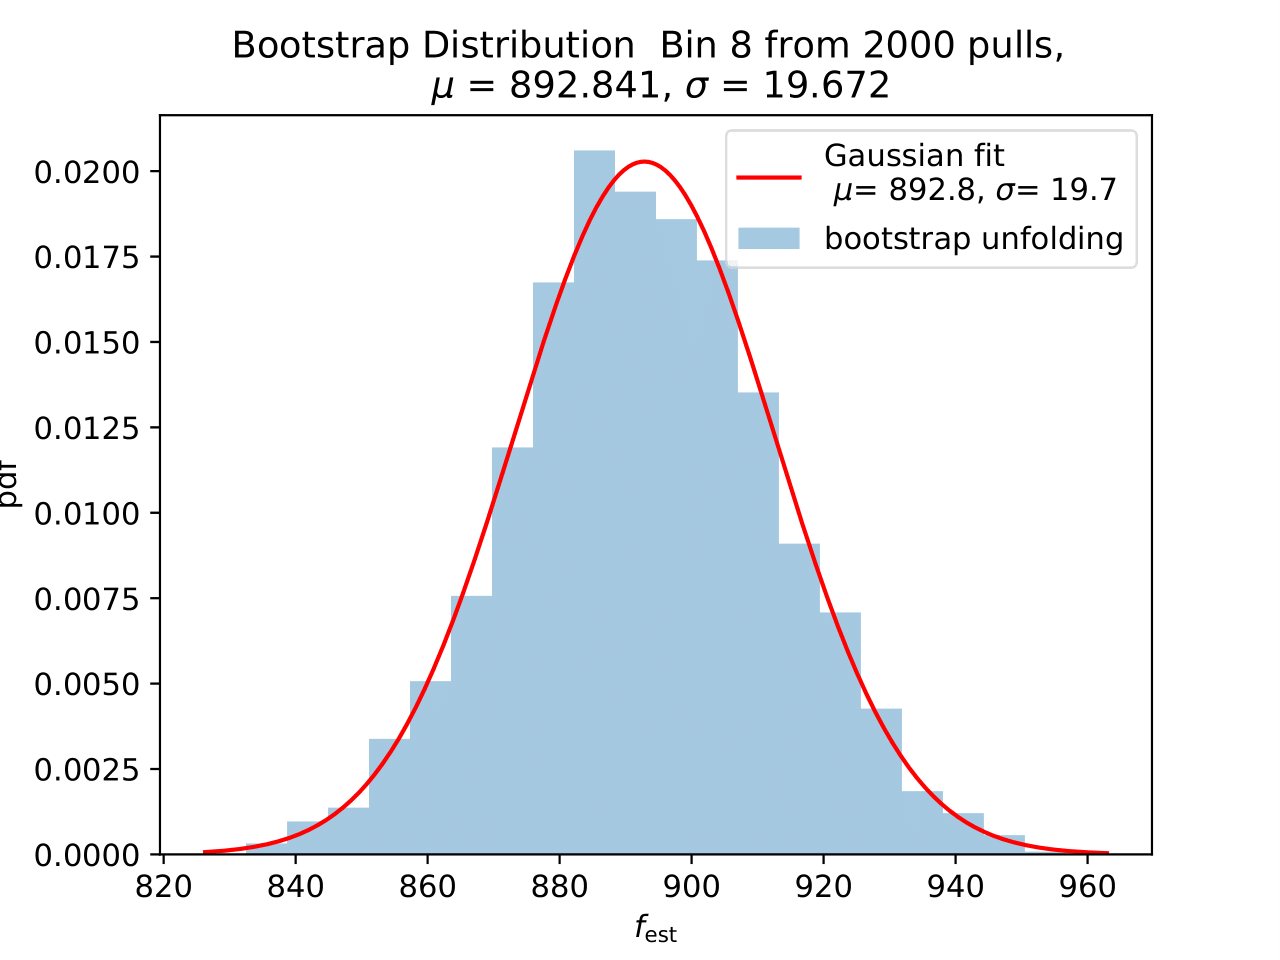
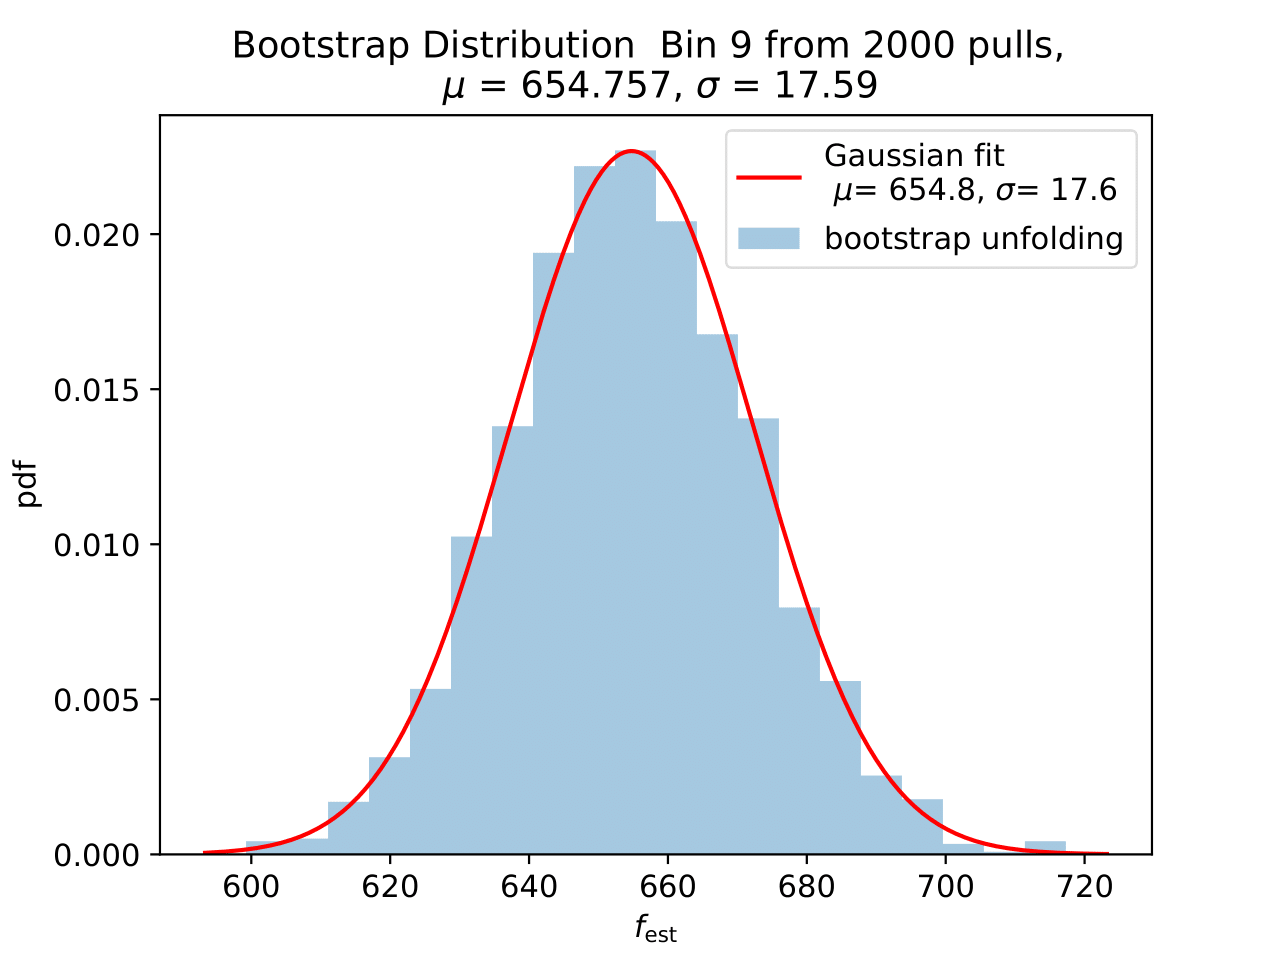
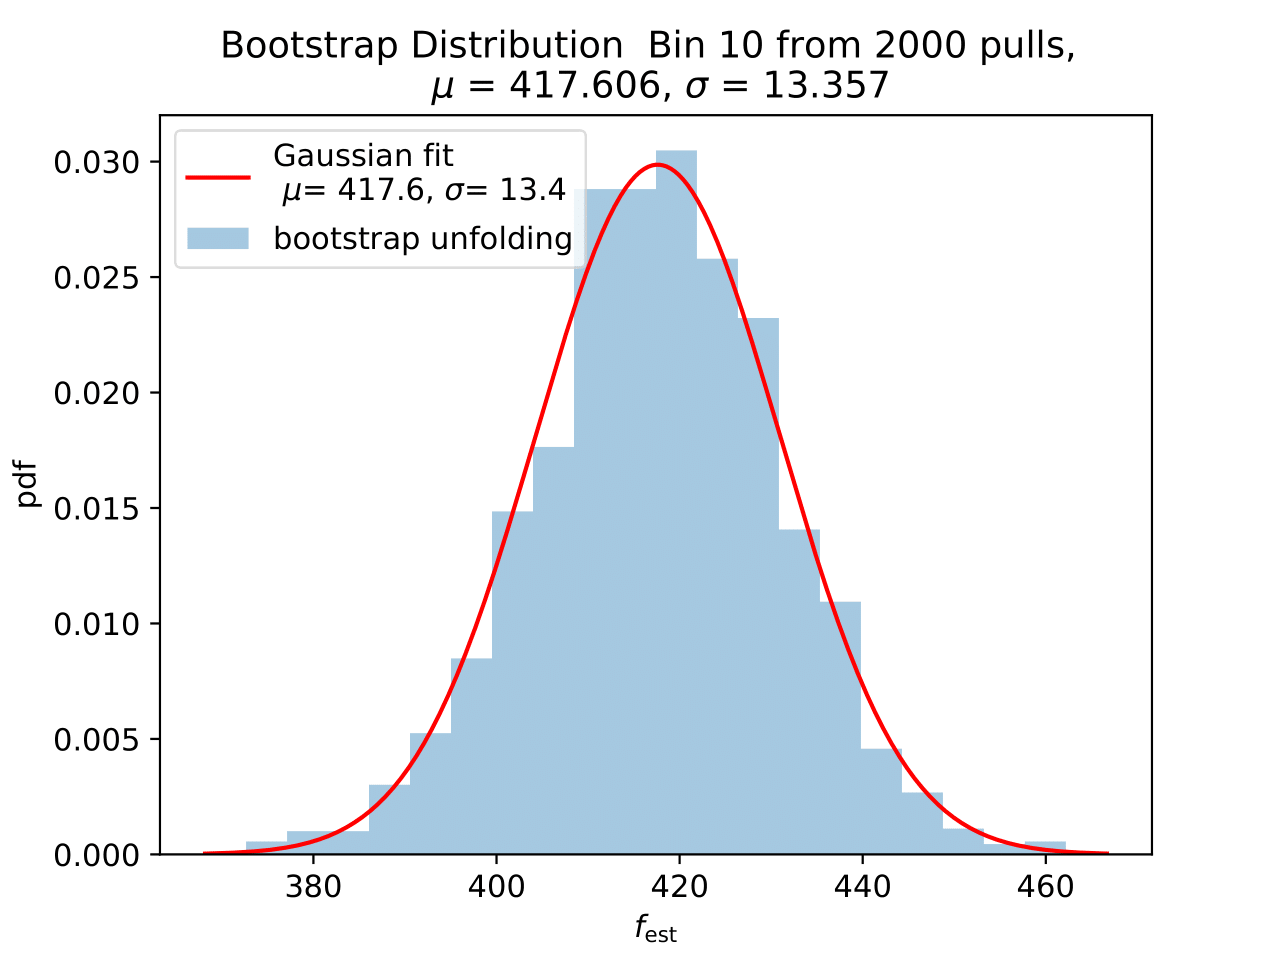
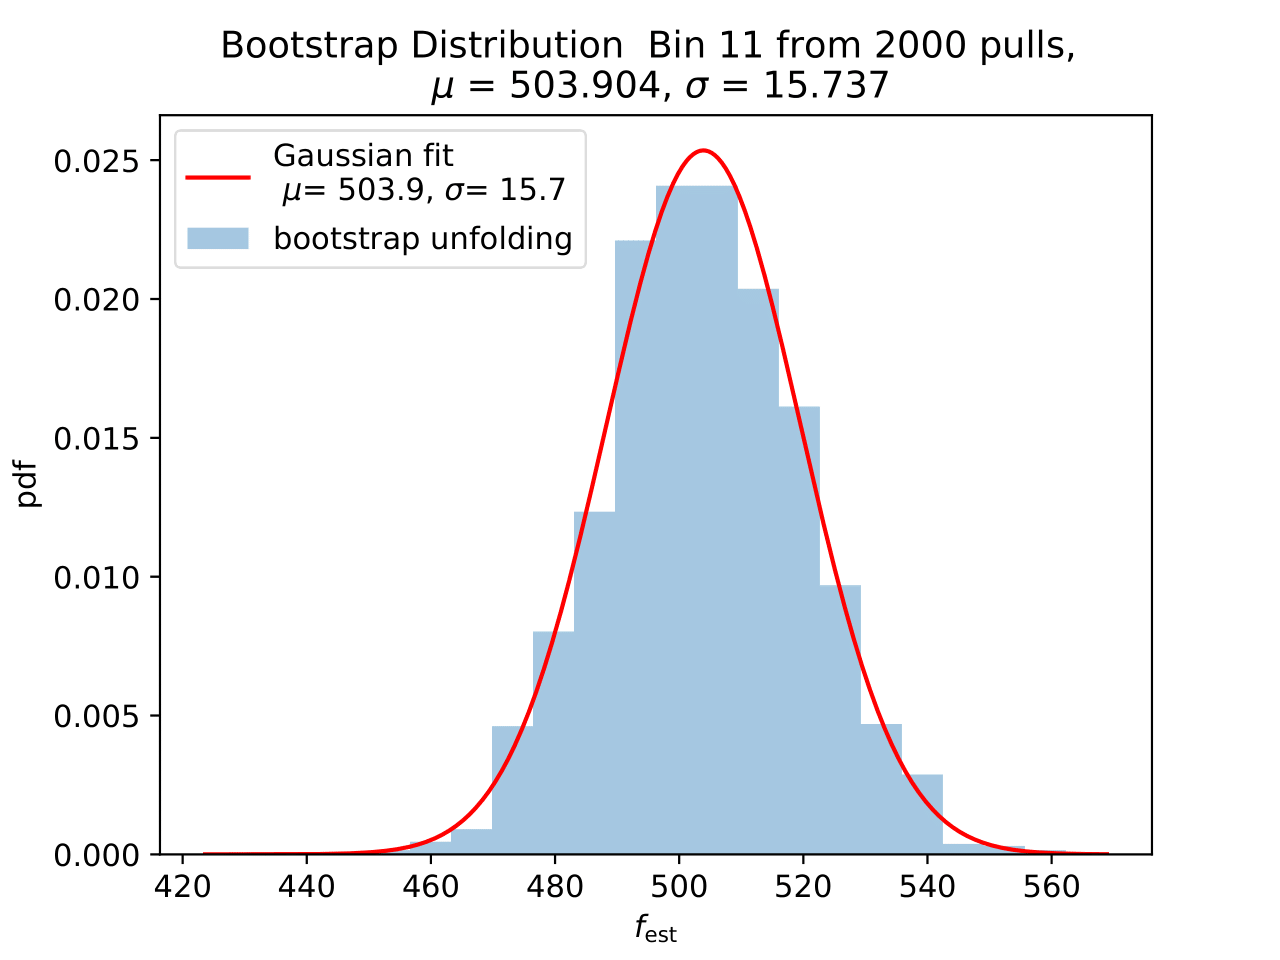
The determined statistical uncertainties are smaller than the square root of event number per bin and does not contain the uncertainty of DSEA. This is determined in the next part in terms of a systematic uncertainty of the unfolding algorithm and the impact of a changed parameter in reconstruction and simulation on the unfolde spectrum.
Systematic Uncertainties
Since DSEA is trained on simulated events, the unfolded energy spectra are affected by systematic uncertainties in the detector simulation. The impact of these effects is estimated from simulations with varied systematic parameters, similar to the approaches presented in the IC59 unfolding and in the Antares unfolding. This approach allows to determine how a change in a systematic parameter impacts the unfolding algorithm DESA. Pseudo-data sets and are sampled according to the weighting with MCEq (H3a, SIBYLL2.3c, MSIS00) plus astrophysical component. The ratio of the unfolded spectrum to the reference unfolding with the default systematic parameters becomes the systematic uncertainty of the parameter variation. Each uncertainty is combined in the squared sum for positive and negative deviations to the reference result and the total systematic uncertainty is given by:
These sources of uncertainty are considered:
DOM efficiency (21047): NuGen simulation with varied DOM efficiency by +/- 10%.
Ice model (21003-21006): NuGen simulation using SpiceLea model (depth-dependence of absorption and scattering coefficient, anisotropies).
The effect of absorption ans scattering is investigated separately by in-/decreasing the absorption/scattering coefficient by +/-5%
Hole ice (21047): the parameter p0 is in-/decreased by +/-1.
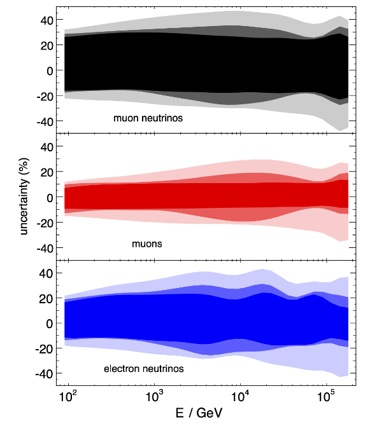
neutrino flux (hadronic interaction and primary cosmic ray composition applied on 21002): The hadronic interactions and the primary cosmic ray composition uncertainties are not considered in the Honda2006 model (except cross section of the kaon and pion production). The effect of both sources of uncertainty is investigated in in this paper. The uncertainty of the neutrino flux is displayed in Table 1. All primary models (cHGp, cHGm, ZS-PAMELA, poly-gonato and GH) an three hadronic models (sibyll-2.1, qgsjet01c, qgsjet-II) are included. The uncertainties are interpolated linearly on a log-scale in energy between 0.1 TeV and 10TeV in the same manner as for the Honda2006 uncertainty for pass1 MC.
The uncertainty calculations are slightly more conservative as predicted by Barr. Hence, the uncertainties might be slightly overestimated. However, they will shrink on the complete data set because they are estimated in a bootstrap approach. This can be seen as the uncertainty of MCEq flux calculations.
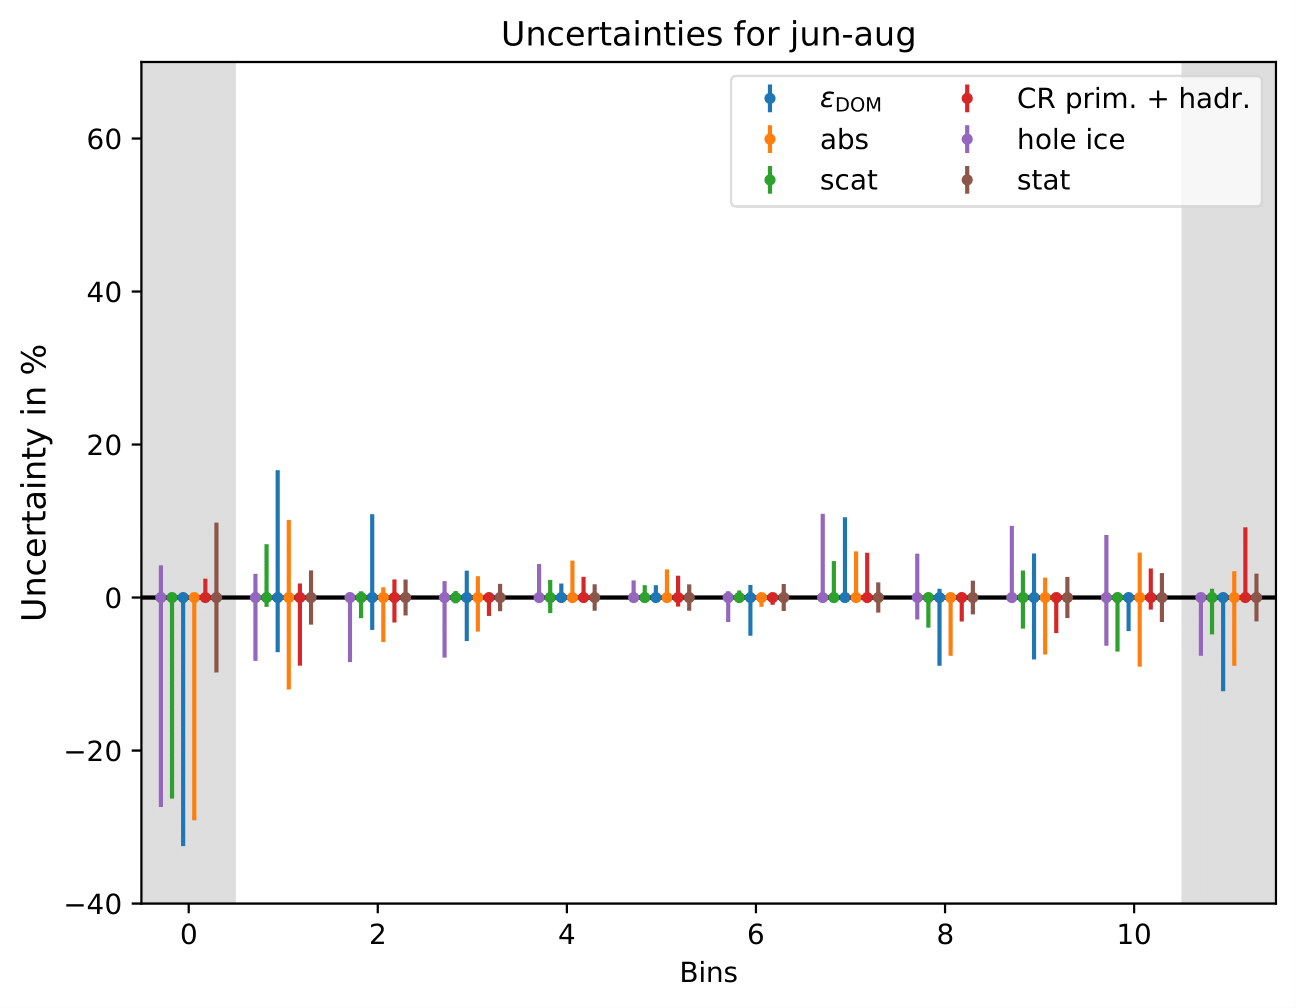
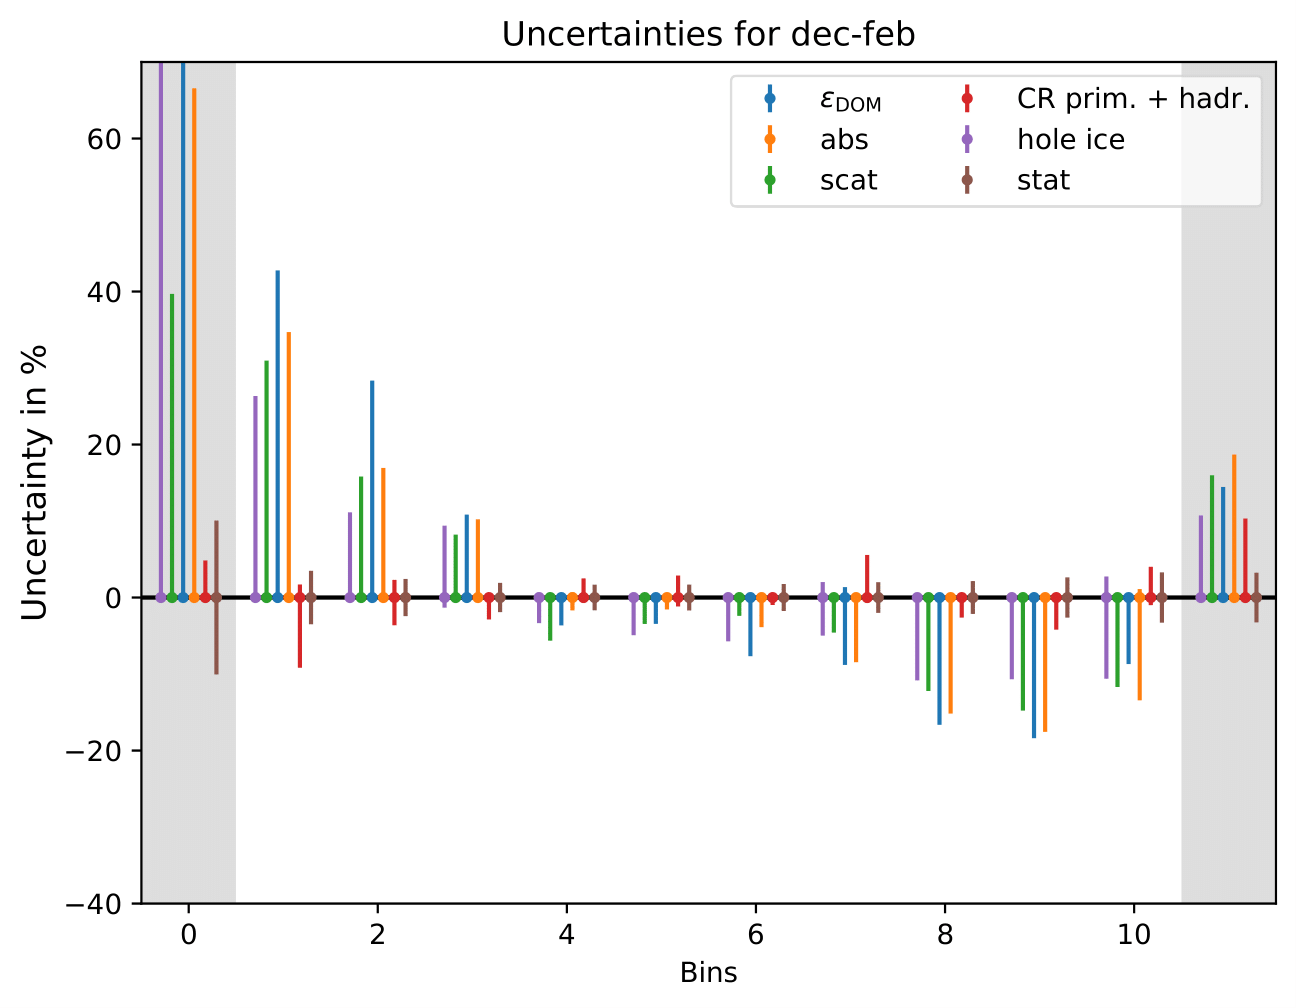
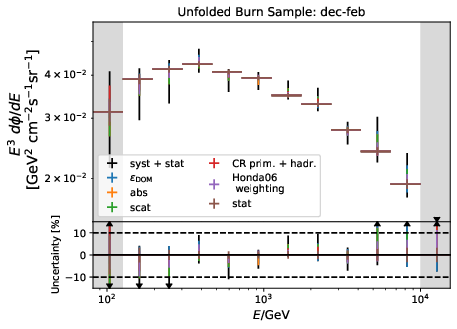
Important is that the determined uncertainties for each parameter do not represent the uncertainty of the parameter itself, but its impact on the unfolded spectrum. Even though the number of events is set to the expected/the exact number of events in the data set, the number of events is not important for the determination of the uncertainties. The uncertainty that is determined here is a relative uncertainty on the spectrum since two unfolded spectra are divided by one another. Hence, the uncertainty remains the same for every season and return the systematic uncertainty of the unfolding. A varied systematic parameter is seen as a different spectrum to be unfolded by the algorithm. This approach determines the systematic uncertainty of the unfolding by different origins of systematic parameters in simulation and reconstruction. The determined error bars are asymmetric and represent a systematic shift of the unfolding algorithm. Whereas the medium range energy bins with energies around 1 TeV have a small uncertainty, the bins at lower and upper edge have high uncertainties. The reason for this is given by the number of events that are used for training the algorithm. Both lower and high energy bins have less events.
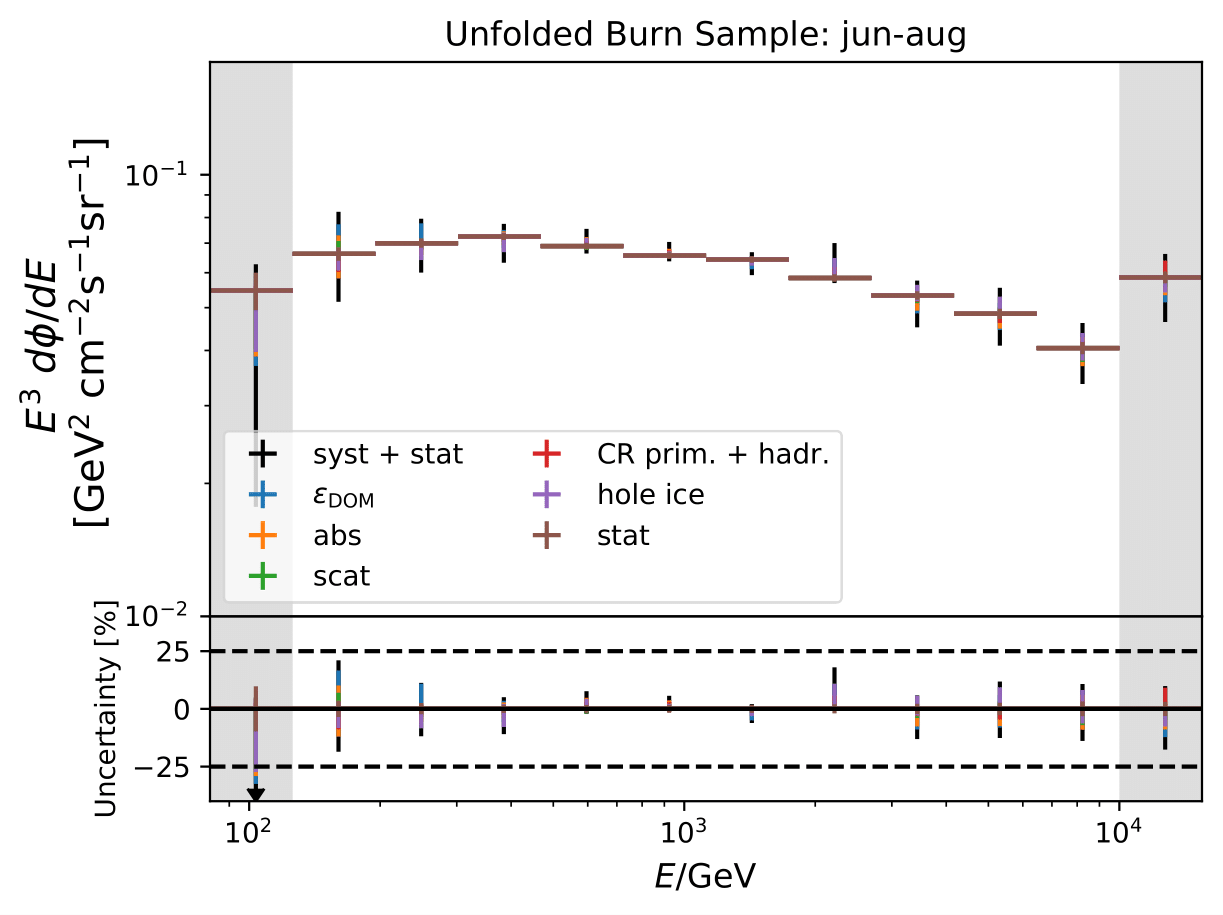
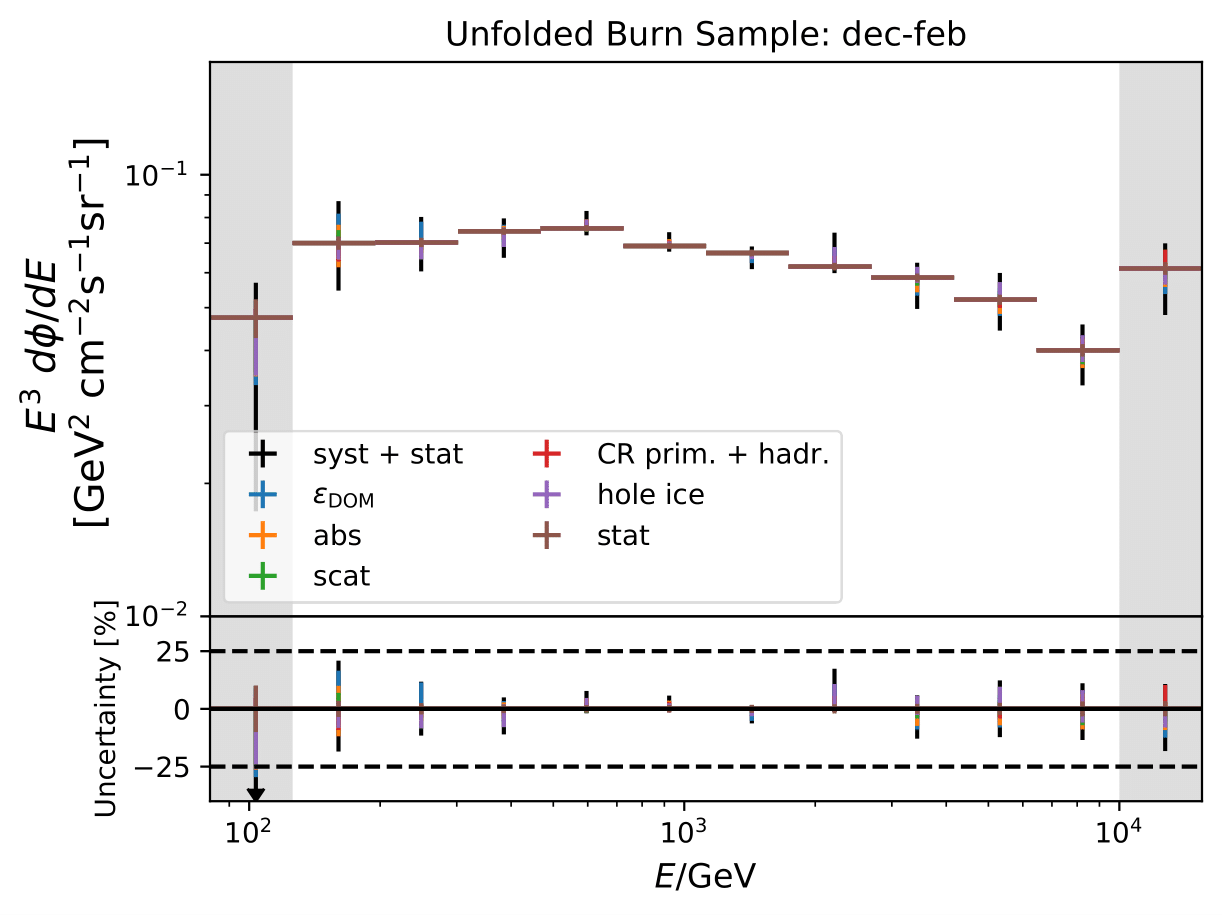
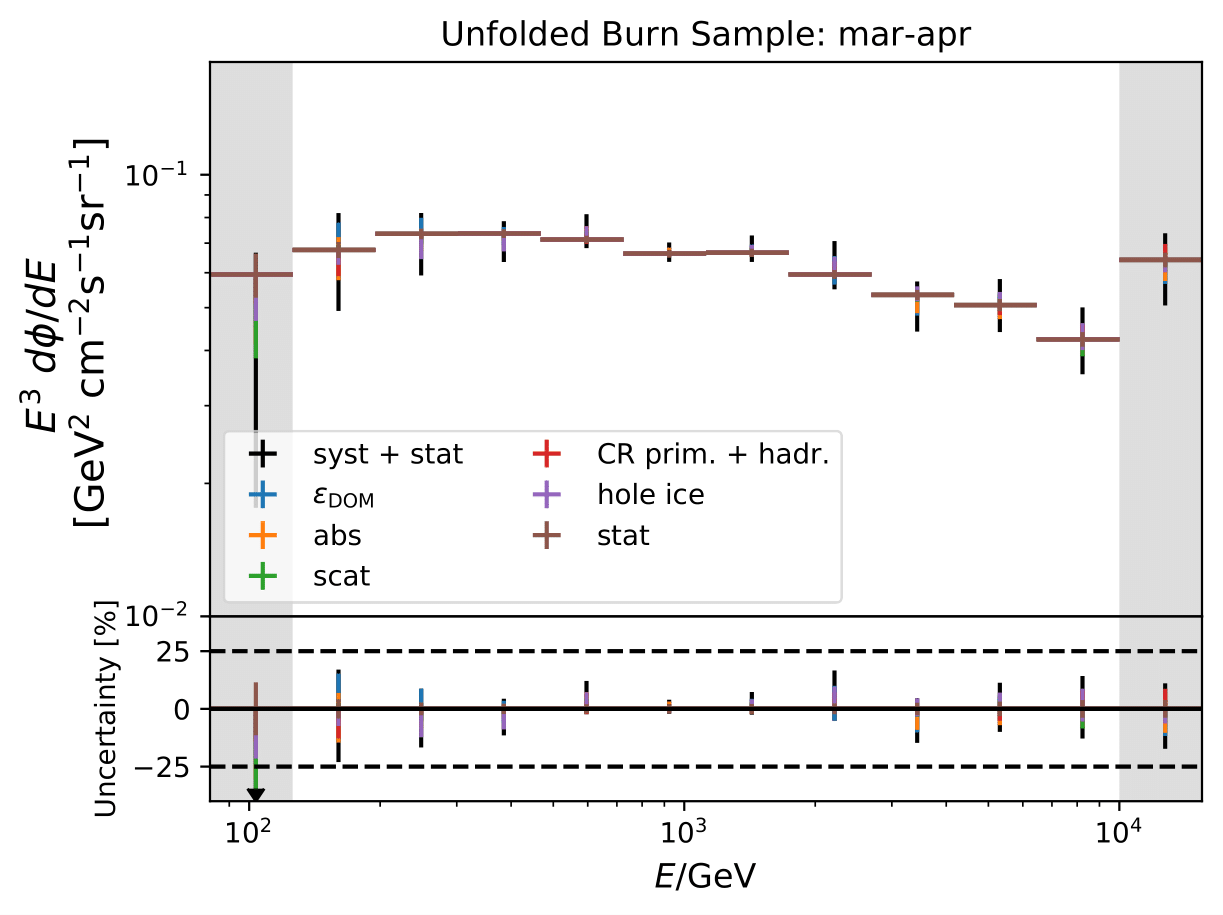
Unfolded seasonal spectra with the corresponding uncertainties for burn sample:


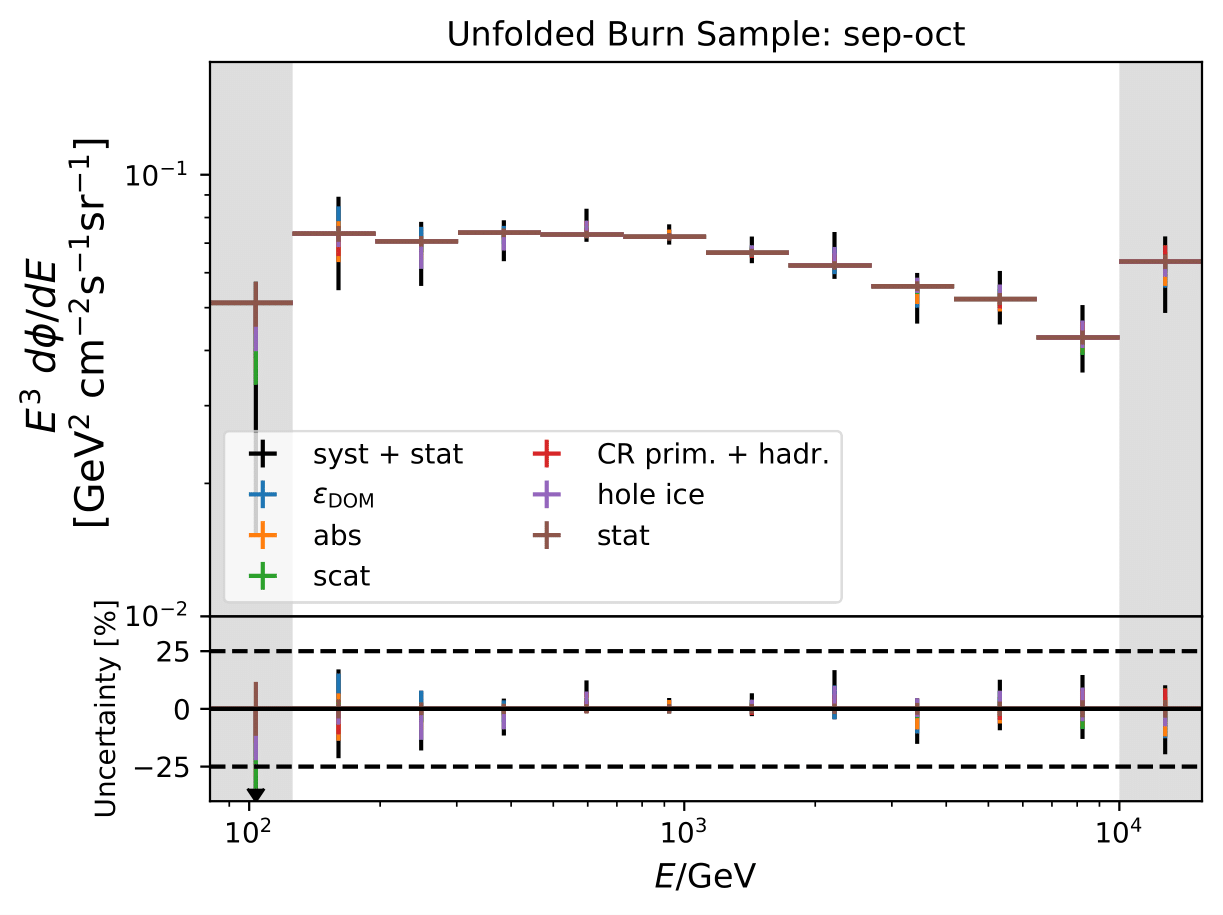
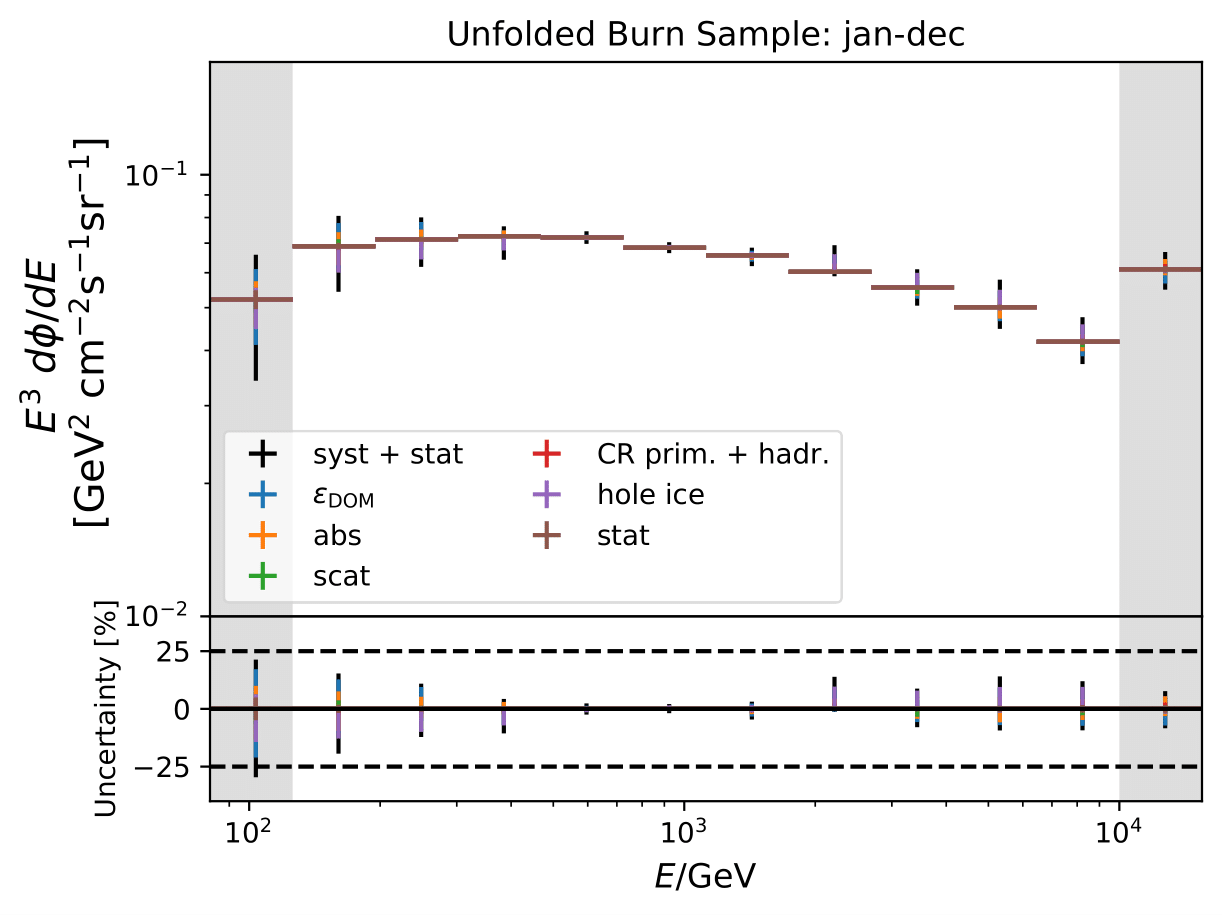
Relative uncertainties for seasonal burn samples:
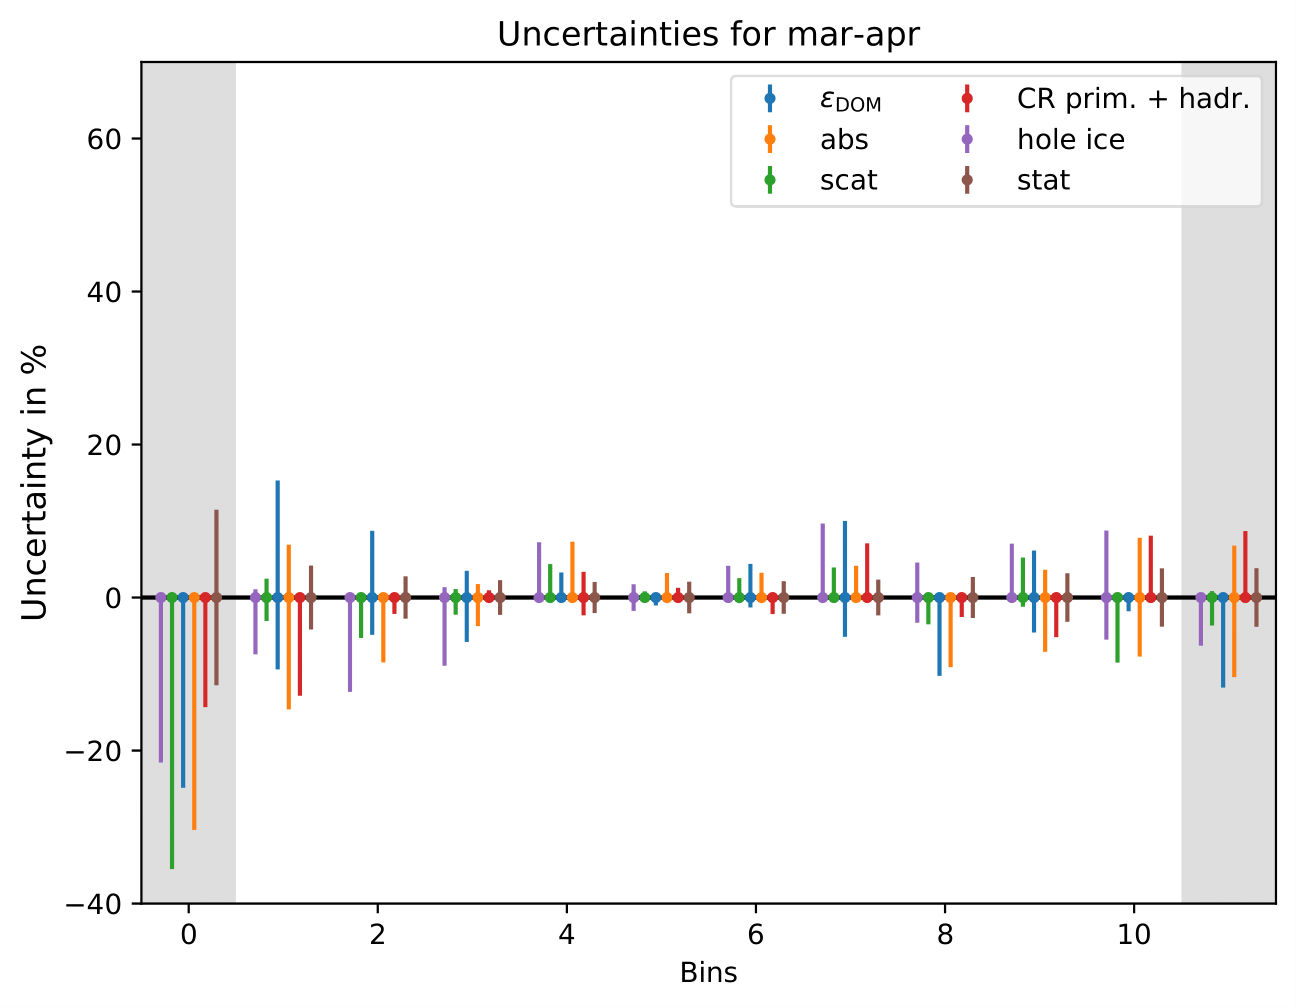

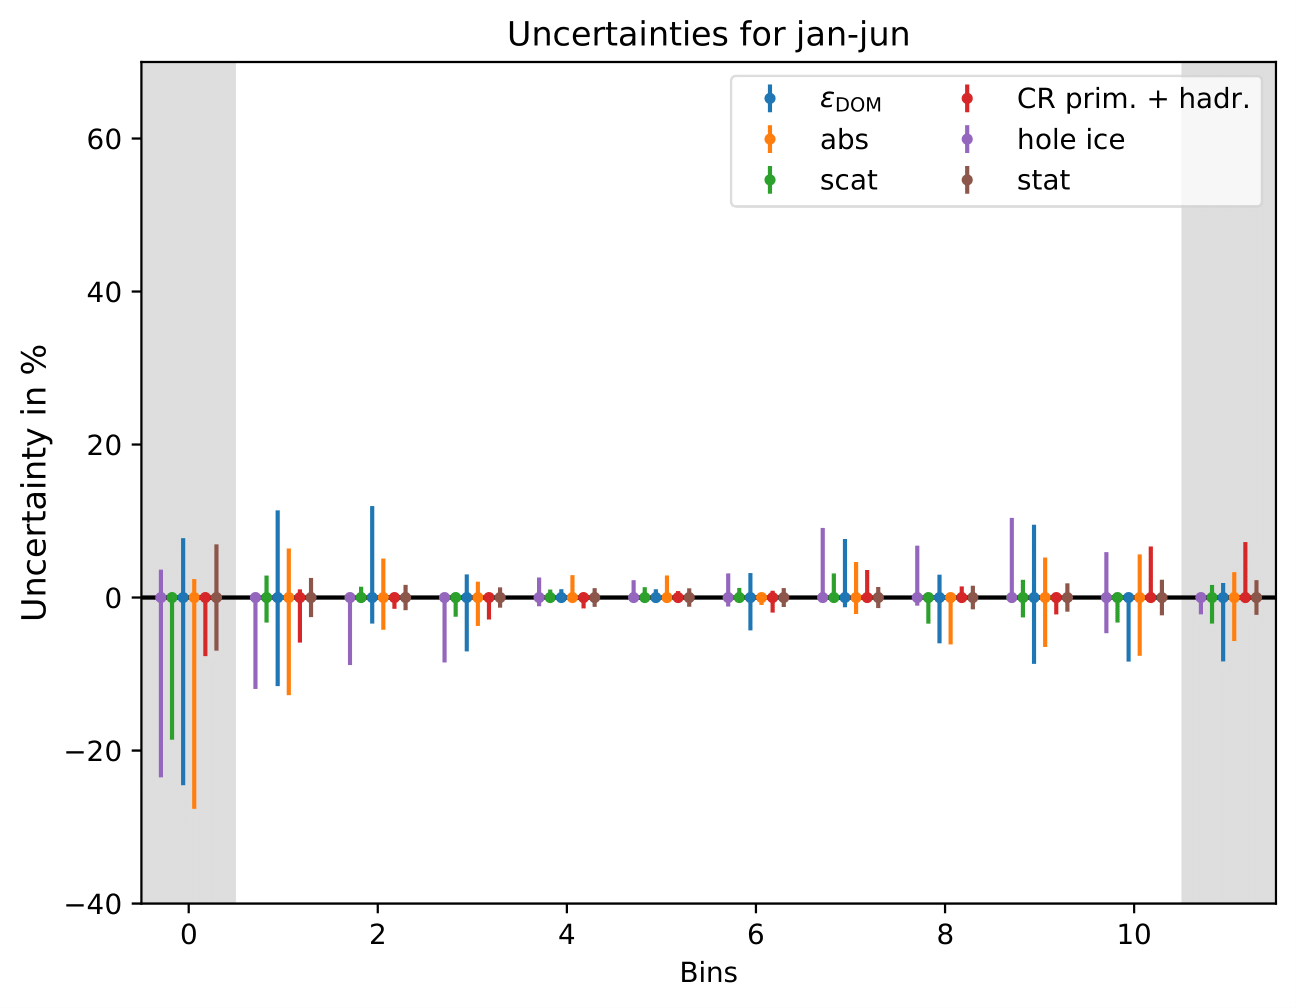

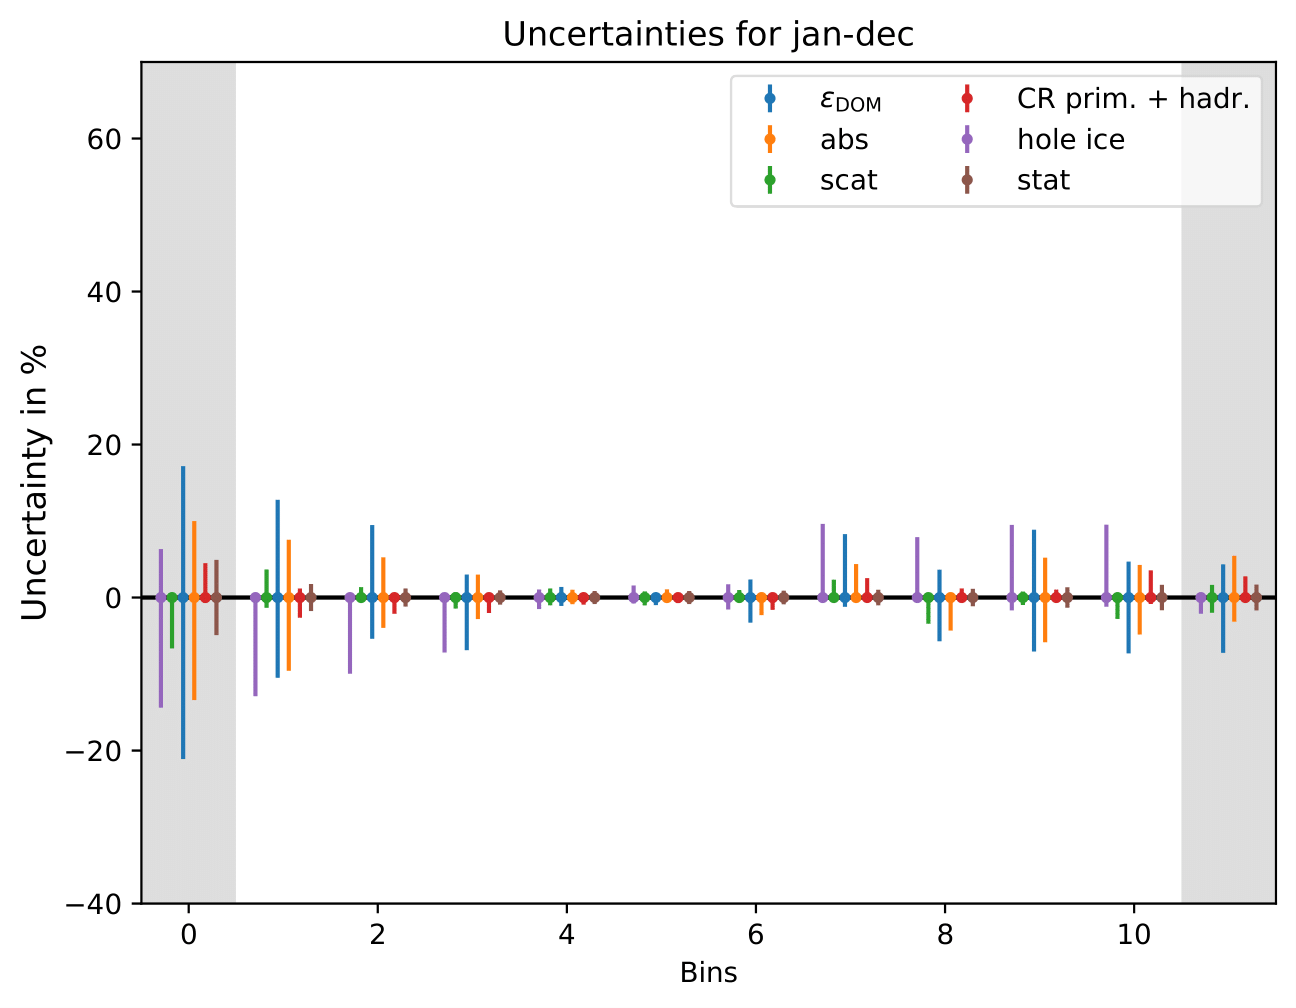
Unfolded seasonal spectra of MC estimation (seasonal MC predictions, number of events: burn sample size x 10) of full sample:


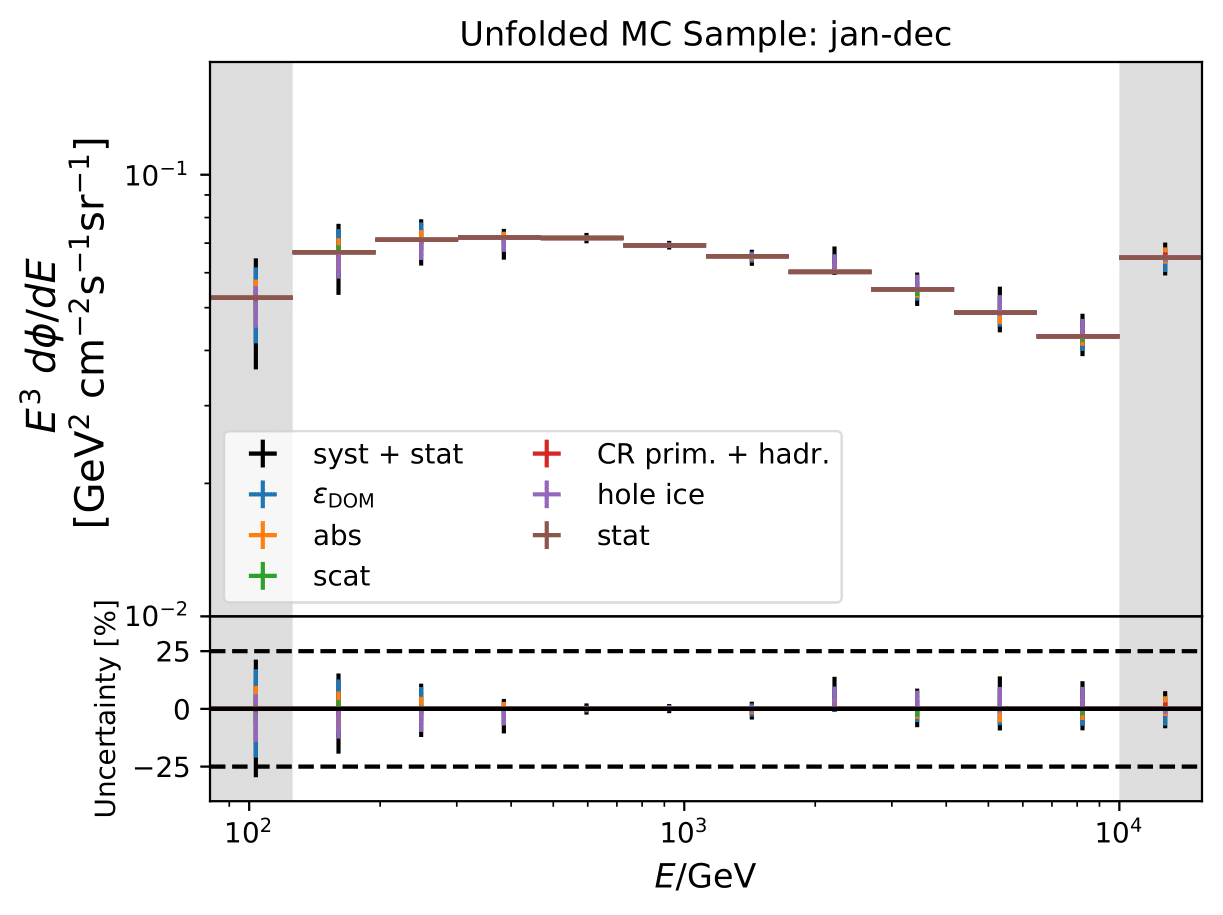
Expected relative uncertainties of full sample (here: MC unfolding - see description above):
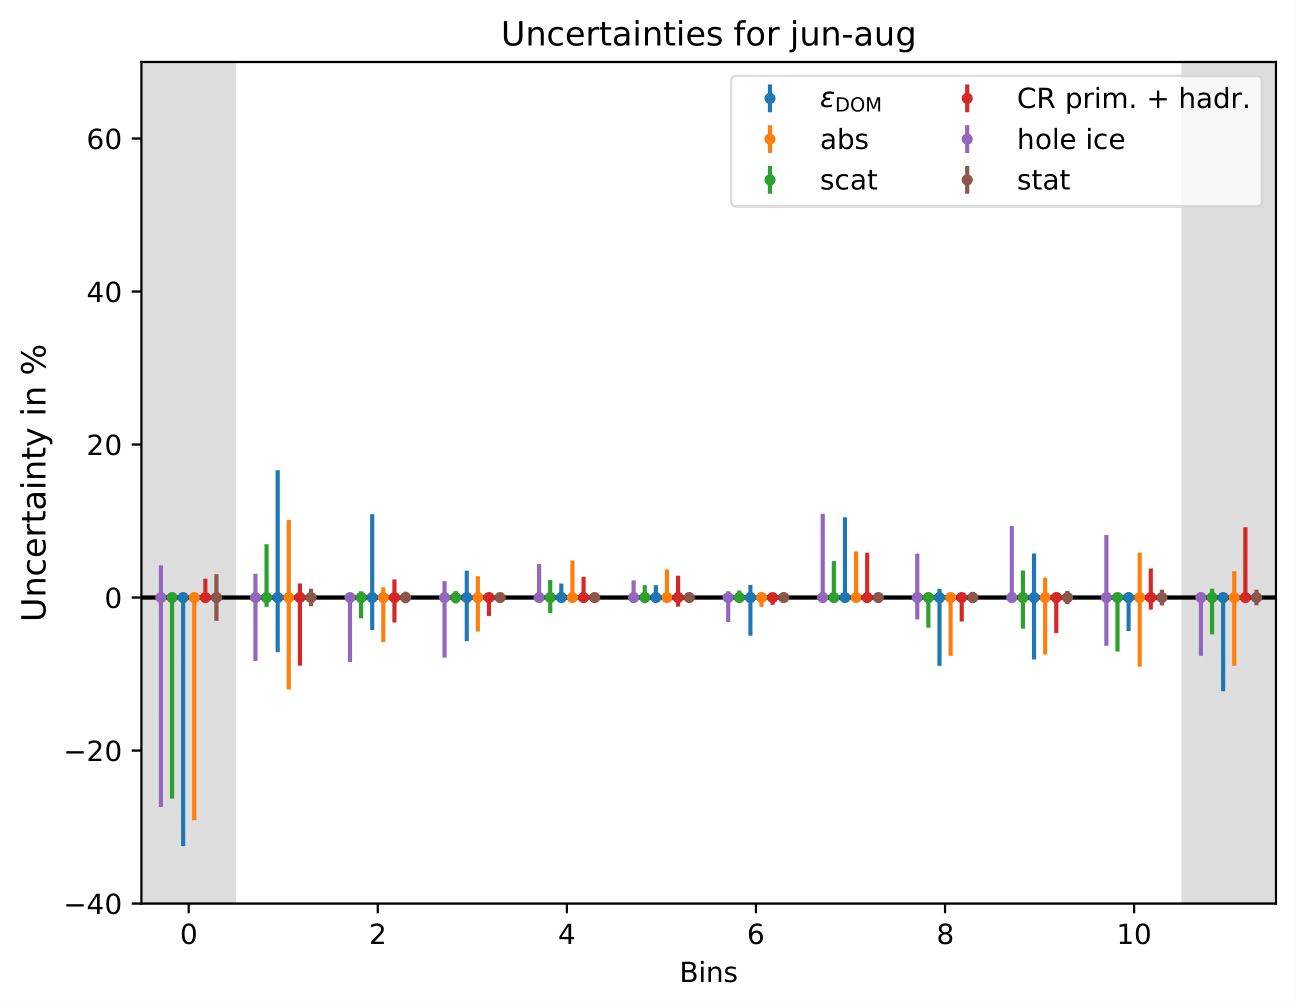
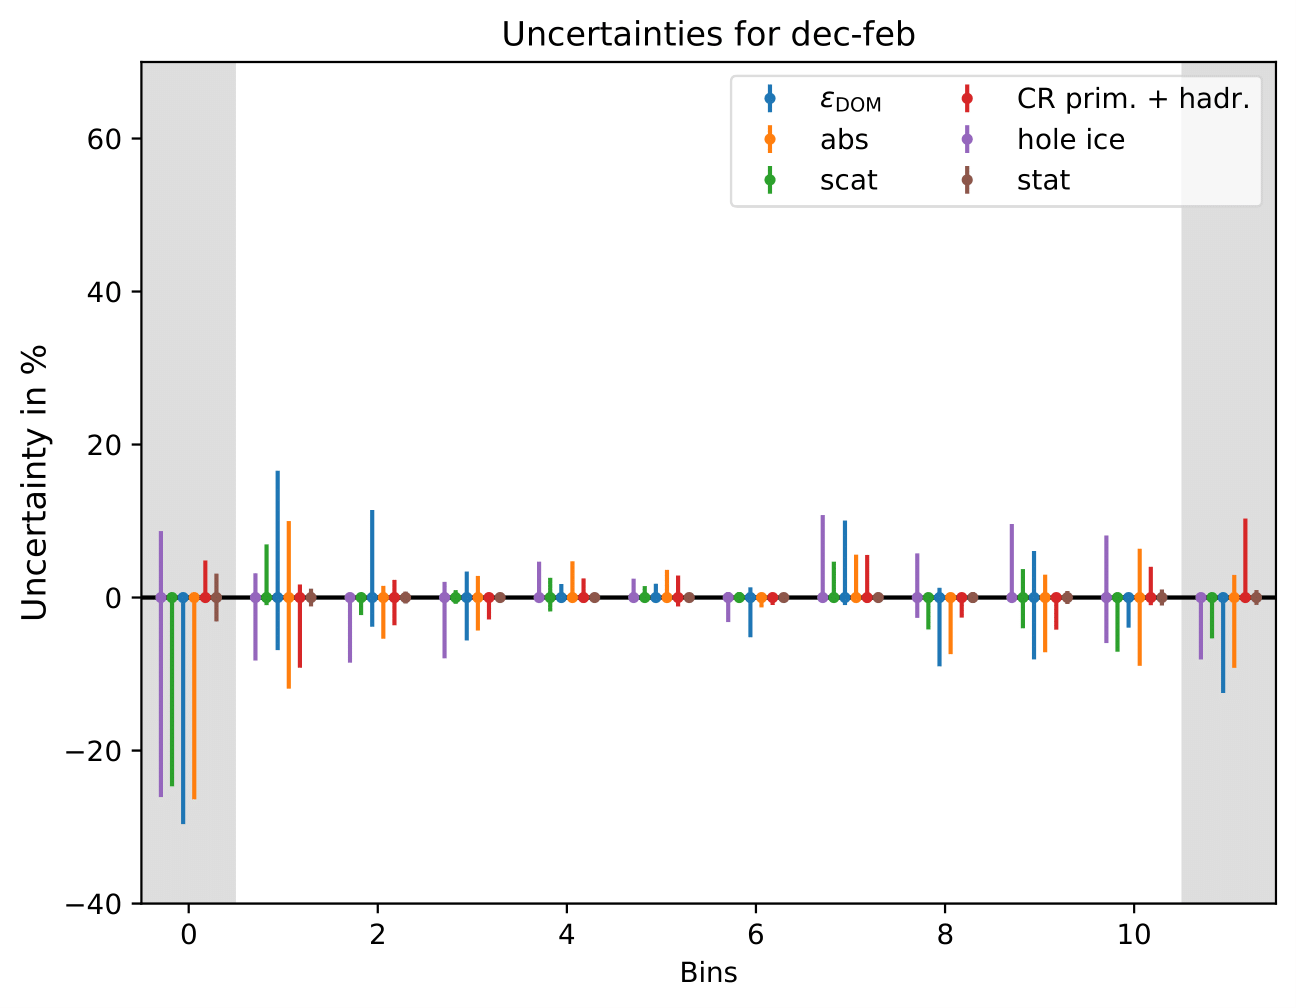
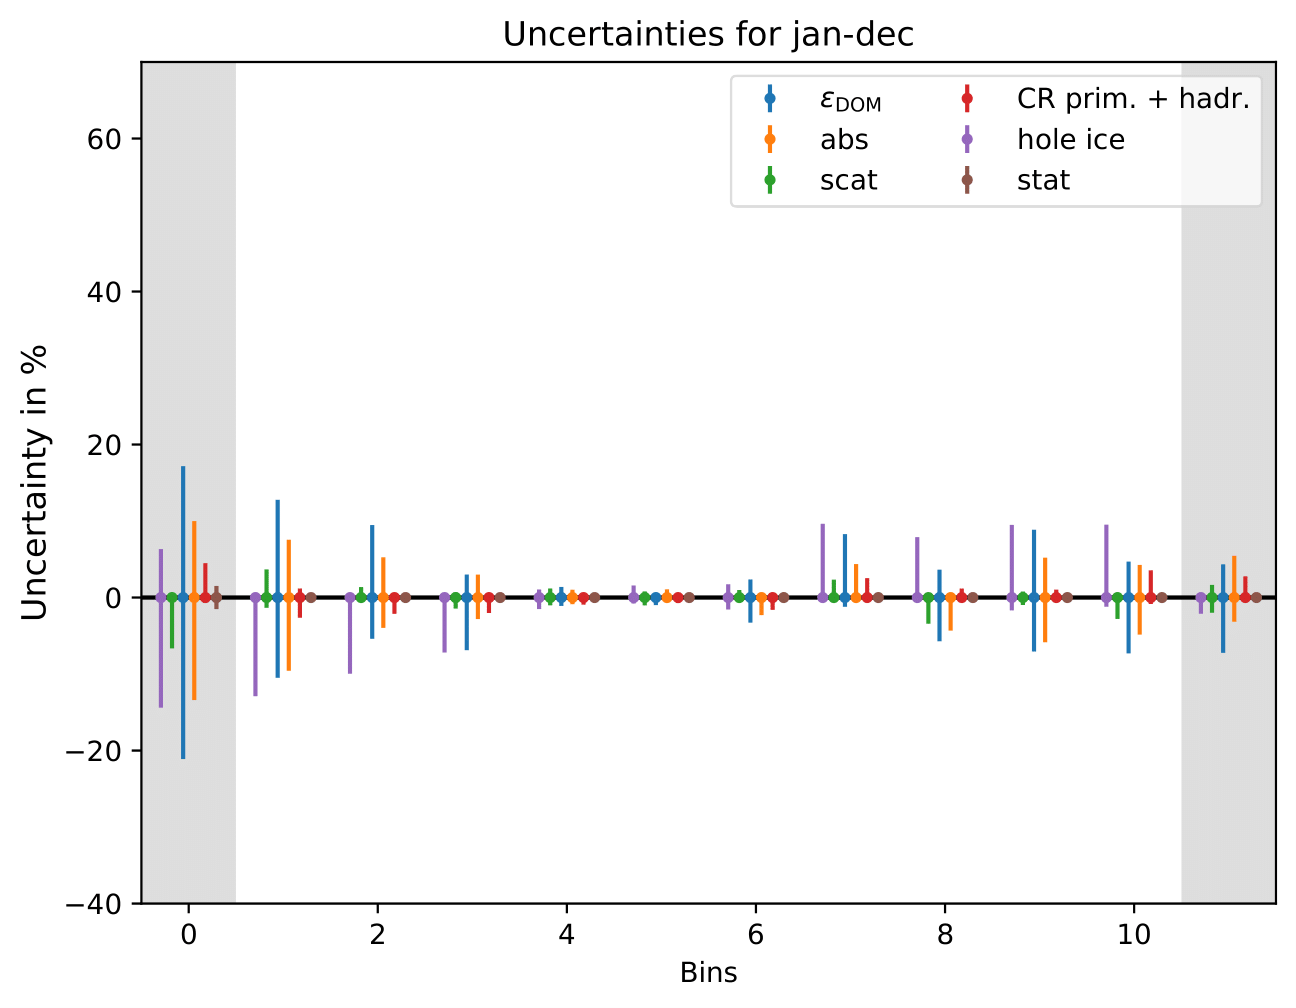


The uncertainty is independent on the underlying statistics, as expected. The uncertainties are determined from the ratio of the mean unfolded number of events per bin of the different systematic MCs. The statistical uncertainty is the same, as the same season is unfolded, and cancels in the ratio.
One fact to be noted is that the uncertainties increased compared to the analysis performed on Pass1 MC. Comparing the single sources of uncertainties that remained same with respect to the old analysis (DOM efficiency, ice model parameter uncertainty increased, Honda uncertainty neglected), the uncertainty increasing using Pass2 MC. The reason for this is given by MCEq weighted MC as input MC into DSEA. MCEq represents a flatter spectrum than Honda2006 flux (which was used as weighting for Pass1 MC) so that upper and lower bins are over-/underestimated and biased to a larger extent than before. Denote a different scaling in the y-axis compared to Pass1 MC.
Effective Area Uncertainty
The effective area has been calcualted using only 10% of the available MC. The deviation from the effective area obtained using full sample is smaller than 1%. Hence, no additional uncertainty will be added.
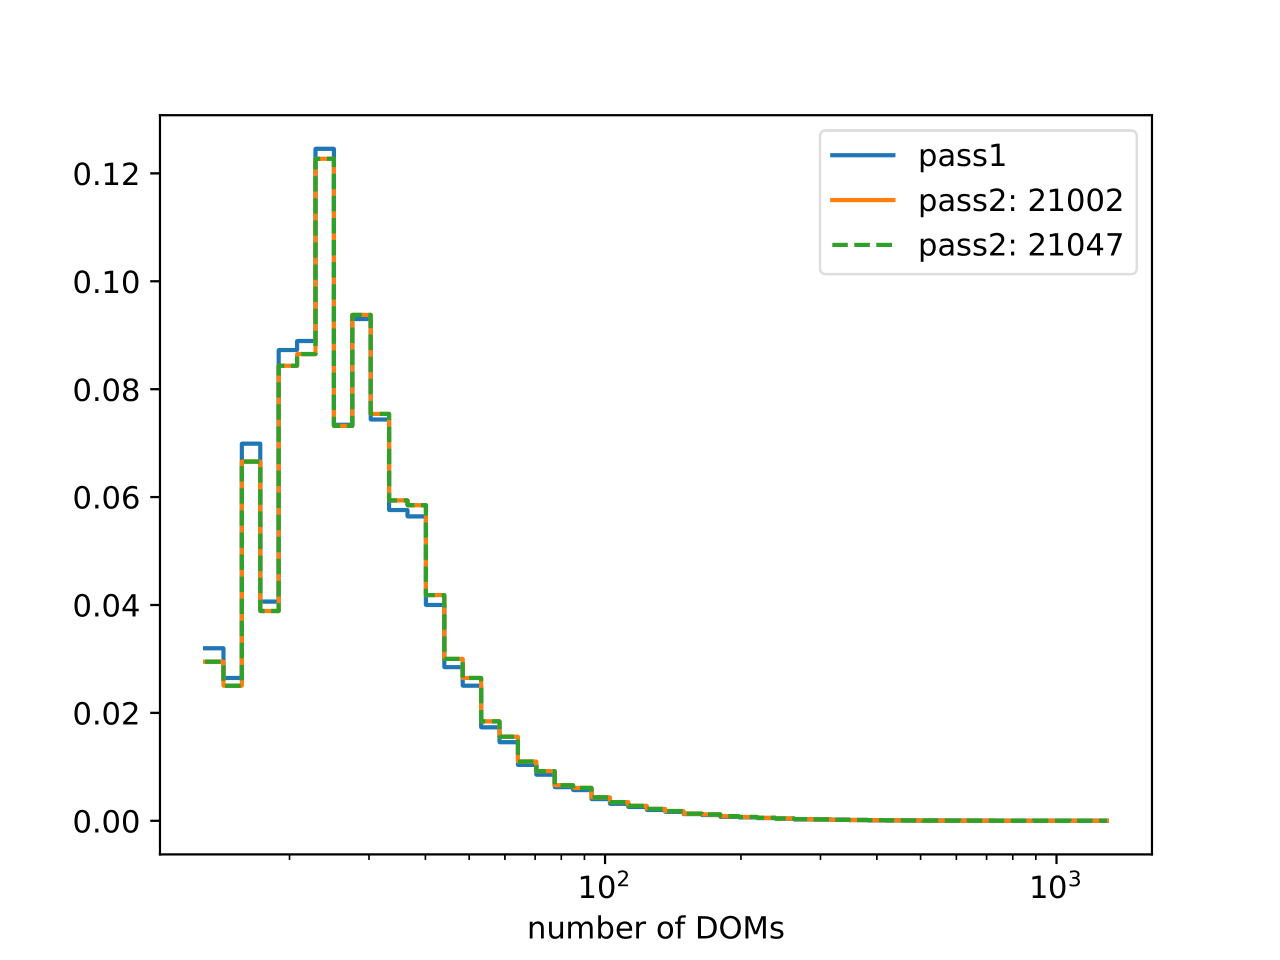
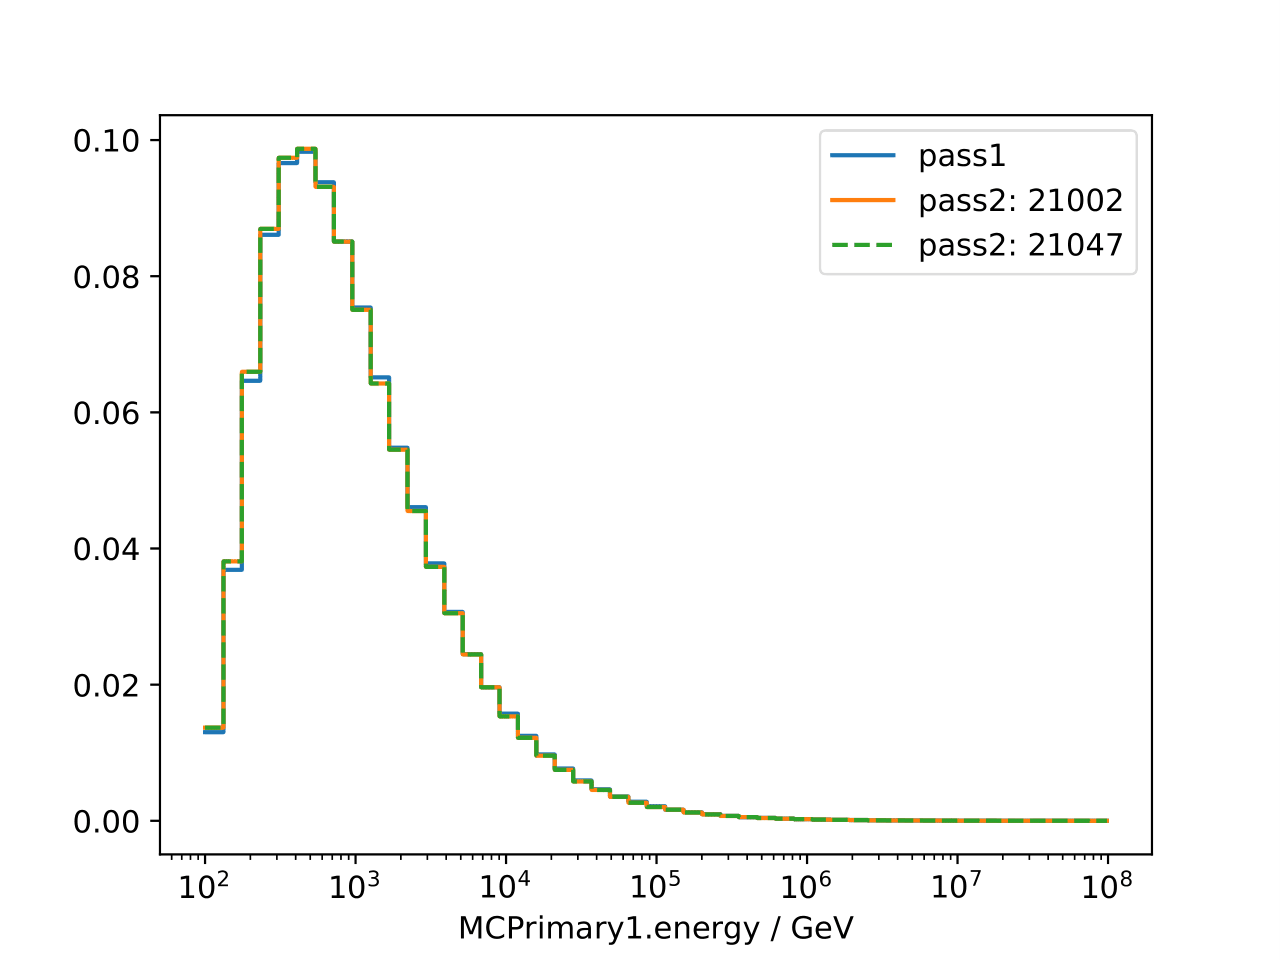
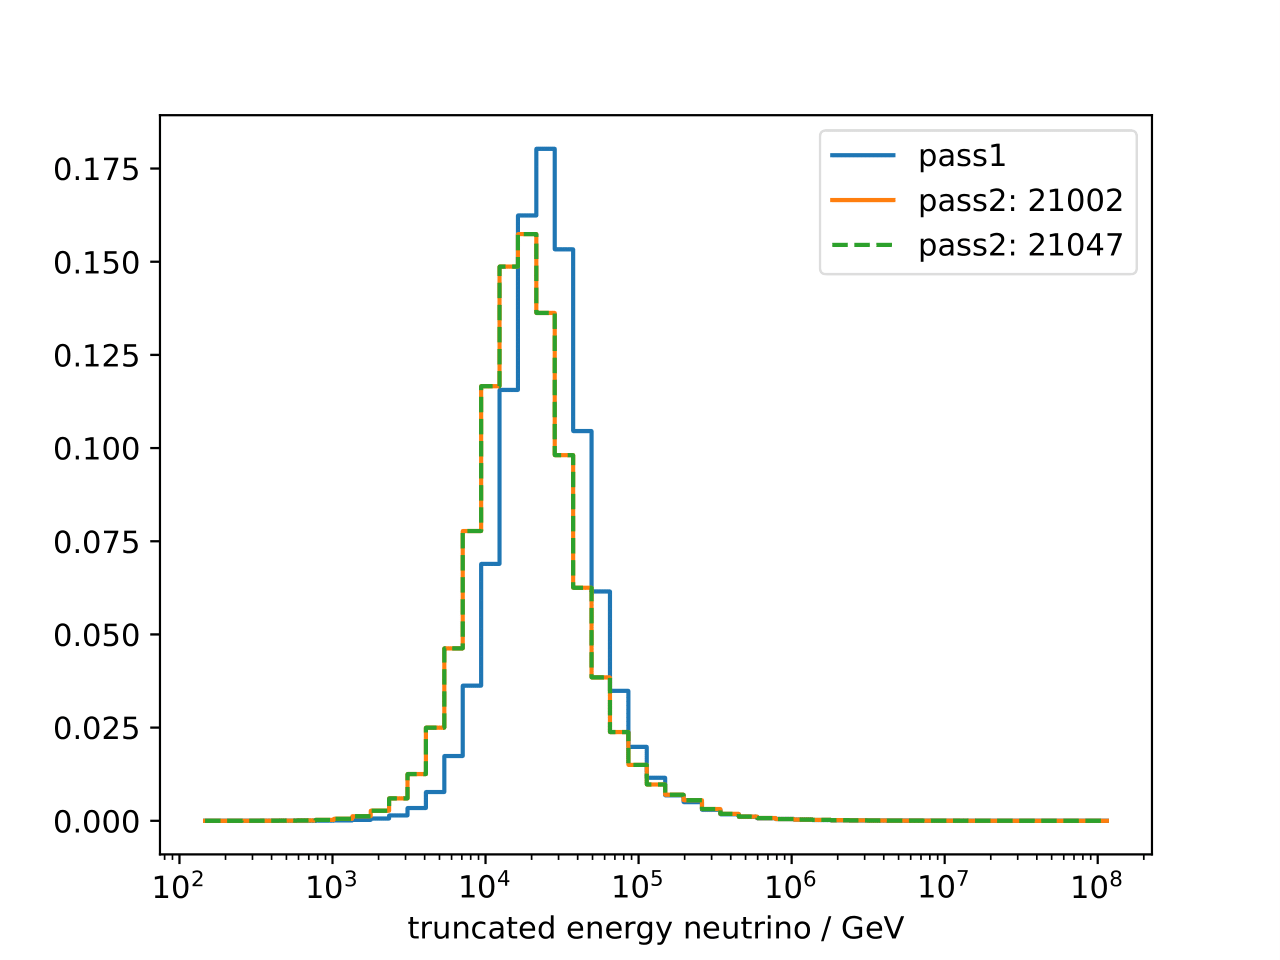
Comparison Pass1 vs Pass2 MC
Comparison of unfolding variables and truth for pass1 and pass2 MC. Whereas the distribution of true neutrino energy stays the same, the distribution of the unfolding variables differs, as expected, between pass1 and pass2. Large differences can be observed in the truncated energy estimator, whereas the differences in the number of DOMs remains small.
Confusion matrices: Concerning the confusion matrices of random forest, the correlation with energy is stronger for pass1 MC.
DSEA parameter optimization:
Best Wasserstein Distance for pass2MC on best variables: 0.00119 Best Wasserstein Distance pass1 MC on best variables: 0.00052 (\(E^{-2}\))