2000-2006 AMANDA Point Source Analysis
Event Selection
Methodology
Sensitivity & Discovery Potential
Unblinding Proposal
Results
Questions and Answers
Systematics, Publication, and Figures
LS I +61 303 Periodic Analysis
Solar WIMP Analysis
 |
| NASA/ESA Hubble |
Analysis for Periodic Emission from LS I +61 303
Introduction
LS I +61 303 is a galactic microquasar with well-studied radio [1] and non-thermal x-ray [2] signatures showing a ~26.5 day periodicity. Observations by MAGIC in a very recent paper show a similar periodicity in TeV gamma ray fluxes [3], with TeV high state occurring at the same phase as the x-ray high state. The MAGIC measurement [3] is shown below.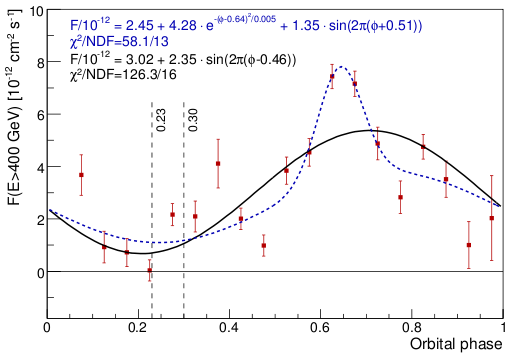
It is reasonable that neutrino fluxes would show a similar periodicity, and an analysis for periodic neutrino emission was suggested by Elisa R. at the Spring 2008 collaboration meeting. This analysis has several goals:
- Use the potential periodic nature of neutrino emission to enhance discovery potential
- Determine the most likely phase of maximum neutrino emission
- Develop a method to achieve the above two goals which can be applied to any periodic source and can be used in future IceCube analysis
We use the 7-year AMANDA-II data set.
Analysis
The image below shows the number of events recorded at L3 as a function of LS I +61 303 orbital phase. We use the phase parameters of [4], with T = 26.496 d, To = 43366.275 (MJD).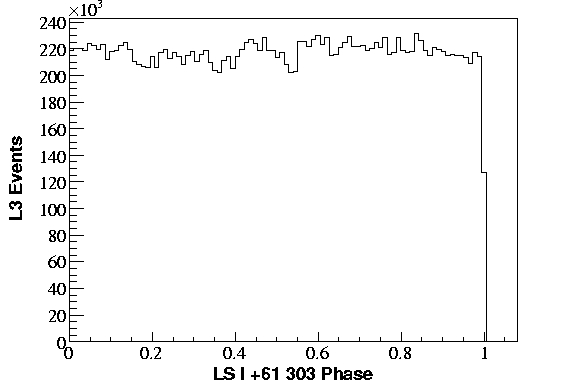
Thus, the phase bias of the dector livetime is ~7% and can be neglected for this low-statistics analysis. We adapt the unbinned maximum likelihood search method used in the 7-year AMANDA time integrated analysis to include time structure with a periodicity of 26.496 d. We assume the signal has a Gaussian distribution in phase. The signal PDF in the likelihood function is now:
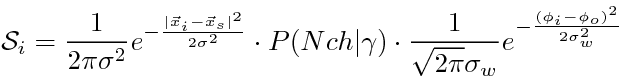
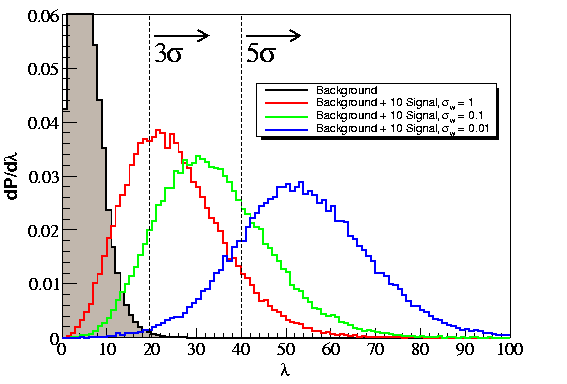
where φo is the phase of maximum emission, φi is the phase of the current event, and σw is the Gaussian width of emission in terms of LS I +61 303 phase (i.e. if 68% of the emission occurs between ±2.65 days of the maximum, σw = 2.65/26.496 = 0.1). The width of emission and phase of maximum emission can be fitted along with source strength and spectral index, giving 4 total parameters to fit. We simulate neutrino fluxes with widths of emission σw from 0.01 to 3, where a width greater than 1 is approximately continuous emission. Smaller widths have a higher signal/background ratio since the background is time-independent. Thus, for a given number of signal events, we expect better discovery potential and higher values of the test statistic for smaller widths. The distributions of the test statistic for background and 10 signal events distributed according to various widths are shown below, with 5σ and 3σ thresholds indicated.
For each width, we calculate sensitivity and discovery potential in terms of time-averaged flux with an E-2 energy spectrum, and the comparison with the time-integrated search is shown below.
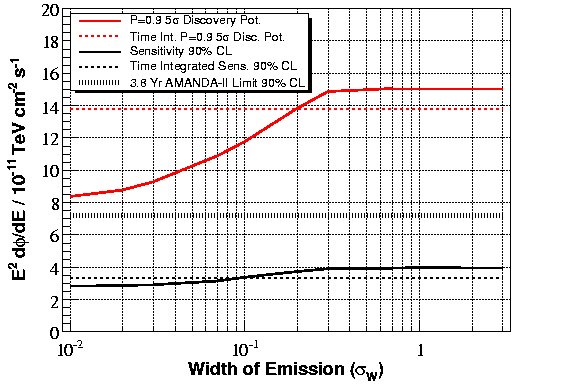
Since the 4 parameter fit adds two degrees of freedom, the sensitivity and discovery potential are ~10% worse for this analysis than the time-integrated analysis for large widths. As expected for smaller widths, the Gaussian phase constraint adds extra power to reject background and results in improved sensitivity and discovery potential.
Fitting Emission Phase
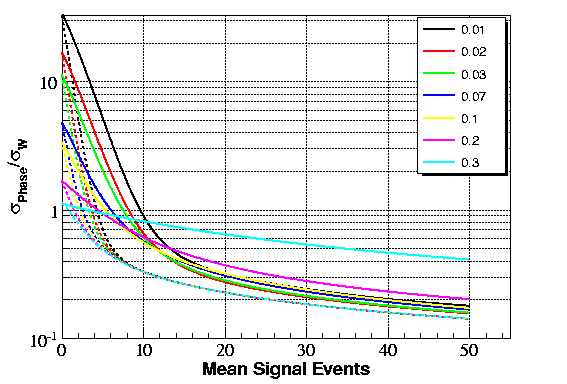
In the case of detection, it is interesting to determine how accurately we can fit the phase of maximum emission. The figure below left shows the 68% CL uncertainty in phase estimation as a function of Poisson mean number of signal events added to the sample for several emission widths. The dotted lines are σw/sqrt(Nevents), the accuracy which would be achieved if no background is present. The figure below right is the same, except the y-axis is divided by σw.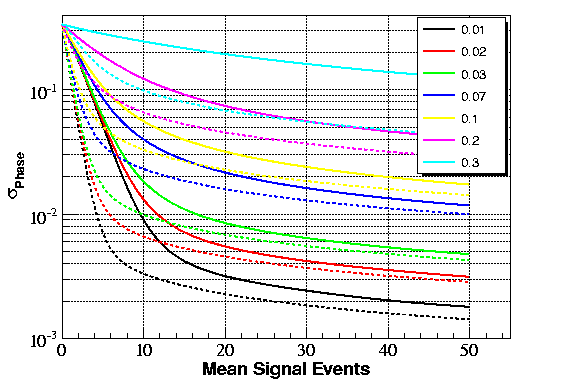 |
 |
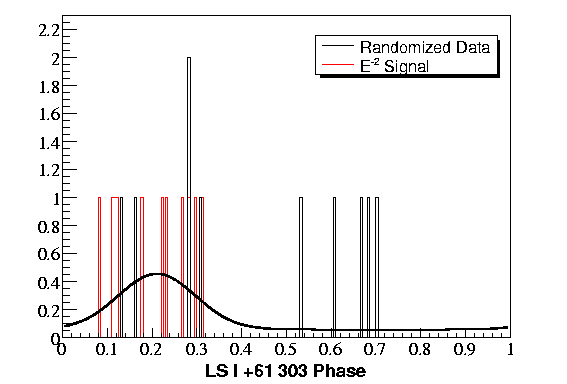
For example, with 10 signal events and σw = 0.1, the phase of maximum emission can be measured to a precision of ~0.06. Several example fits for various σw and number of signal events are shown below along with events within 3 degrees of the source location.
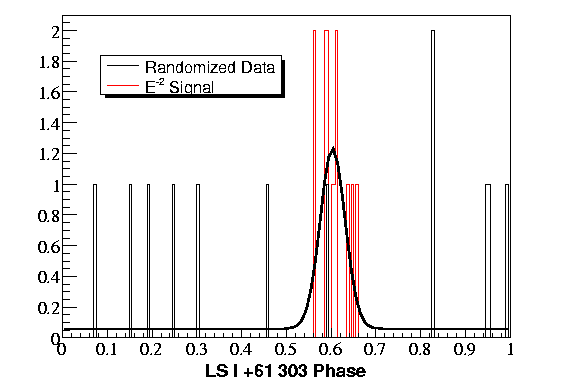
| σW=0.1 N=15 | σW=0.03 N=15 |
 |
 |
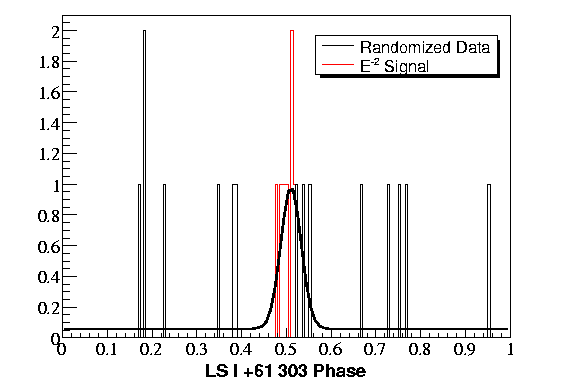
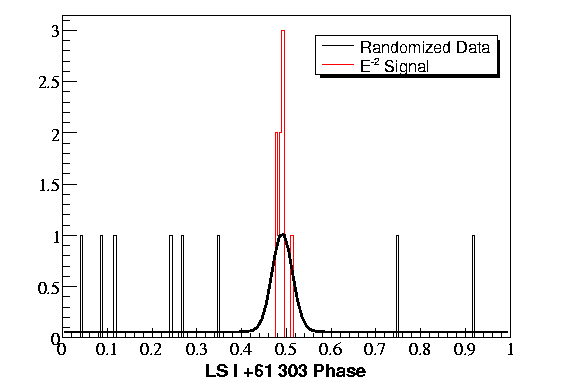
| σW=0.03 N=10 | σW=0.01 N=10 |
 |
 |
Proposal
We propose to perform this analysis and report the MJD of all events within 3o of the source location (median PSF ~1.5o) along with fitted parameters, flux limit, and significance. Given the time-integrated flux limit, it is unlikely, but still possible, to observe 5σ.Results
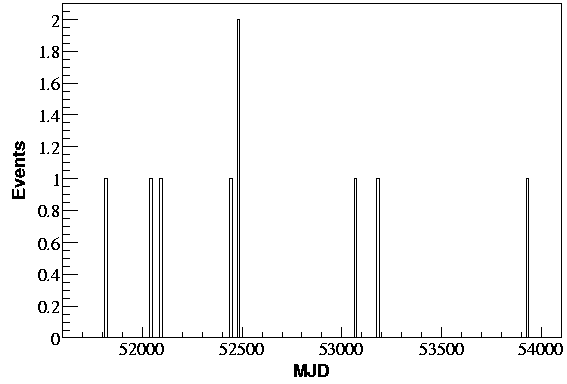
9 events are observed within 3o of LS I +61 303:ID Nch Phase Year Day GMT Sec. MJD S/B 412098 42 0.211976 2000 281 9981 51824.115521 20.611414 3219607 60 0.269850 2001 128 53305 52037.616956 456.237216 8383068 32 0.423660 2001 185 59123 52094.684294 15.964889 5825816 68 0.741784 2002 173 48498 52447.561319 85.744617 6773244 57 0.951576 2002 205 53219 52479.615961 1000.868687 3441011 20 0.050589 2002 208 20684 52482.239398 15.908098 1718914 155 0.011549 2004 60 10109 53064.117002 3907.663041 2314110 79 0.621906 2004 182 23588 53186.273009 1004.641265 6875899 35 0.756908 2006 196 63766 53931.738032 18.372001
The obtained value of the test statistic is 4.09022. 15.3% of randomized skymaps have test statistic values larger than 4.09022. Since the p-value of this source from the time-integrated search is 0.03, it is clear no significant periodic feature is present in the data. The MJD and phase of events is shown below, along with the fit (Best Width=0.2, Mean Phase=0.91).
 |
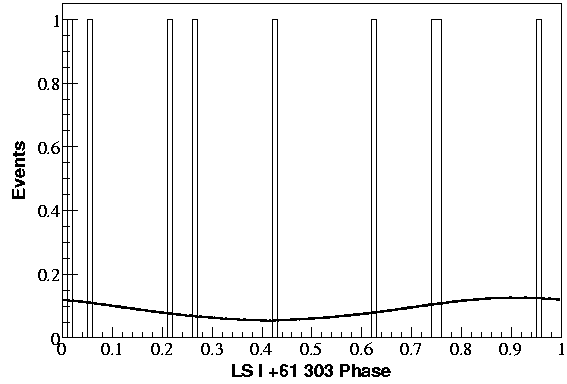 |
References
[1] A. Taylor and P. Gregory, ApJ 255 210 (1982).[2] D. Leahy, A&A 380 516 (2001).
[3] J. Albert et al., arXiv:0806.1865.
[4] P. Gregory, ApJ 575 427 (2002).