2000-2006 AMANDA Point Source Analysis
Event Selection
Methodology
Sensitivity & Discovery Potential
Unblinding Proposal
Results
Questions and Answers
Systematics, Publication, and Figures
LS I +61 303 Periodic Analysis
Solar WIMP Analysis
 |
| NASA/ESA Hubble |
Systematics
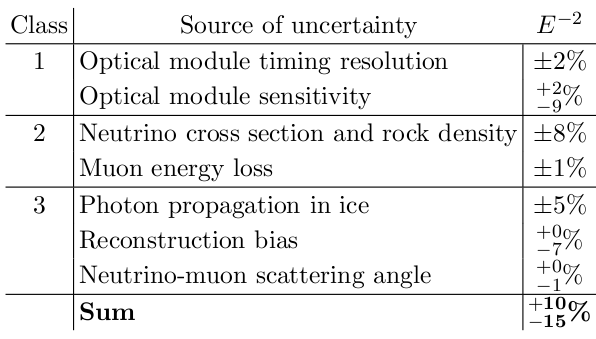
Since our simulation is nearly identical to that of the 5-year analysis, we propose to keep these uncertainties as they are, except for neutrino-muon scattering angle, which we address later. We focus on the following topics.
ANIS vs NUSIM
It is attractive to use ANIS as a neutrino generator for several reasons including internal handling of muon-nuetrino vertex anglular errors, use in IceCube analysis, and more recent parton functions (CTEQ5). Below are comparisons of effective area (left) and Nch (right) between NUSIM and ANIS (ANIS is dotted).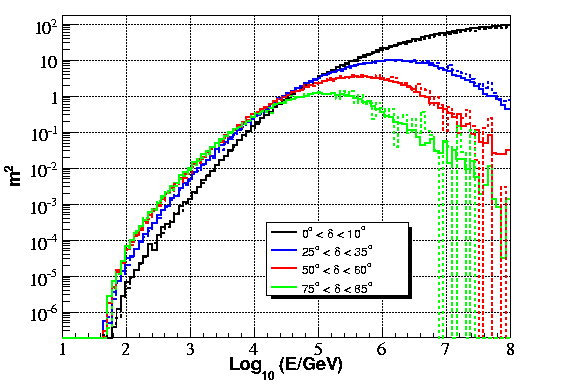 |
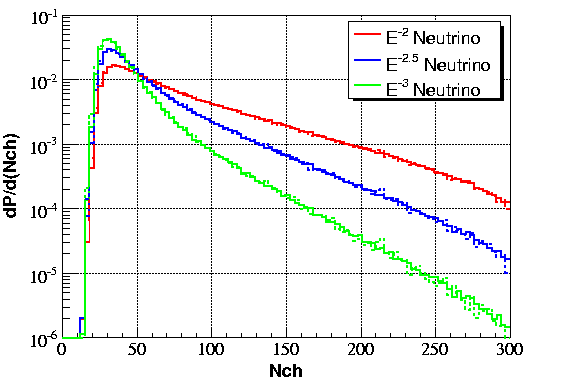 |
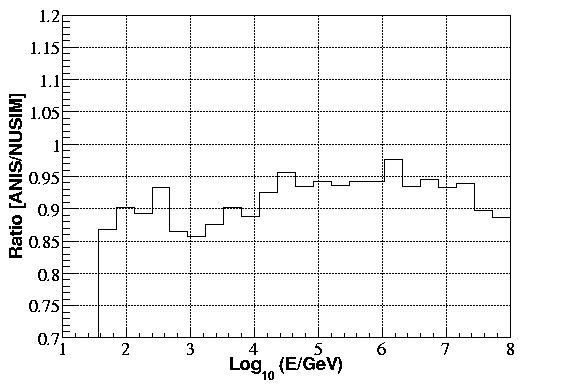
No difference is seen in Nch distributions; however, there is a slight difference in effective area. Given the ANIS effective area, ~10% less atmospheric neutrinos would be observed, and ~7% less E-2 events would be observed. The ratio ANIS/NUSIM is plotted below as a function of energy for the whole sky (left) and at specific zenith angles for an E-2 energy spectrum (right).
 |
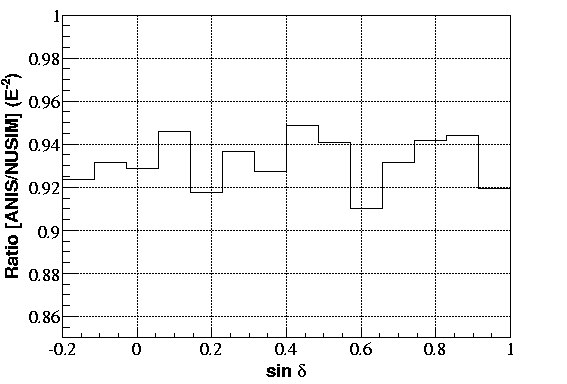 |
We propose to apply the zenith-averaged correction (i.e. reduce E-2 event rates by 7%). The zenith-dependent uncertainty is ±2%.
Tau neutrino induced muons
Muons are produced by tau decay with a branching ratio of 17.7%. As described in the 5-year publication, these tau-induced muons would be detected by AMANDA, leading to a constraint on the tau neutrino flux, which is interesting when assuming a 1:1:1 νe:νμ:ντ oscillation scenario for extraterrestrial neutrinos. Tau neutrino events are produced by ANIS, then simulated and filtered identically to muon neutrino events. Below is the effective area for tau neutrinos at final cut level (left) and the Nch distribution of tau-induced muons for several neutrino spectra (right, dotted) compared to standard muons.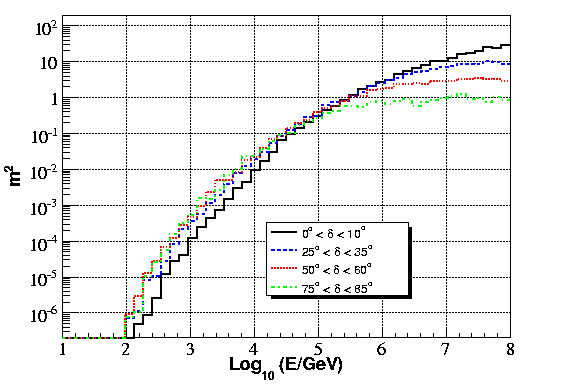 |
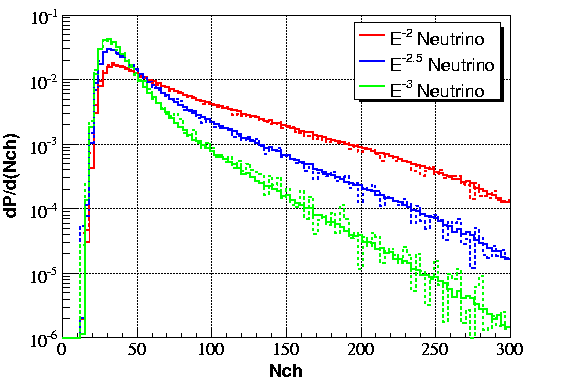 |
The effective area for tau neutrinos is shown below along with the effective area for muon neutrinos.
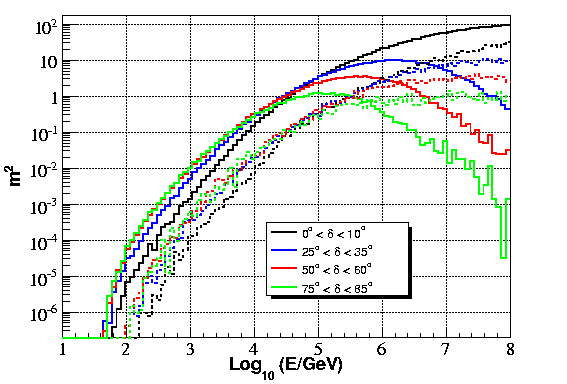
Muon neutrino effective area is reduced above ~100 TeV for angles passing through the Earth due to neutrino absorption. The effect is much less for tau neutrinos due to the short decay length of the tau and subsequent generation of another tau neutrino upon decay. The event rate for E-2 tau neutrinos (tau/muon event fraction) is shown below as a function of declination.
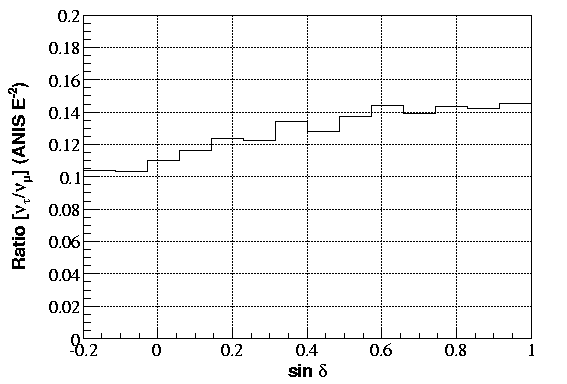
The tau neutrino event rate is 10%-14% of the muon neutrino event rate. This rate and tau neutrino effective area are consistent with the 5-year publication. We will use these rates when calculating νμ+ντ combined limits.
Unbinned Method
The unbinned analysis itself is relatively immune from systematic uncertainties because limits and significance are computed from randomized data. If, for example, paraboloid errors are systematically wrong or there is a problem with the Nch distribution for background, the method simply becomes less effective and produces a worse limit. A problem which would produce systematic errors, however, is an error in our assumed Nch distribution for signal. If, for example, the simulation predicts too many high Nch events, our limits would be too stringent since we would assume we have more power to separate signal from background using Nch than we actually have. We know good Nch agreement exists for low values of Nch from comparison of data to atmospheric neutrino MC at tight cut levels. For larger values of Nch, Jessica Hodges compared Nch distributions between downgoing muons and CORSIKA, shown below.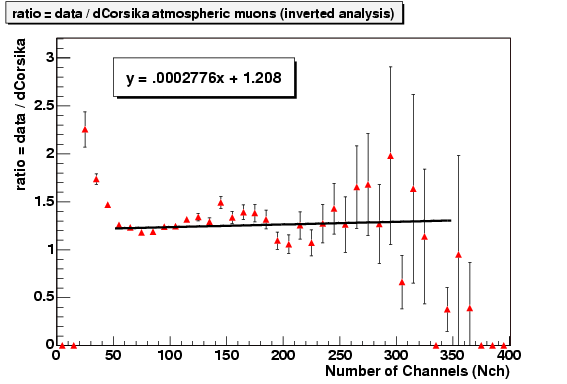
Ignoring the threshold effect at low values of Nch, the ratio data/MC is very flat but increases slightly toward higher values of Nch. Applying this nch slope to our simulation results in limits which are ~2% better. Since the improvement is marginal and the supporting evidence for the Nch slope is marginal, we will ignore this effect.
Event Reconstruction
Paraboloid errors are ~8% worse for data than for atmospheric neutrino simulation. This is an indication our event reconstruction may be better in our simulation than it is for data. We can estimate the systematic effect of this uncertainty by increasing the simulated point spread by 8% and recalculating limits. With this approach, we find limits become worse by ~6%. We also estimate the effect of a 0.5o zenith systematic shift by placing a 0.5 degree zenith offset between assumed and true source location and find that limits become worse by 3.5%. The errors sum to a 7% effect. We propose to add a +7%, -0% systematic error on our limits (equivalent to a +0%, -7% systematic errorr on flux prediction) to account for this uncertainty.Sum of Errors
The errors on flux prediction sum to +10%, -16.5%. We apply a symmetric error of ±16%, and shift the E-2 signal prediction by -3%. Systematic errors are incorporated into the limits according to the method of G. Hill, PRD 67, 118101 (2003).Publication
V0.1 6/20/08V0.2 6/24/08 (Comments from Teresa, Jon)
V0.3 6/27/08 (Comments from Stefan W., Elisa B.)