2000-2006 AMANDA Point Source Analysis
Event Selection
Methodology
Sensitivity & Discovery Potential
Unblinding Proposal
Results
Questions and Answers
Systematics, Publication, and Figures
LS I +61 303 Periodic Analysis
Solar WIMP Analysis
 |
| NASA/ESA Hubble |
Unblinding Results
Full Sky Search
6595 events are shown from the 2000-2006 AMANDA-II μ-DAQ dataset.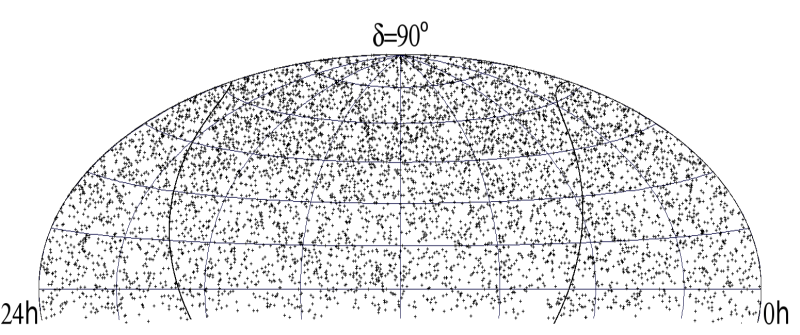
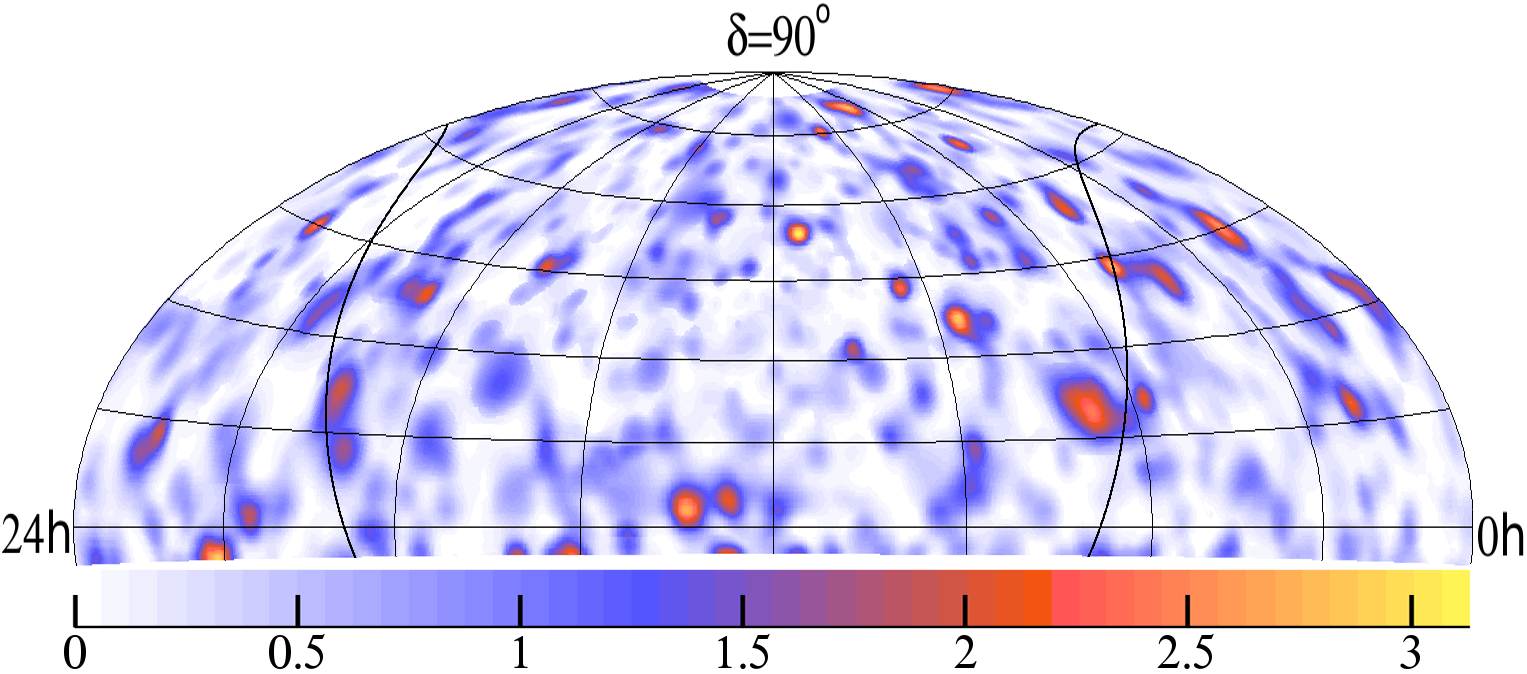
The likelihood ratio is evaluated on a 0.25ox0.25o grid ranging from -5o<δ<82.5o. At each point the significance is calculated, resulting in the following map of -Log10(p) (click here for larger image):

The maximum significance obtained is p=0.00074 (3.38σ) near 11.4h, +54o. Out of 100 sets of data randomized in right ascension, 95 have a maximum significance equal to or greater than 3.38σ. Below is a close-up image of the Cygnus region.
Search Based on a List of Candidate Sources
The method is applied to the locations of sources in the IC-9 point source catalog. The limits (E2Φ < μ90*10-11 TeV cm-2s-1 @90% CL) and p-values (probability the result is due to background alone) are summarized in the table below. Systematics are not included| Object | Deco | RAo | μ90 | P-value |
| MGRO J2019+37 | 36.83 | 304.83 | 4.75 | 0.077 |
| Cyg OB2 | 41.32 | 308.29 | 3.16 | 0.30 |
| Mrk 421 | 38.21 | 166.11 | 1.26 | 0.82 |
| Mrk 501 | 39.76 | 253.47 | 3.56 | 0.22 |
| 1ES 1959+650 | 65.15 | 300 | 3.38 | 0.44 |
| 1ES 2344+514 | 51.71 | 356.77 | 2.84 | 0.44 |
| H 1426+428 | 42.68 | 217.14 | 2.82 | 0.36 |
| BL Lac (QSO B2200+420) | 42.28 | 330.68 | 2.54 | 0.38 |
| 3C66A | 43.04 | 35.67 | 3.93 | 0.18 |
| 3C 454.3 | 16.15 | 343.49 | 1.27 | 0.73 |
| 4C 38.41 | 38.14 | 248.82 | 1.10 | 0.85 |
| PKS 0528+134 | 13.53 | 82.74 | 1.60 | 0.64 |
| 3C 273 | 2.05 | 187.28 | 4.17 | 0.086 |
| M87 | 12.39 | 187.71 | 2.18 | 0.43 |
| NGC 1275 (Perseus A) | 41.51 | 49.95 | 2.24 | 0.47 |
| Cyg A | 40.73 | 299.87 | 4.50 | 0.095 |
| SS 433 | 4.98 | 287.96 | 1.57 | 0.64 |
| Cyg X-3 | 40.96 | 308.11 | 3.28 | 0.29 |
| Cyg X-1 | 35.2 | 299.59 | 2.00 | 0.57 |
| LS I +61 303 | 61.23 | 40.13 | 7.21 | 0.033 |
| GRS 1915+105 | 10.95 | 288.8 | 3.73 | 0.11 |
| XTE J1118+480 | 48.04 | 169.55 | 2.61 | 0.50 |
| GRO J0422+32 | 32.91 | 65.43 | 1.40 | 0.76 |
| Geminga | 17.77 | 98.48 | 6.07 | 0.0086 |
| Crab Nebula | 22.01 | 83.63 | 4.47 | 0.10 |
| Cas A | 58.82 | 350.85 | 1.93 | 0.67 |
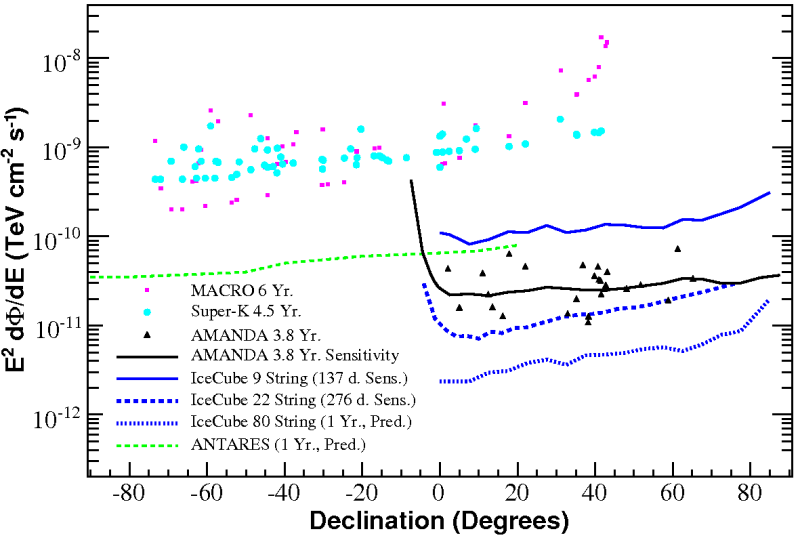
The most significant source is Geminga with a P-value of 0.0086. The probability of obtaining a p-value of 0.0086 for at least one of the 26 sources is 20%. The 2000-2006 sensitivity and flux limits are shown below (click here for larger image).
Milagro Stacking Search
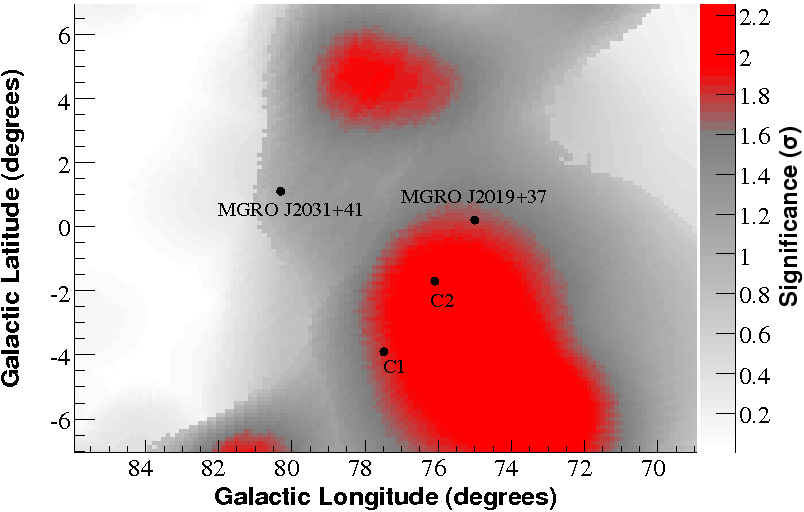
The six milagro hotspots below are stacked to enhance the significance of a possible weak signal.| Source | l | b | δ | α |
| MGRO J2019+37 | 75.0 | 0.2 | 36.72o | 305.03o |
| MGRO J1908+06 | 40.4 | -1.0 | 6.18o | 287.18o |
| MGRO J2034+41 | 80.3 | 1.1 | 41.57o | 308.04o |
| C1 (MGRO J2043+36) | 77.5 | -3.9 | 36.3o | 310.98o |
| C2 (MGRO J2032+37) | 76.1 | -1.9 | 36.52o | 307.75o |
| MGRO J1852+01 | 33.5 | 0.0 | 0.51o | 283.12o |
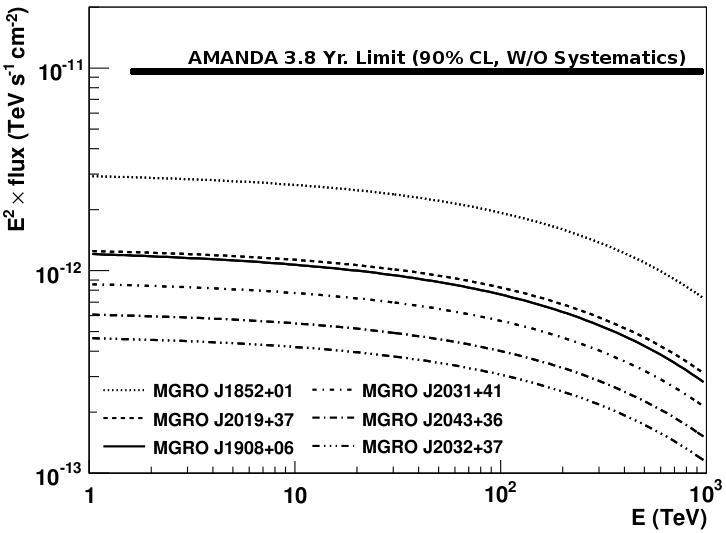
The search results in a minor upward fluctuation with a p-value of 0.19. The 90% confidence level limit on the per-source flux for the six sources, excluding systematics, is 9.6*10-12 TeV cm-2 s-1 over the energy region 1.8 TeV - 2.1 PeV. The limit is shown with the flux predictions of Halzen et al. [1] below.
Autocorrelation Search
Significances for the autocorrelation search are shown below as a function of angular separation and Nch threshold.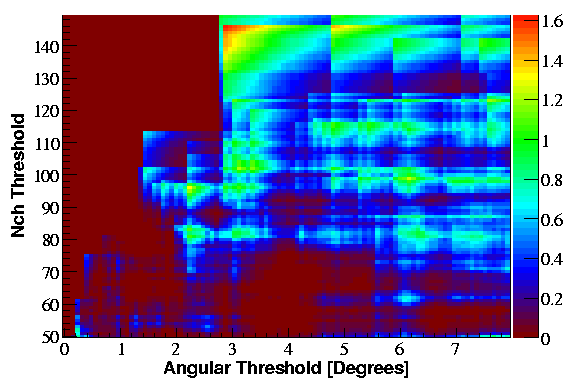
The maximum observed significance is 1.6σ, for an Nch threshold of 146 and angular separation of 2.88o, where 2 pairs are observed. A significance of 1.6σ or higher is obtained in 99 of 100 sets of data randomized in right ascension.