2000-2006 AMANDA Point Source Analysis
Event Selection
Methodology
Sensitivity & Discovery Potential
Unblinding Proposal
Results
Questions and Answers
Systematics, Publication, and Figures
LS I +61 303 Periodic Analysis
Solar WIMP Analysis
 |
| NASA/ESA Hubble |
Solar WIMP Analysis
Introduction
The MSSM provides an excellent candidate for dark matter in the neutralino. The neutralinos would accumulate in massive bodies, including the core of the Earth and Sun, and annihilate. The signature of annihilation includes a beam of >GeV neutrinos, detectable in AMANDA and IceCube as a neutrino point source. A neutrino beam from the Sun cannot be seen in the standard point source search since the equatorial coordinates of the Sun vary with time. Here we describe a search for neutrino emission from the Sun in Sun-centered coordinates.Data and Simulation
We use the same data set as in the standard point source search; however, we only use data below the horizon. This cut is necessary since downgoing muons very strongly dominate events above the horizon and correspondingly reduce sensitivity. In this period, 953 days of livetime are accumulated with the Sun below the horizon. We use the same NUSIM and ANIS simulation as in the standard point source search. Since the simulated events are distributed evenly over cos θ, we use the weighting scheme of Daan to reweight the events to the solar declination distribution: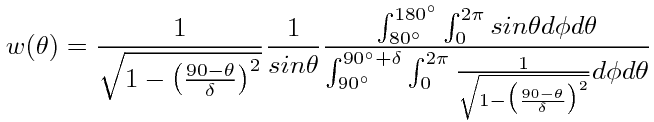
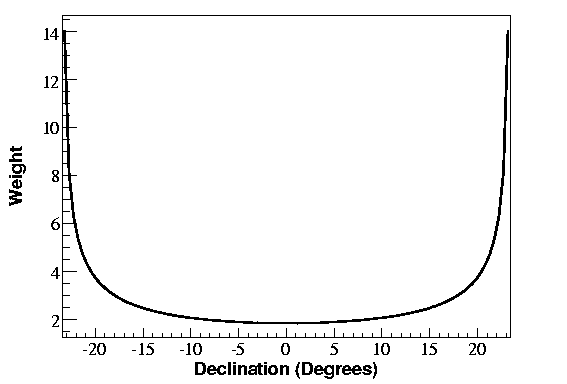
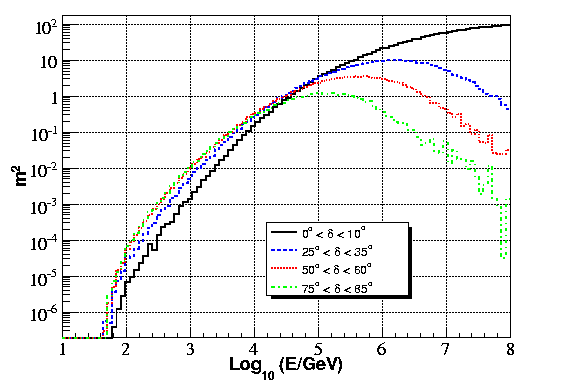
where δ is the maximum declination of the sun, 23.442o. The AMANDA effective area to a neutrino source with the solar declination distribution can be calculated from this simulation using the same methods as the standard point source search. The neutrino effective area is shown below (left) along with the declination dependent effective area from the standard point source search (right) and agrees with the expectation from the solar declination distribution.
 |  |
It is standard in AMANDA analysis to compare effective volume, rather than effective area, in comparing solar WIMP analyses. The effective volume can be computed in two ways:
The Standard Way (Method A)
Effective volume can be calculated knowing the active volume in neutrino simulations. For standard ANIS and NUSIM, this is difficult since the active cylinder length for the ν → μ vertex is dependent on the muon energy; however, the cylinder length is known as a function of energy and thus Veff can be calculated if the muon energy is known. We use the following to calculate effective volume: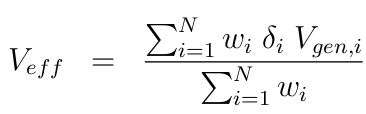
A Different Way (Method B)
Effective volume can also be calculated directly from the neutrino effective area. This method is particularly convenient since it requires no additional knowledge of the simulation active volume. The method is as follows (adapted from thesis of A. Biron):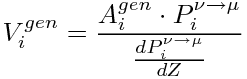
where Pν→μ is the interaction probability of the neutrino within the active volume (available at the "interaction weight"), and dPν→μ/dZ is the interaction probability per unit length. The interaction probability per unit length is
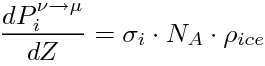
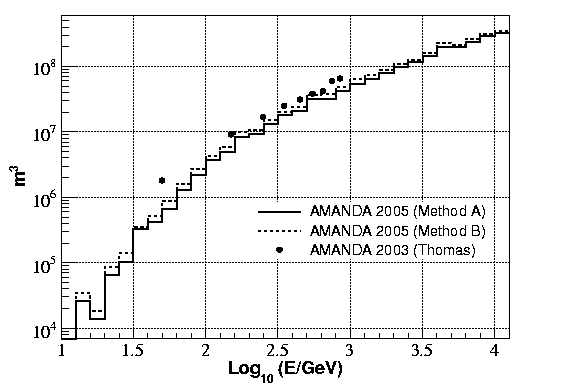
where σi is the cross section per nucleon for the given neutrino energy, NA is Avogadro's constant, and ρice is 0.92 g/cm3. The calculated effective volumes using both methods are shown below along with values from figure 7.20 (b) of the thesis of Thomas Burgess at trigger level (left), and final cut level (right):
 |
 |
Trigger level effective volumes agree within a factor of 1.5; however, at final level the effective volume of this analysis is a factor of ~3 less than those of Thomas.
Neutrinos from Neutralino Annihilation
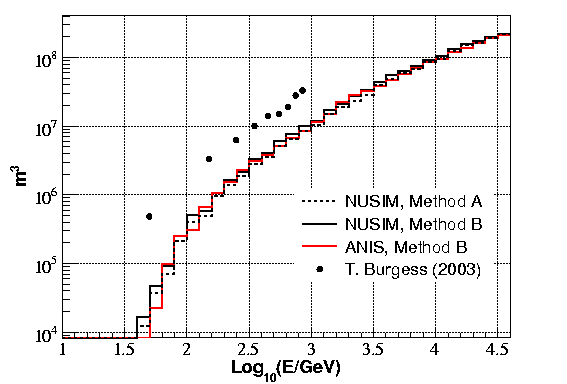
Neutrino spectra at Earth are simulated using WimpAnn/DarkSusy for WW and bb channels. We use the following versions:- wimpann-2.09
- DarkSUSY ds-4.1.6-lite
- nusigma-1.15-pyr
- Pythia 6.416
The sum of νμ and anti-νμ is shown below for several neutralino masses (WW: solid, bb: dashed).
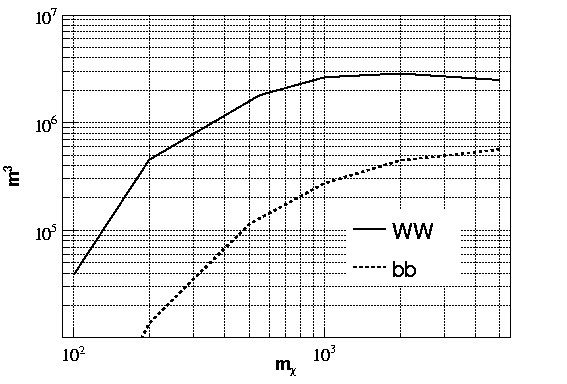
The spectra are convoluted with effective volume over the energy range 0 GeV - mχ and shown below for WW and bb channels and several neutralino masses.
Methodology
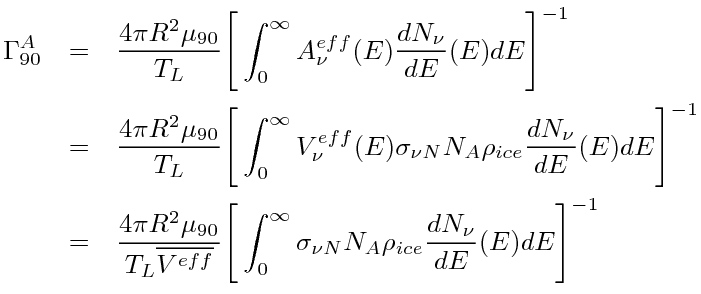
We use the unbinned point source method to determine discovery potential, sensitivity, and limits in terms of number of signal events. These limits can be converted to limits on annihilation rate entirely through effective area. The annihilation rate is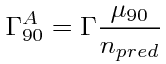
where μ90 is the signal event limit, and npred is the number of events predicted by the annihilation rate Γ. Npred is calculated by convoluting flux with effective area:
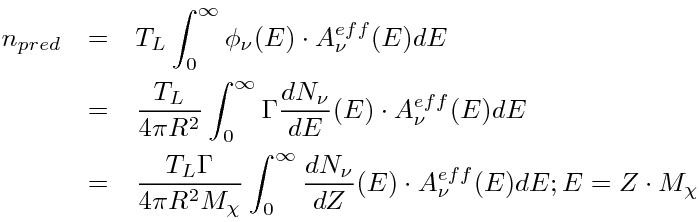
The final annihilation rate limit is:
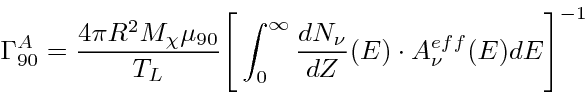
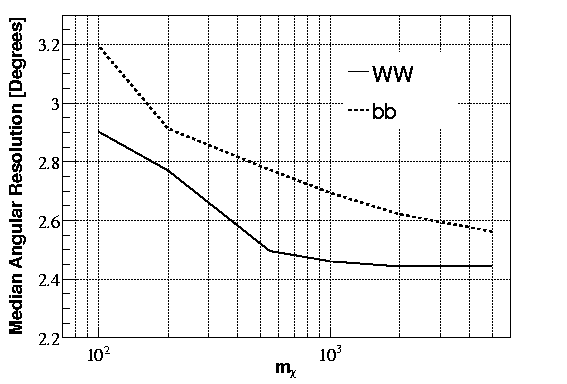
where dNν/dZ is the annihilation spectrum of neutralinos with mass mχ, R is the Earth-Sun distance, and TL is the data livetime of 953 days. νμ and anti-νμ spectra and effective area are convoluted individually and summed. The ν→μ vertex angle is properly simulated in ANIS, so we use ANIS for the remainder of the analysis. Median angular resolution is shown below as a function of neutralino mass.
Sensitivity
We asses sensitivity by selecting simulated signal events, adding them to data randomized in right ascension, and tabulating the observed values of the test statistic. The process is done for each neutralino mass, and the weights used in the selection account for the neutrino energy distribution expected for the given neutralino mass. Feldman-Cousins confidence bands are built from the tables, as described in the point source search methodology internal report. From this, we calculate average upper limits, which are converted to annihilation rate sensitivity as described above. Below is the annihilation rate sensitivity of this analysis compared to Gustav's IC22 analysis (AHAv2), without systematics, and Daan's sensitivity: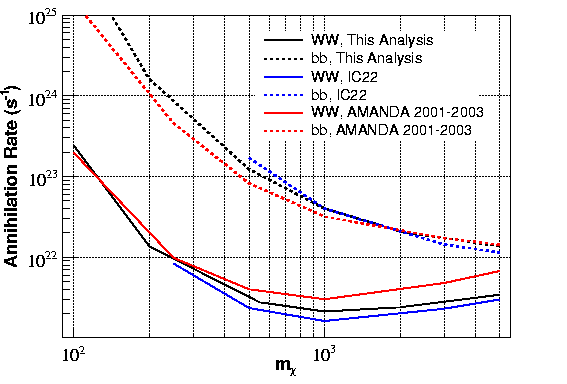
Unblinding
We propose to unblind the 2000-2006 AMANDA data using the analysis described above. We will produce a significance sky map near the Sun in our Sun-centered coordinates. Since the physics aim of this analysis is significantly different from the point source analysis, we will not directly apply a trial factor to our final significance.Questions
Daan, Nov. 21 2008
Q:  I looked at your webpage and I still feel uncomfortable with your final sensitivities. I explain below why
I think you overestimate your sensitivity.

I compared Veff, median resolution (I assume this is with respect to the neutrino direction?), livetime, mu90
and annihilation rate sensitivity from yours and Gustavs analysis. I read your values from the figures, Gustavs
numbers were taken from his unblinding request (http://www.physto.se/~wikstrom/icecube/ic22/final_sample.html and
http://www.physto.se/~wikstrom/icecube/ic22/solar_search.html)

These are the numbers for (5000GeV, W+W- channel)

+++ Veff [m3] +++
 (Jim) ~4.0e5   versus  4.2e7 (Gustav)

+++ mu90 +++
 (Jim) ???   versus  12.3 (Gustav)

+++ Tlive [days] +++
 (Jim) 953   versus  104.3 (Gustav)

+++ resolution [deg] +++
 (Jim) ~2.4  versus  2.9 (Gustav)

+++ annihilation rate Gamma_A [s-1] +++
 (Jim) 3.5e21  versus 3.0e21 (Gustav)

There are ??? for your m90, I could not find it in your page. I computed your mu90 myself in this way.

From Veff, mu90 and Tlive one can find the numu conversion rate, Gamma_numu=mu90/Veff*Tlive. This is 1030 km-3*yr-1
for Gustav. Since this quantity scales linearly with the annihilation rate Gamma_A, I can find the conversion factor
C from Gamma_numu=C*Gamma_A and Gustavs Gamma_numu. That would be C=3.4e-19. Since you find Gamma_A=3.5e21, your
Gamma_numu=1205 and given your livetime and Veff, that would finally give mu90=1.26. Is this what you found too?

When taking this number at face value, then my question is: how can your analysis obtain mu90=1.26? That is a factor
of 10 better than Gustav's result! I agree, your cuts may be harder, resulting in better signal resolution (still only
0.5deg) and fewer background events, all leading to better mu90. But you also have 9 times more livetime than Gustav,
and mu90 roughly scales like sqrt(Tlive). You and Gustav both use a likelihood approach, so I can imagine that would
not boost your result by a large factor.

Unless I made an obvious mistake in the above, I believe you overestimated the sensitivity. This conclusion holds for
the other models as well.

About possible causes I can only think of:

+ some discrepancy between the methods to calculate Gamma_A: either through Gamma_numu (the usual for wimp-wg) and
your direct calculation through integral over Aeff.

+ a mistake in the Veff calculation (used by me to infer mu90 from Gamma_numu)

+ a mistake in the Gamma_A calculation.

+ a mistake in your likelihood method. I have read your interesting internal report and would like to see (some of)
the signal, background pdfs that go in the method. Btw, do you use the energy estimator or not?

Possibly the easiest solution is to provide mu90 for each model on your page? Maybe I made a mistake somewhere, or I
am missing something completely...
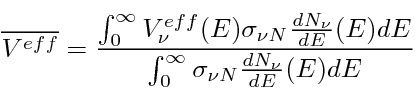
A: Hi Daan, The problem is due to my calculation of average effective volume for neutralino spectra. I averaged over the neutrino energy distribution at Earth for a given spectrum from WimpAnn to get average effective volume, and this is not the same quantity typically used by the WIMP group. Below is a derivation of the correct effective volume, using the annihilation rate sensitivity I calculate above:
The last equation is equivalent to equations 7.12 and 7.13 in Thomas's thesis, and provides the proper definition of the effective volume:
I calculate average effective volumes below using this new definition:
Doug C., Dec. 16 2008
Q:  In the calculation of n_pred, you integrate over energies from 0 to infinity.
However, for a given WIMP mass the neutrino energy has an upper bound.  Why don't
you use that upper bound in the integral?  I'm sure it has only a small effect on
the calculation since the flux must get very small at high energies, so this question
is probably more in the lines of dotting all the i's and crossing all the t's.
A: The effective upper limit of the integral is the WIMP mass. dN/dE is zero above this point, so integrating to Mχ and integrating to infinity are equivalent.
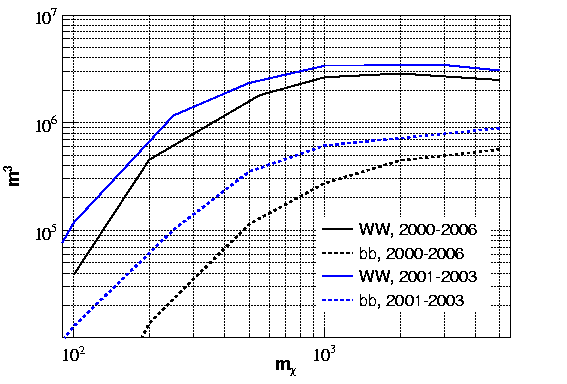
Q:  How do we understand why your sensitivity for the bb channel is not much better
than that for 3-yr AMANDA over much of the mass range?
A: It is clear from the effective volume. The 7-year cuts are harsh on very low energy events which dedicated WIMP analyses are optimized to keep. A comparison of my effective volume to Daan's is shown below.
Q:  What tests have you done to insure that you have implemented the sun centered
coordinate system correctly?
A: This is two tasks: Ensuring the solar coordinates are correct and checking whether dec-decsun and RA-RAsun are computed correctly. I checked the RDMC solar coordinates against another astronomical library (kStars) and the Sun's position was identical at the arc minute level. I double checked my calculations of dec-decsun and RA-RAsun.
Q: Do you include tau neutrino -> tau -> muon in your signal?
A: I haven't yet included this contribution into the sensitivity. I will add it when I address systematics (not as a systematic error, but as a signal contribution).
Preliminary Results
The analysis results in a downward fluctuation of -0.8σ in the direction of the sun. Relative event density is plotted below for regions near the sun.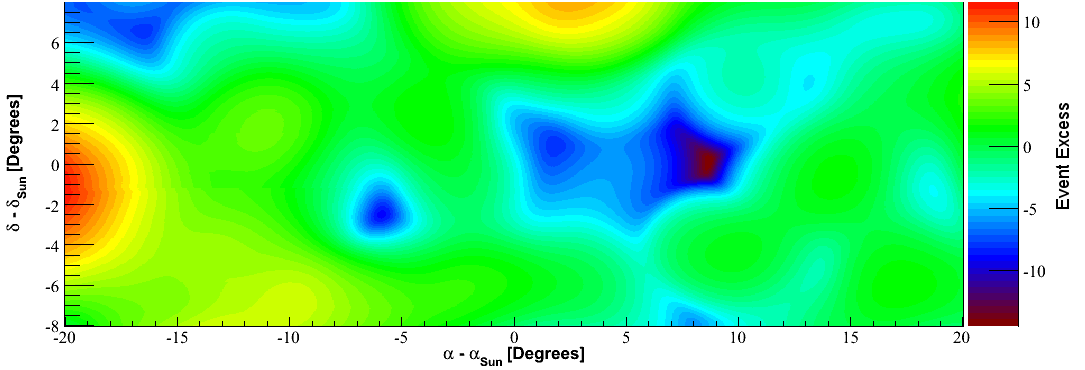
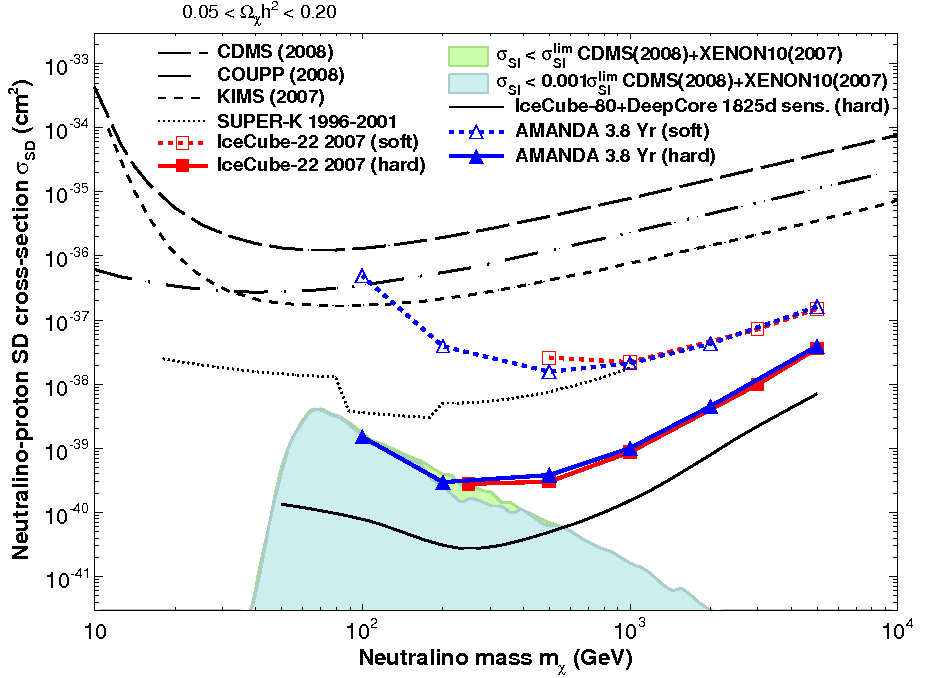
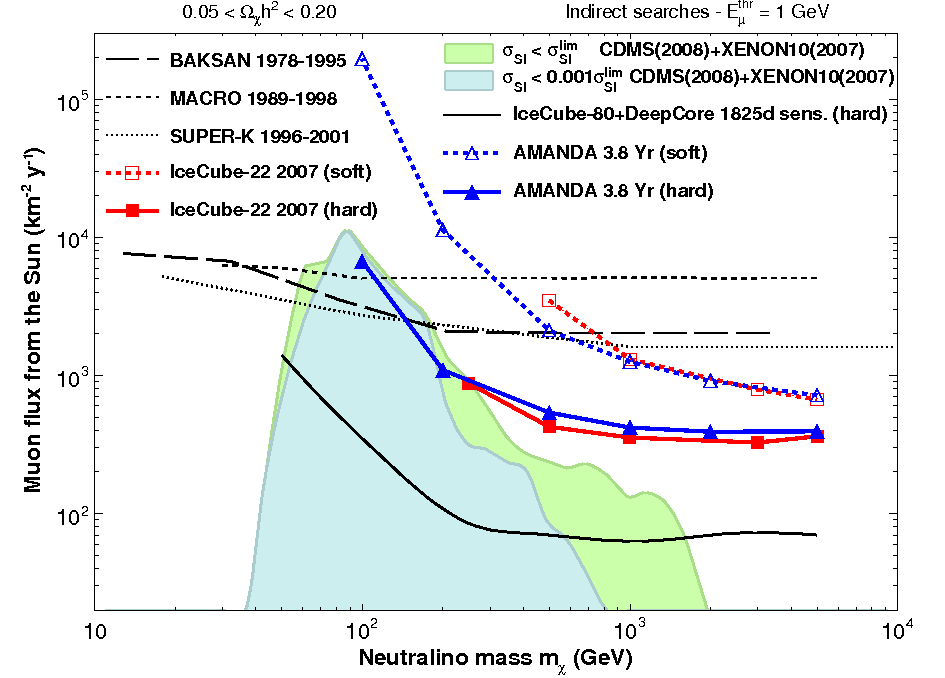
Preliminary limits on annihilation rate are shown below in comparison with those from Gustav's IC22 analysis without including systematic uncertainty.
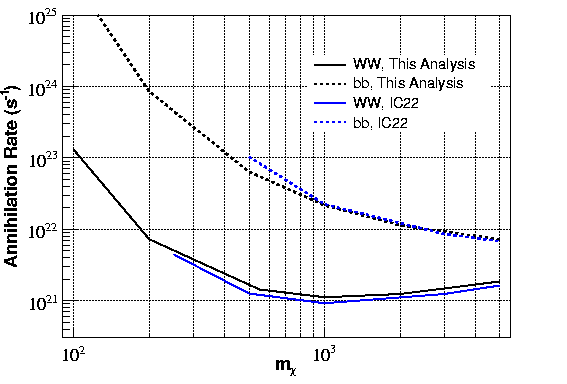
Table of Results (without systematics)
| Channel | Veff (m3) | ΓA (s-1) | Φμ (km-2y-1) | σSI (cm2) | σSD (cm2) |
| 5000 GeV, WW | 2.49x10⁶ | 1.84x10²¹ | 330 | 2.22x10-41 | 3.32x10-38 |
| 2000 GeV, WW | 2.86x10⁶ | 1.23x10²¹ | 308 | 2.51x10-42 | 3.56x10-39 |
| 1000 GeV, WW | 2.64x10⁶ | 1.11x10²¹ | 334 | 6.24x10-43 | 8.08x10-40 |
| 550 GeV, WW | 1.80x10⁶ | 1.43x10²¹ | 382 | 2.84x10-43 | 3.18x10-40 |
| 200 GeV, WW | 4.52x10⁵ | 7.21x10²¹ | 801 | 3.11x10-43 | 2.19x10-40 |
| 100 GeV, WW | 3.86x10⁴ | 1.30x10²³ | 4.67x10³ | 2.35x10-42 | 1.05x10-39 |
| 5000 GeV, bb | 5.61x10⁵ | 7.24x10²¹ | 583 | 8.74x10-41 | 1.31x10-37 |
| 2000 GeV, bb | 4.43x10⁵ | 1.13x10²² | 704 | 2.31x10-41 | 3.27x10-38 |
| 1000 GeV, bb | 2.74x10⁵ | 2.16x10²² | 938 | 1.21x10-41 | 1.57x10-38 |
| 500 GeV, bb | 1.14x10⁵ | 6.34x10²² | 1.58x10³ | 1.08x10-41 | 1.17x10-38 |
| 200 GeV, bb | 1.37x10⁴ | 8.44x10²³ | 7.37x10³ | 3.64x10-41 | 2.57x10-38 |
| 100 GeV, bb | 5.88x10² | 3.21x1025 | 1.04x10⁵ | 5.80x10-40 | 2.59x10-37 |
Systematics and Final Results
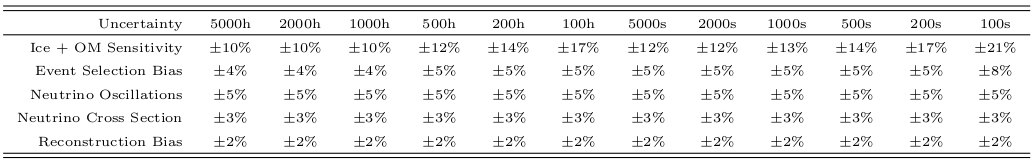
Systematic uncertainties affecting the final limits are tabulated below: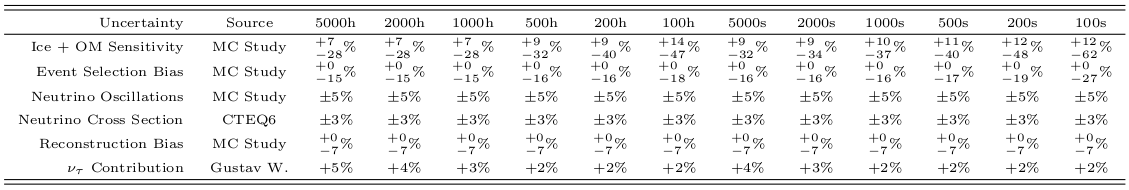
Ice and OM Sensitivity
We use the OM sensitivity constraints from the Zeuthen five-year point source analysis. For PTD ice, the zenith distribution of events constrains the OM sensitivity to +3%,-10% of the nominal value. Neutrino events from 2000-2006 are generated using both +3% and -10% OM sensitivity offsets, and the obtained effective area (effective volume) are compared to simulation with standard OM sensitivity. The uncertainty for an atmospheric neutrino spectrum is within 2% of John Kelley's result.Event Selection Bias
Bias in event selection has been evaluated in the Zeuthen five-year point source analysis by comparing the distribution of cut parameters between CORSIKA and downgoing muons. The analysis revealed paraboloid error distributions are shifted 10% smaller and smoothness distributions are shifted 7% smaller, resulting in a data/Monte Carlo bias. This bias is evaluated by scaling the paraboloid error and smoothness, reapplying the cuts, and comparing the effective area to simulation without the scaling.Neutrino Oscillations
The effect of the uncertainty in neutrino oscillations parameters is evaluated identically to Gustav's Analysis. The maximum effect on effective area is 5%, and this result is taken for all masses.Neutrino Cross Section
This is taken from analysis of the CTEQ6 parton functions, done by Aart Heijboer.Reconstruction Bias
Comparing the 2005 data to downgoing simulation, we found a 8% offset in the paraboloid error distribution, smaller than the 10% reported in the Zeuthen analysis. If our point spread function is underestimated in a similar factor, we can evaluate the effect by increasing the point spread of each simulated event comparing the resulting limits. We found that the limits worsened by 7%.Tau Neutrino Contribution
This is taken from Gustav's Analysis.Other Sources
Other known sources (timing resolution, etc.) contribute less than 4%.Incorporation of Systematic Uncertainties
The uncertainties due to event selection, event reconstruction, and ice + OM sensitivivity are asymmetric and rectangular. We propose the following procedure to incorporate these uncertainties into the limits:- Center the rectangular uncertainty interval and shift effective area/volume accordingly (i.e. for a +0, -10 uncertainty, reduce effective area by 5%, effectively making the limits 5% worse).
- Transform the rectangular uncertainties into Gaussian uncertainties with the same RMS.
- Add the uncertainties in quadrature to get the final, total uncertainty in the limit calculation.
- Use the method of Jan Conrad [Phys. Rev. D 67, 012002 (2003)] and Gary Hill [Phys. Rev. D 67, 118101 (2003)] to incorporate the uncertainties into the Feldman-Cousins limit calculation.
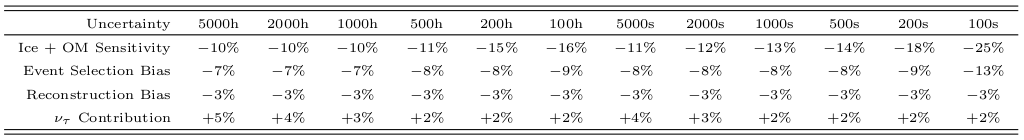
and the uncertainties using this procedure.
These uncertainties are combined, including a 4% uncertainty contribution from other sources, yielding total offset and uncertainty:

Final Limits and Effective Volumes
| Channel | Veff (m3) | ΓA (s-1) | Φμ (km-2y-1) | σSI (cm2) | σSD (cm2) |
| 5000 GeV, WW | 2.07x10⁶ | 2.20x10²¹ | 394 | 2.66x10-41 | 3.97x10-38 |
| 2000 GeV, WW | 2.38x10⁶ | 1.56x10²¹ | 390 | 3.19x10-42 | 4.52x10-39 |
| 1000 GeV, WW | 2.18x10⁶ | 1.39x10²¹ | 418 | 7.82x10-43 | 1.01x10-39 |
| 500 GeV, WW | 1.31x10⁶ | 2.07x10²¹ | 539 | 3.51x10-43 | 3.81x10-40 |
| 200 GeV, WW | 3.42x10⁵ | 9.81x10²¹ | 1.09x10³ | 4.23x10-43 | 2.98x10-40 |
| 100 GeV, WW | 2.87x10⁴ | 1.88x10²³ | 6.75x10³ | 3.40x10-42 | 1.52x10-39 |
| 5000 GeV, bb | 4.59x10⁵ | 8.91x10²¹ | 717 | 1.08x10-40 | 1.61x10-37 |
| 2000 GeV, bb | 3.53x10⁵ | 1.46x10²² | 910 | 2.98x10-41 | 4.23x10-38 |
| 1000 GeV, bb | 2.14x10⁵ | 2.89x10²² | 1.26x10³ | 1.63x10-41 | 2.10x10-38 |
| 500 GeV, bb | 8.87x10⁴ | 8.52x10²² | 2.12x10³ | 1.45x10-41 | 1.57x10-38 |
| 200 GeV, bb | 9.80x10³ | 1.29x1024 | 1.13x10⁴ | 5.56x10-41 | 3.92x10-38 |
| 100 GeV, bb | 3.65x10² | 6.01x1025 | 1.95x10⁵ | 1.09x10-39 | 4.85x10-37 |
Kaluza-Klein Limits and Effective Volumes
| Mass | Veff (m3) | ΓA (s-1) | Φμ (km-2y-1) | σSI (cm2) | σSD (cm2) |
| 3000 GeV | 2.25x10⁶ | 1.72x10²¹ | 374 | 7.66x10-42 | 1.12x10-38 |
| 1500 GeV | 2.23x10⁶ | 1.50x10²¹ | 394 | 1.78x10-42 | 2.45x10-39 |
| 1100 GeV | 2.01x10⁶ | 1.50x10²¹ | 396 | 1.00x10-42 | 1.32x10-39 |
| 900 GeV | 1.82x10⁶ | 1.65x10²¹ | 424 | 7.68x10-43 | 9.74x10-40 |
| 700 GeV | 1.56x10⁶ | 1.97x10²¹ | 468 | 5.89x10-43 | 7.06x10-40 |
| 500 GeV | 1.21x10⁶ | 2.48x10²¹ | 507 | 4.21x10-43 | 4.56x10-40 |
| 250 GeV | 4.91x10⁵ | 6.75x10²¹ | 744 | 3.96x10-43 | 3.17x10-40 |