2000-2006 AMANDA Point Source Analysis
Event Selection
Methodology
Sensitivity & Discovery Potential
Unblinding Proposal
Results
Questions and Answers
Systematics, Publication, and Figures
LS I +61 303 Periodic Analysis
Solar WIMP Analysis
 |
| NASA/ESA Hubble |
Sensitivity & Discovery Potential
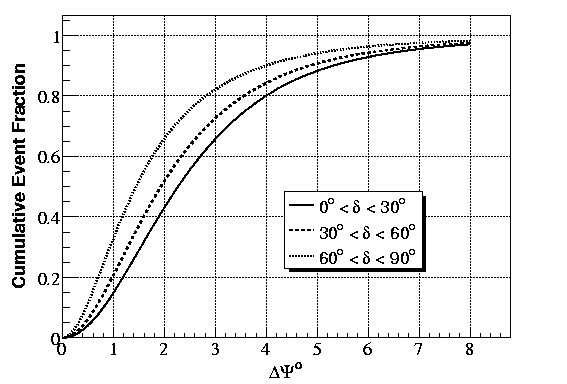
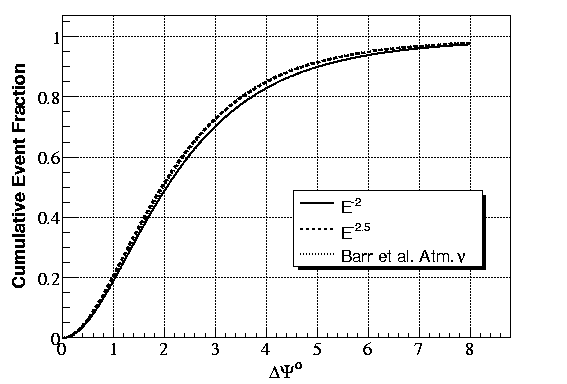
Point Spread
Application of the final cuts results in the following simulated point spread:
 |
 |
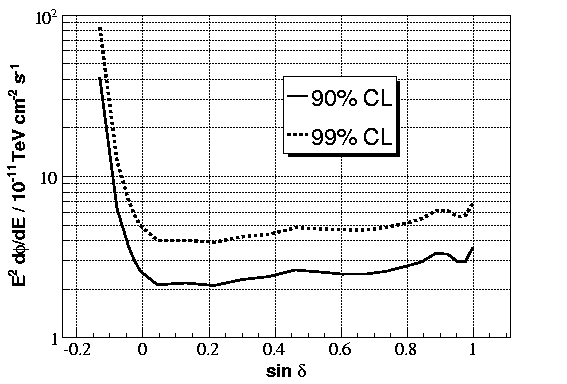
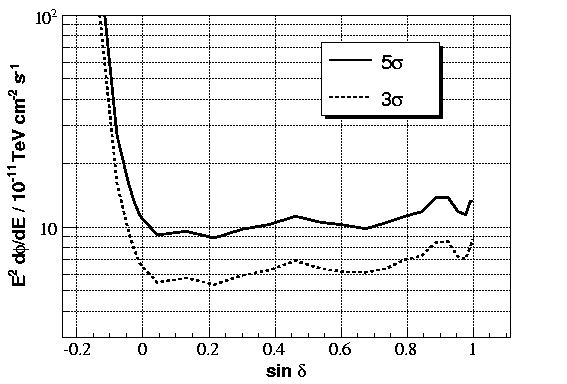
Sensitivity
 |
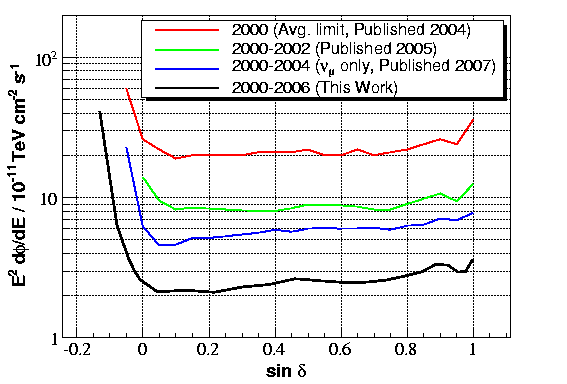 |
The Northern Hemisphere average sensitivity to E-2 is ~2.5 * 10-11 TeV cm-2 s-1.
Detection Probability
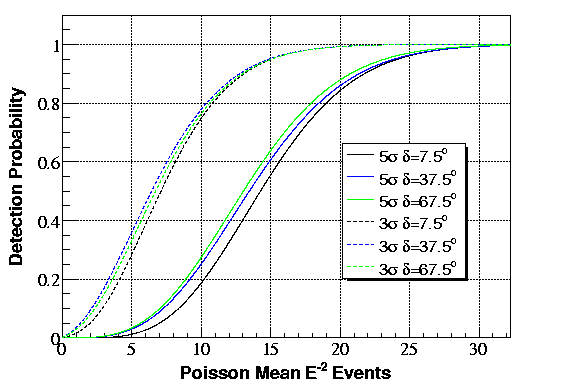
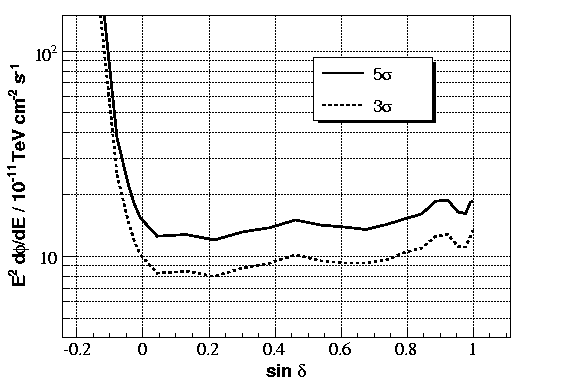
Averaged Discovery Potential
| Statistical Power = 0.9 | Statistical Power = 0.99 |
 |
 |
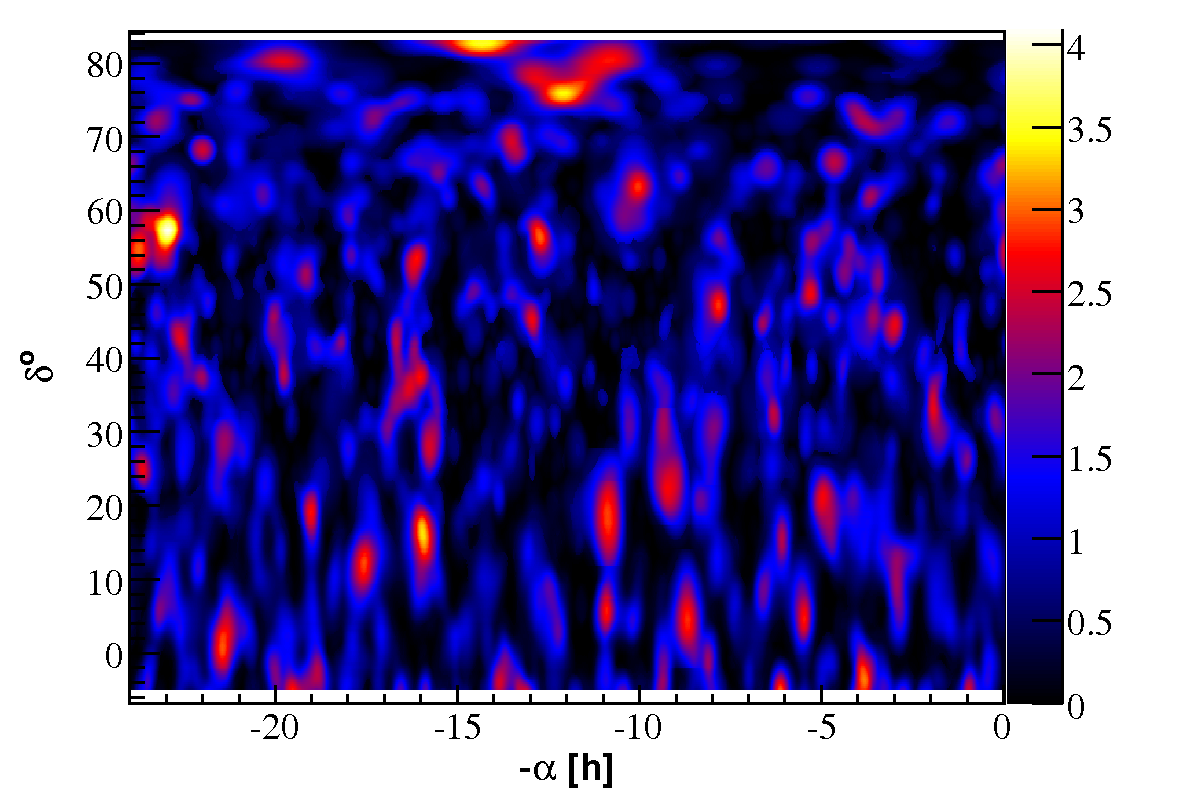
Randomized 2000-2006 Unbinned Skymap (Scale is in standard deviations)
All-Sky Search Discovery Potential
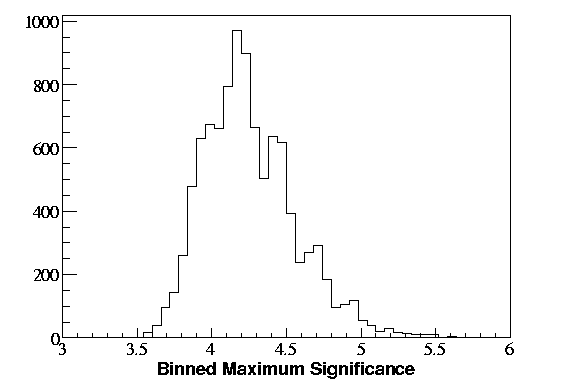
The distribution of maximum significances for 1000 searches of the entire sky is shown below left, while the distribution of maximum significances for a 3 degree binned search (on a similar 0.25x0.25 degree grid) are shown below right.
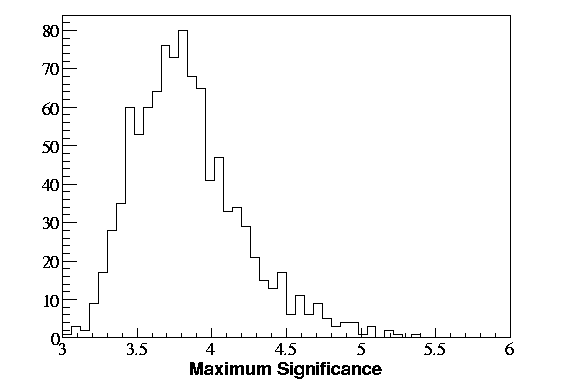 |  |
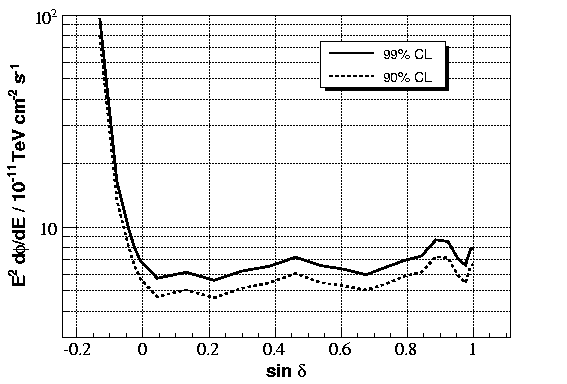
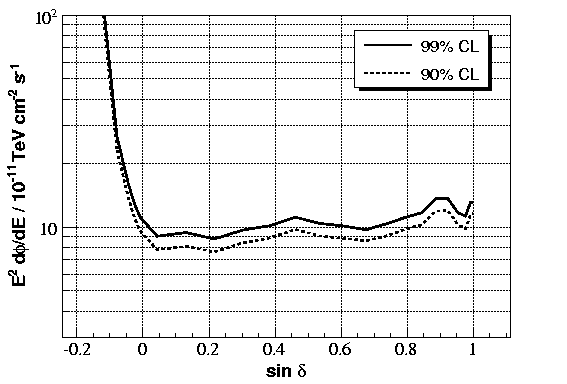
90% of skymaps have a maximum significance less than 4.33σ (p=1.49x10⁻⁵), and 99% of skymaps have a maximum significance less than 4.94σ (p=7.81x10⁻⁷). The E-2 neutrino flux required to achieve these significances is shown below.
| Statistical Power = 0.5 | Statistical Power = 0.9 |
 |
 |
Milagro Source Stacking Search
Sensitivity & MDP
For the entire sample containing 6 sources:| 90% CL Sensitivity | P=0.9 MDP (5σ) |
| 3.74 * 10-11 TeV cm-2 s-1 | 1.51 * 10-10 TeV cm-2 s-1 |
The per-source sensitivity and MDP are the sample MDP divided by the number of sources:
| 90% CL Sensitivity | P=0.9 MDP (5σ) |
| 6.23 * 10-12 TeV cm-2 s-1 | 2.51 * 10-11 TeV cm-2 s-1 |