2000-2006 AMANDA Point Source Analysis
Event Selection
Methodology
Sensitivity & Discovery Potential
Unblinding Proposal
Results
Questions and Answers
Systematics, Publication, and Figures
LS I +61 303 Periodic Analysis
Solar WIMP Analysis
 |
| NASA/ESA Hubble |
Questions and Answers
11.4.2008 (Elisa B.)
Q: I just looked at the effective area plot and I am not sure I understand it. It looks too me higher then expected, especially at the highest energies, if compared to the 5 years paper and compared to what Chad reported at ICRC for IC9.For example
| Energy | Jim (0o<δ<10o) | 5 years paper (δ=5o) | IC9 @ ICRC (0o<δ<30o) |
| 1 TeV | ~1.5x10⁻¹ | 2x10⁻¹ | 10-1 |
| 108 GeV | ~100 | 50 | 50 |
To compare to the 5 years paper, we have to take into account that you have looser cuts at horizon. But as far as I understand, at least they do not affect too much the atmospheric neutrinos. Could you quantify the improvement in efficiency that you have with the new cuts as a function of the energy?
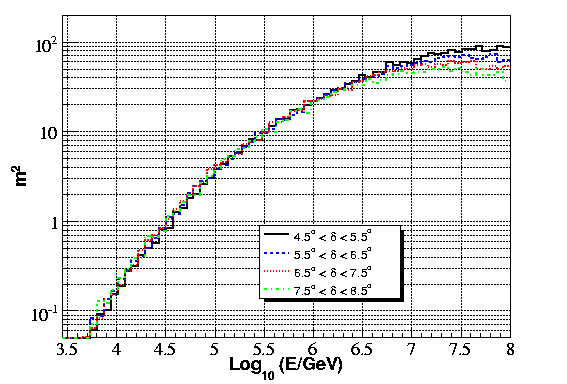
A: I've attached a plot of effective area for declinations 5, 6, 7, and 8 degrees. For 5 degrees, the values at 10 TeV (~2x10⁻¹ m2) and 1 PeV (~20 m2) agree well with the 5 yr paper values. At 108 GeV, my values are about 60% higher (~80m vs ~50m). Here, Earth absorption is a very strong function of declination near 5 degrees, and the effective area is cut by a factor 2 in just 3 degrees (~80m at 5 deg --> ~40m at 8 deg). I remember the point source simulation for the 5 yr analysis was chosen in bands of cos(theta). Is it possible the 5 degree curve in the 5yr paper is rounded from a slightly different declination?
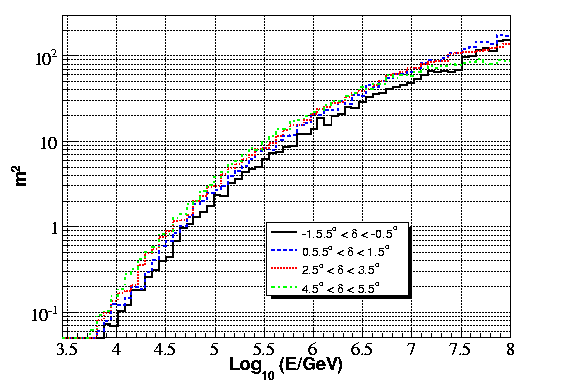
I've also attached a plot of effective area for declination -1 degree to 5 degrees, and there is no sharp change where the SVM cuts begin at 1.5 degrees.
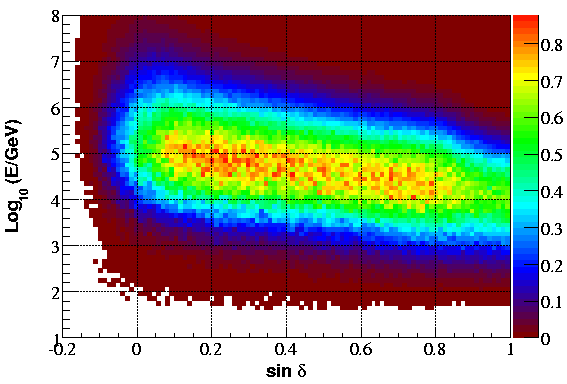
Finally, the energy distribution of E-2 signal is shown below as a function of declination, and no discontinuity appears near 1.5o, where the cuts change.
10.4.2008 (Gary H)
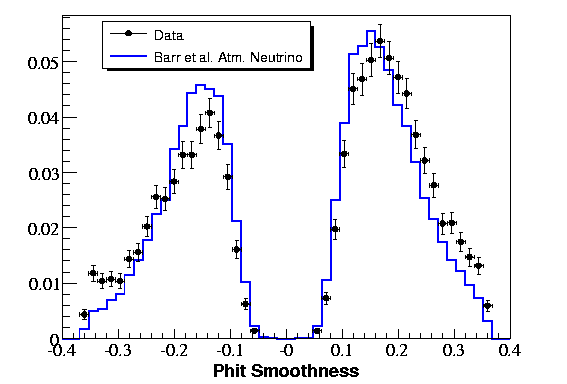
Q: Can we see signed smoothness plots?A:
10.4.2008 (Azriel)
Q: Event selection/ sensitivity plot: why isn't the sensitivity (away from the horizon) much better for 2000-2004 than 2005-2006 with more than twice the livetime?A: Are you referring to the plot on the event selection page? The sensitivity shown for the 2000-2004 cuts is for the 2005-2006 data. So the data used in both sensitivity calculations was the same.
Q: cos(theta) plot in The final event sample section: don't we need to show we understand the new background events in the 0-0.2 region? (downgoing stuff presumably)
A: These events are generally misreconstructed muons, see:
http://www.icecube.wisc.edu/~jbraun/2005_point_source/images/CutsFinal.png
for 2005. In the end, the total number of background events is most important for a point source search, and the nature of the background is less important. Addition of non-atmospheric neutrino events is a small problem for the unbinned analysis, and this is discussed in the internal report.
Q: Stacked search: (I already mentioned this to Jim), the documentation should explain why treating the extended milagro sources as point like (same pdf as for point sources) is a reasonable thing to do (I am now convinced it is).
A: I added comments to the stacking section explaining this.
Q: In the search for event clustering, it is not clear how one would report if we DO see a significant excess? any thoughts? (I am sure someone has thought about this before)
A: We state the P-value, computed by comparing the most significant value obtained from any Nch threshold or angular separation to the distribution of most significant values obtained from randomized data. We also show the autocorelation plot. The procedure we should use I think is identical to that of discussing the all-sky search.
Q: Sensitivity: If I read correctly the sensitivity achievable here is x3 better than the reported in the 2000-2004 paper. Am I reading correctly? *Impressive*, again, given the stats is less than doubled. Is this mainly the energy factor?
A: I read from this plot:
http://www-zeuthen.desy.de/~ackerman/2004/plots/sensitivity.gif
The 5yr sensitivity to numu+numubar is ~5.5 *10-11 TeV cm-2 s-1, so the improvement is closer to a factor of 2. I think the improvement breaks down approximately as follows:
| 2 more years ==> sqrt(7/5) = 1.18 | 18% improvement |
| unbinned method with energy | 30% improvement |
| No normalization to atm. neutrinos | 10% improvement |
The last improvement will be at a cost to systematic uncertainties, so it is not necessarily an improvement. Scaling the sensitivity 5.5 with these improvements gives a sensitivity of ~2.9. We do slightly better than this because sensitivity improves better than S/sqrt(B), and 30% is at the lower range of improvement shown for the unbinned analysis.
9.4.2008 (Lutz)
Q: It would be helpful to list the changes w.r.t. those analyses (if there are any in addition to the Milagro search).A: The autocorrelation analysis is also new. The changes w.r.t. the 2005-2006 analysis include:
- We do not normalize the data to atmospheric neutrinos. Instead, we consider this effect with systematics.
- The source list will change from the IC9 list to IC22 if the IC22 list is approved before we unblind.
- We use the Zeuthen cuts rather than those optimized for 2005-2006. The reasons for the last point are discussed in detail on the event selection page.
Q: Event selection:
a) with your cuts, you go below the horizon, allowing for substantial background. This is fine but may be misleading for likelihood difference and smoothness plots as well as for the Monte Carlo/Data ratio plot. How does the background show up in those figures? It may be better to also use the declination > 5 degree cut on those figures.
A: The background shows up at high smoothness and high paraboloid error. I replotted the year-to-year comparison figures with only dec > 5 degrees. This limits the background substantially in those figures.
Q: Is there an explanation, why the background is higher in 2005 and 2006? I don't know if you want to show a scatter plot of track directions in the paper. It has confused people to see a heavy populated band around the horizon. This would have to be clearly described in the paper.
A: In 2005 and 2006 we have slightly higher event rates near the horizon. I suspect this is due to the interchange of the JAMS > 70 deg and DW > 80 deg reconstruction cuts, but I haven't investigated. For the final sample, the event rates near the horizon actually still decrease from those in the Northern Hemisphere, unlike the 2000 analysis, for example, so a skyplot is OK.
Q: I think that in the Zeuthen analysis, the smoothness values were shifted for a better description and a systematic error was derived from this. Did you do this too?
A: The shifts in the distributions are similar in value to those seen for Zeuthen (~8%). I don't believe the shifted distributions were used for systematic studies for the paper, though.
Comment from Elisa B.:
In the 5 years paper, the systematics related to disagreement data and Monte Carlo was estimated, including the effects of rescaling (not shifting) of the paraboloid and smoothness.
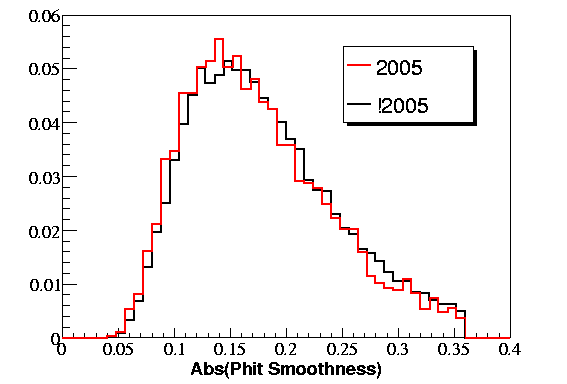
Q: b) why are entries in the paraboloid result seen above 3 degrees in the yearwise comparison? Can the better smoothness distribution of 2005 be explained by more active modules? - or in general - does the Monte Carlo track those small differences between the years? If not, would one need to introduce a systematic for this?
A: There were entries above ~3.2 degrees because I allowed background events near the horizon...these are now gone in the year-by-year comparison plots for dec > 5 degrees. I agree the smoothness in 2005 appears slightly better than for other years. I've attached a plot of S_phit for atmospheric neutrino simulation for 2005 and years other than 2005 and there is a similar small difference.
Q: c) Does the method to determine the source and background probabilities (Icecube internal report) work with atmospheric muon background (with probably relative high energies?). It looks as if only the atmospheric neutrino flux is accounted for?
A: Yes..that's right. I do not account for background other than atmospheric neutrinos. I would like to use the off-source data Nch distribution for background, but there are not enough statistics in this data set. The slight disagreement in Nch makes high values of the test statistic more common than expected (i.e. by assuming a chi-square), but since I calculate use randomized data to calculate significance there is no problem.
Q: Methodology:
for curiosity: could one do something better than assuming an E-2 spectrum for the Milagro sources? Would there be any value in weighting the sources in relation to the observed gamma flux?
A: Yes -- if we know the neutrino spectra of each source we could do better. I let the spectral index float from 2.0-2.7 and fit the neutrino spectrum of all sources simultaneously. If there is a significant spread in spectral index between these sources, this isn't the best model. However, the spread in spectral index would need to be larger than the spectral index resolution to make a significant difference. 5 sigma is ~20 events, which has a resolution of 0.25 in spectral index, which would mean a fairly large spread is still acceptable.
Q: Systematics:
Which systematics do you want to include? Which will you copy one to one from the Zeuthen analysis, which do you want to change, which come in addition due to the new methods used? (e.g. uncertainty in paraboloid estimation of true track uncertainties as function of energy, yearwise differences).
A: We would probably copy the Ice and OM sensitivity systematics from the 5-year paper since we used a nearly identical simulation. John K. is currently producing ANIS simulation, and we could estimate systematic errors from cross-section and rock density from this.