Data-MC Level5
The data-mc comparisons are performed on level 5. From the years 2012, 2016 und 2020 the first and 15th day of each month is processed. This results in a total experimental livetime of \(2487\,\mathrm{h}\). The quality cuts used for level 5 are shown as a vertical black line in the plots. All plots also include the impact of the neutrinos, which are treated as background in this analysis. For the neutrino contamination, NuGen dataset for electrons, muons and taus are weighted with both atmospheric fluxes and an astrophysical component. For the atmospheric flux, the neutrinos are weighted with the respective cosmic-ray model. However, since the differences are very small, all predictions are presented in the same color (pink). For the astrophysical component, a single power law (SPL) with a normalizatoin of n = 1.8e-18 and a spectral index of gamma = 2.52 is assumed, taken from Measurement of the astrophysical diffuse neutrino flux in a combined fit of IceCube’s high energy neutrino data.
Note
In Table 6 the rates for the different primary flux models are shown for level 4. There is a mismatch of the normalization of the data and the MC. For the data-mc comparisons, the following plots use scaled weights. Therefore, the weights are normalized to the data for each weighting. This helps to analyze the shape of the different primary flux models. The rescaling is done based on the rates on level 5. The rates and the rescaling factors are shown in Table 13. Additional data-mc plots to investigate cuts and all primary flux models are dumped here. For the unfolding, only the relative transition from the reconstructed proxy to the target variable matters, thus the normalization is completely negligible.
Model |
H3a |
H4a |
GST |
GSF |
Exp |
|---|---|---|---|---|---|
Level 4 / mHz |
21.62 |
21.09 |
20.92 |
14.07 |
18.55 |
Rescale factor L4 |
0.86 |
0.88 |
0.89 |
1.32 |
|
Level 5 / mHz |
15.16 |
14.76 |
14.79 |
9.68 |
12.36 |
Rescale factor L5 |
0.82 |
0.84 |
0.84 |
1.28 |
Seasonal Variations
As presented in the analysis of Karolin Hymon, there are seasonal variations in the production of leptons in the atmosphere (wiki page). These variations are caused by the temperature and pressure changes in the atmosphere. Our new dataset allows us to investigate these variations, since we have simulated all 12 months/atmospheres per year (usually, only 4 atmospheres are simulated). The following plot Fig. 95 shows the rate per month for the different primary flux models.
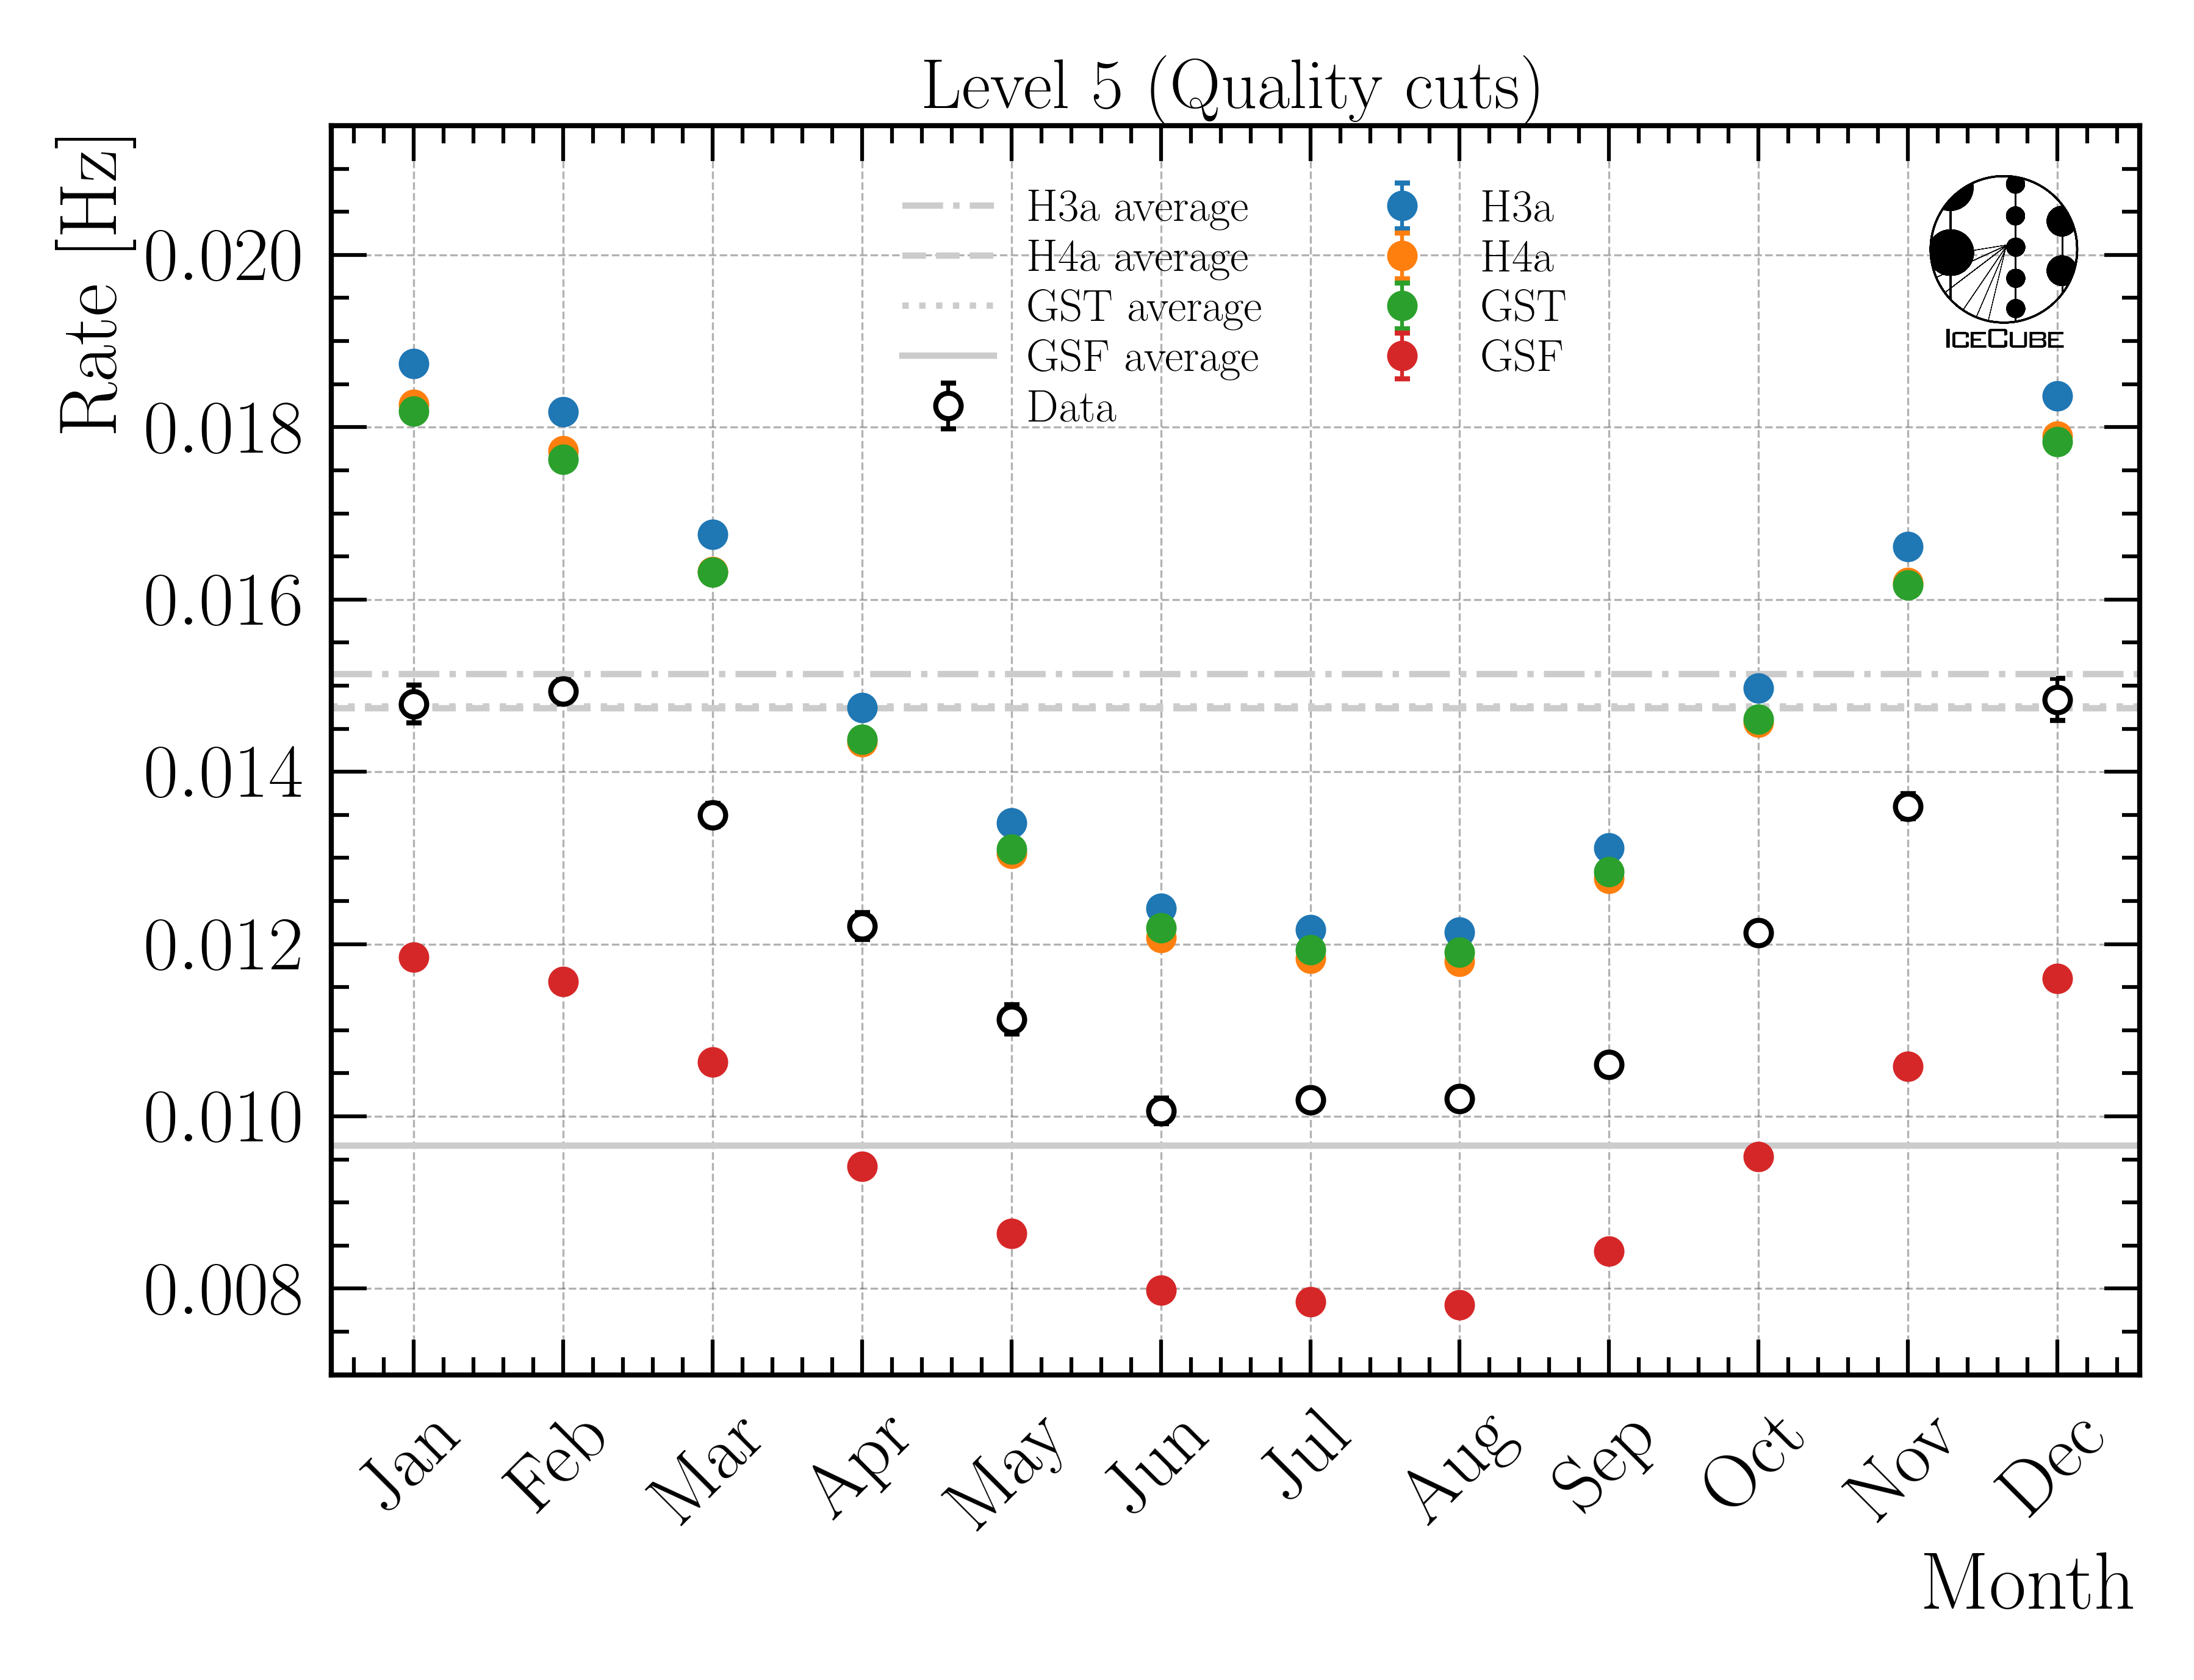
Fig. 95 : Rate per month for different primary flux models.
As already mentioned above, there is a mismatch of the normalization of the data and the MC. In Fig. 96, the rates are rescaled. The shape is in agreement for all primary flux models.
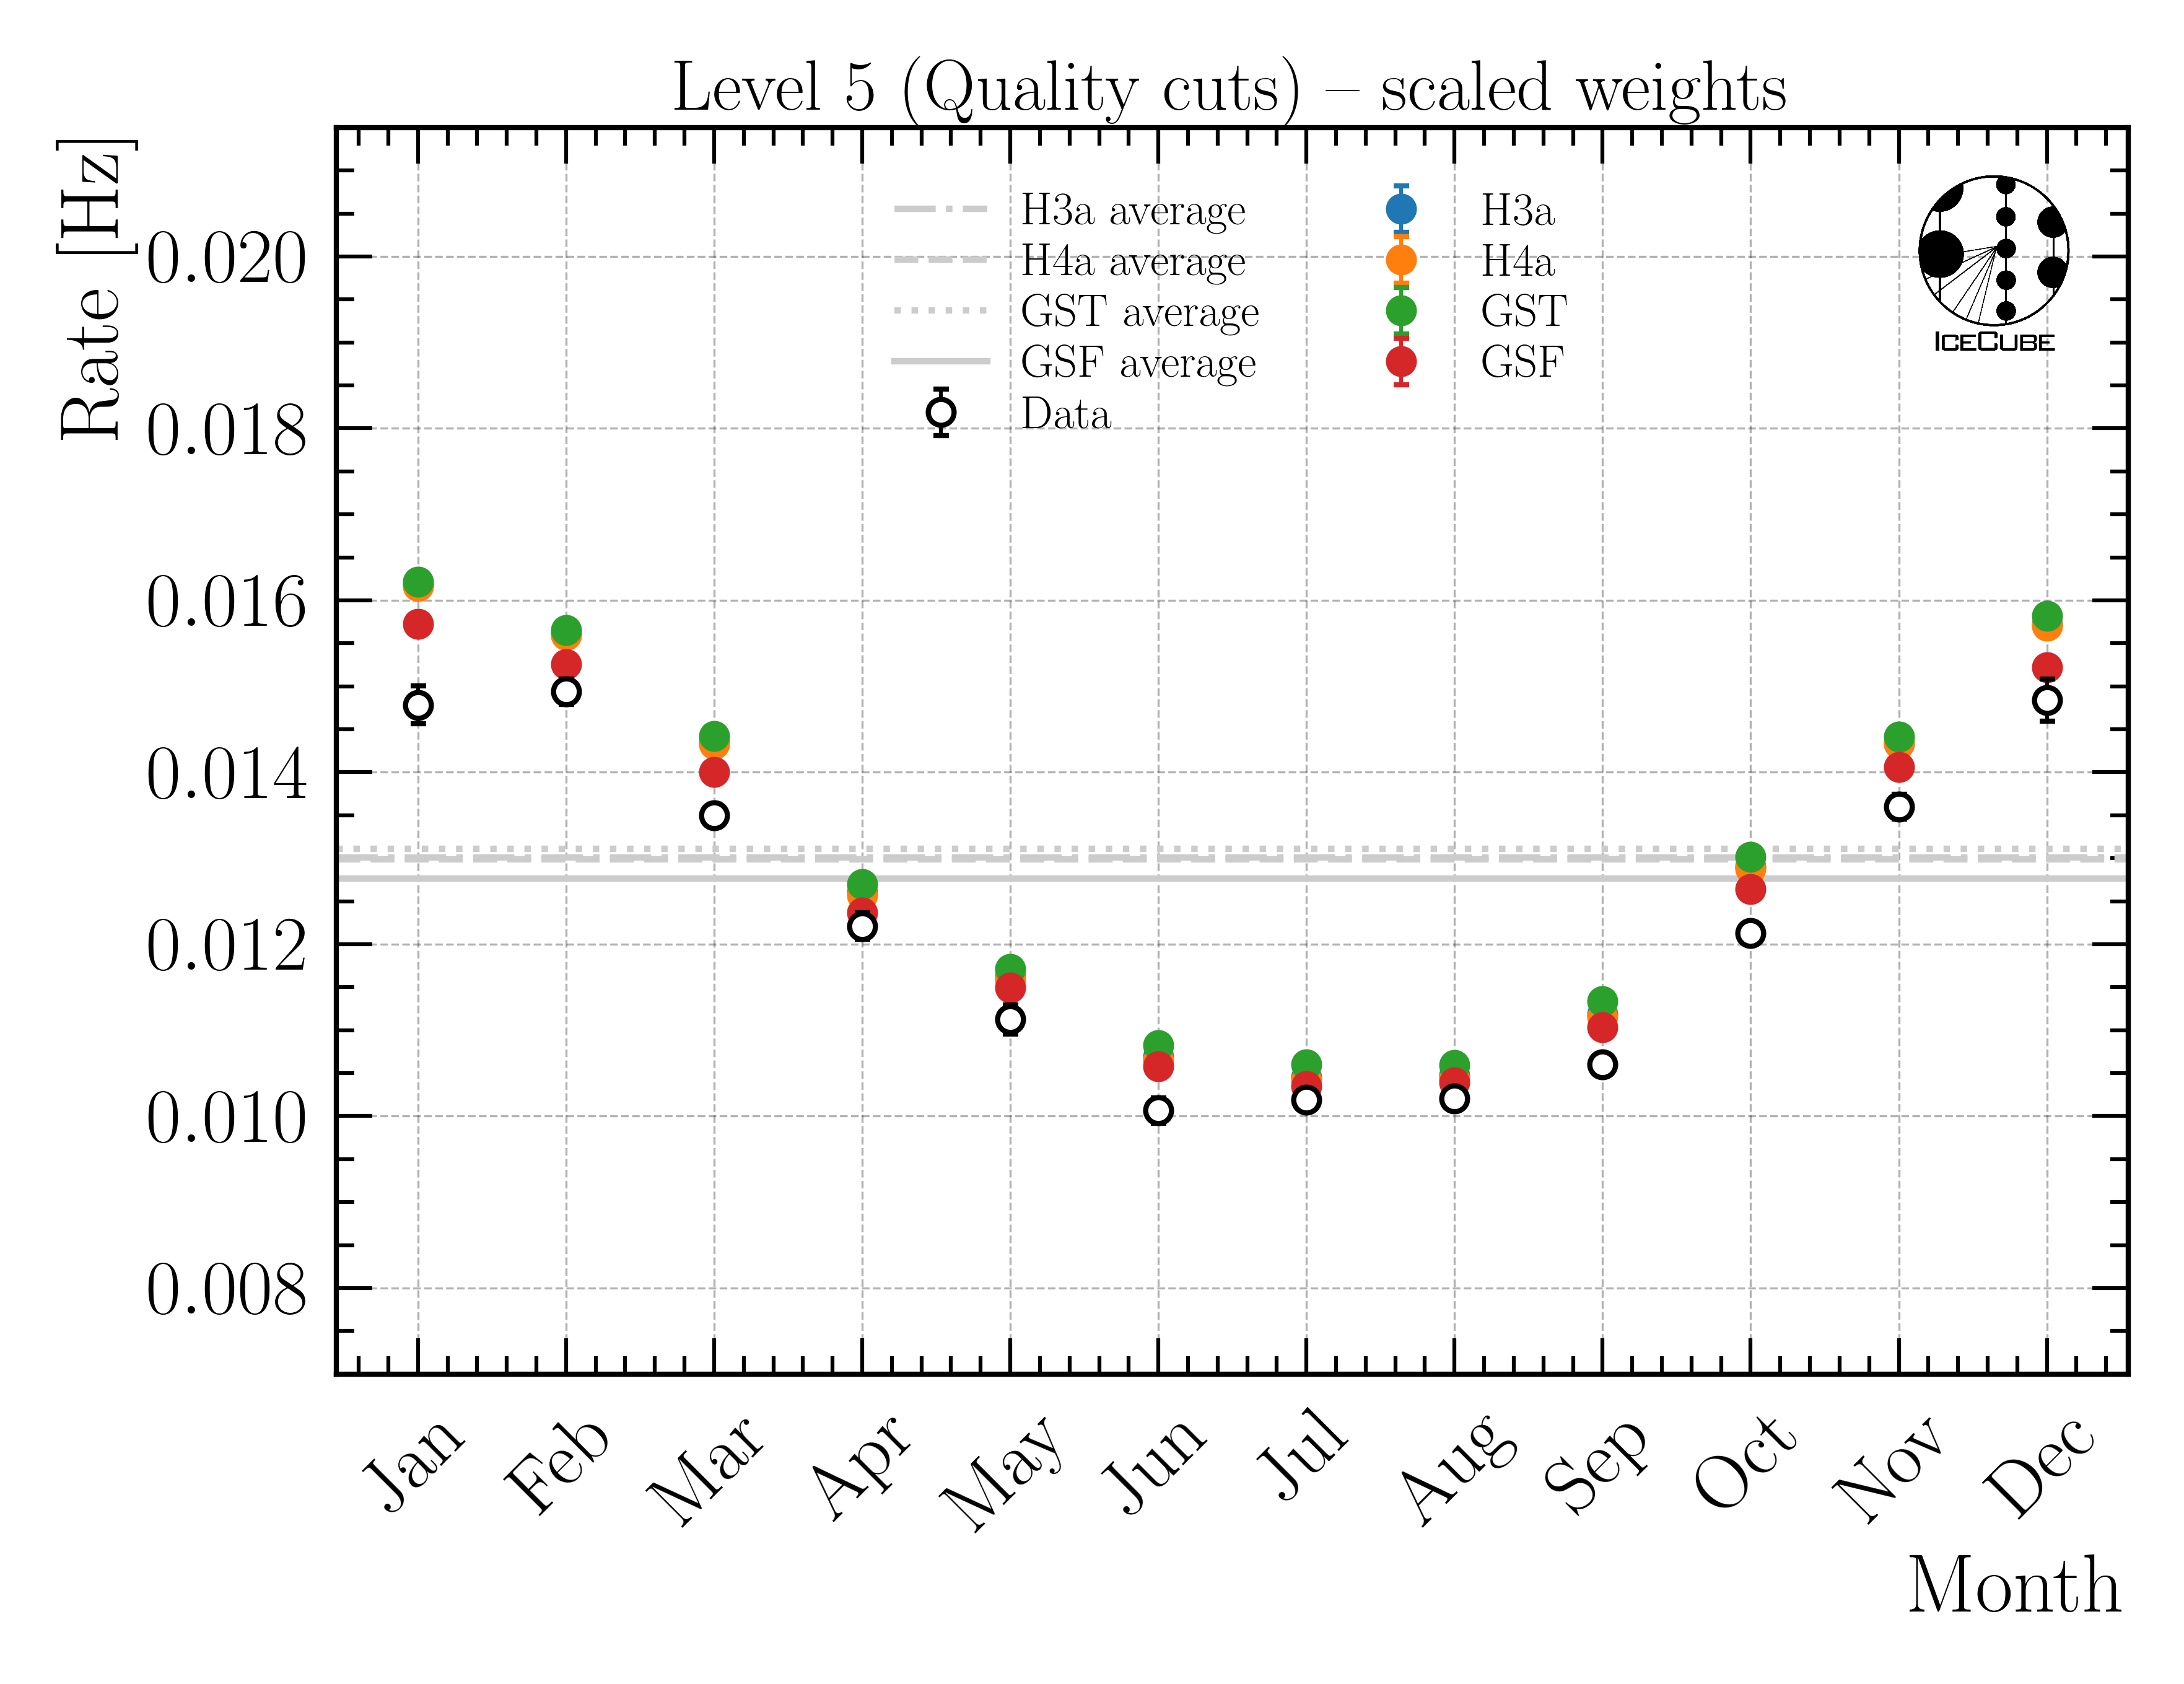
Fig. 96 : Rate per month for different primary flux models with scaled weights.
Note
The data-MC comparisons below are presented to investigate different properties of this dataset and the new DNN reconstructions after the quality cuts have been applied. However, for the unfolding, only the leading muon energy at entry is utilized, and thus, data-MC mismatches in other variables do not affect the unfolding result.
Energy
Bundle energy at entry
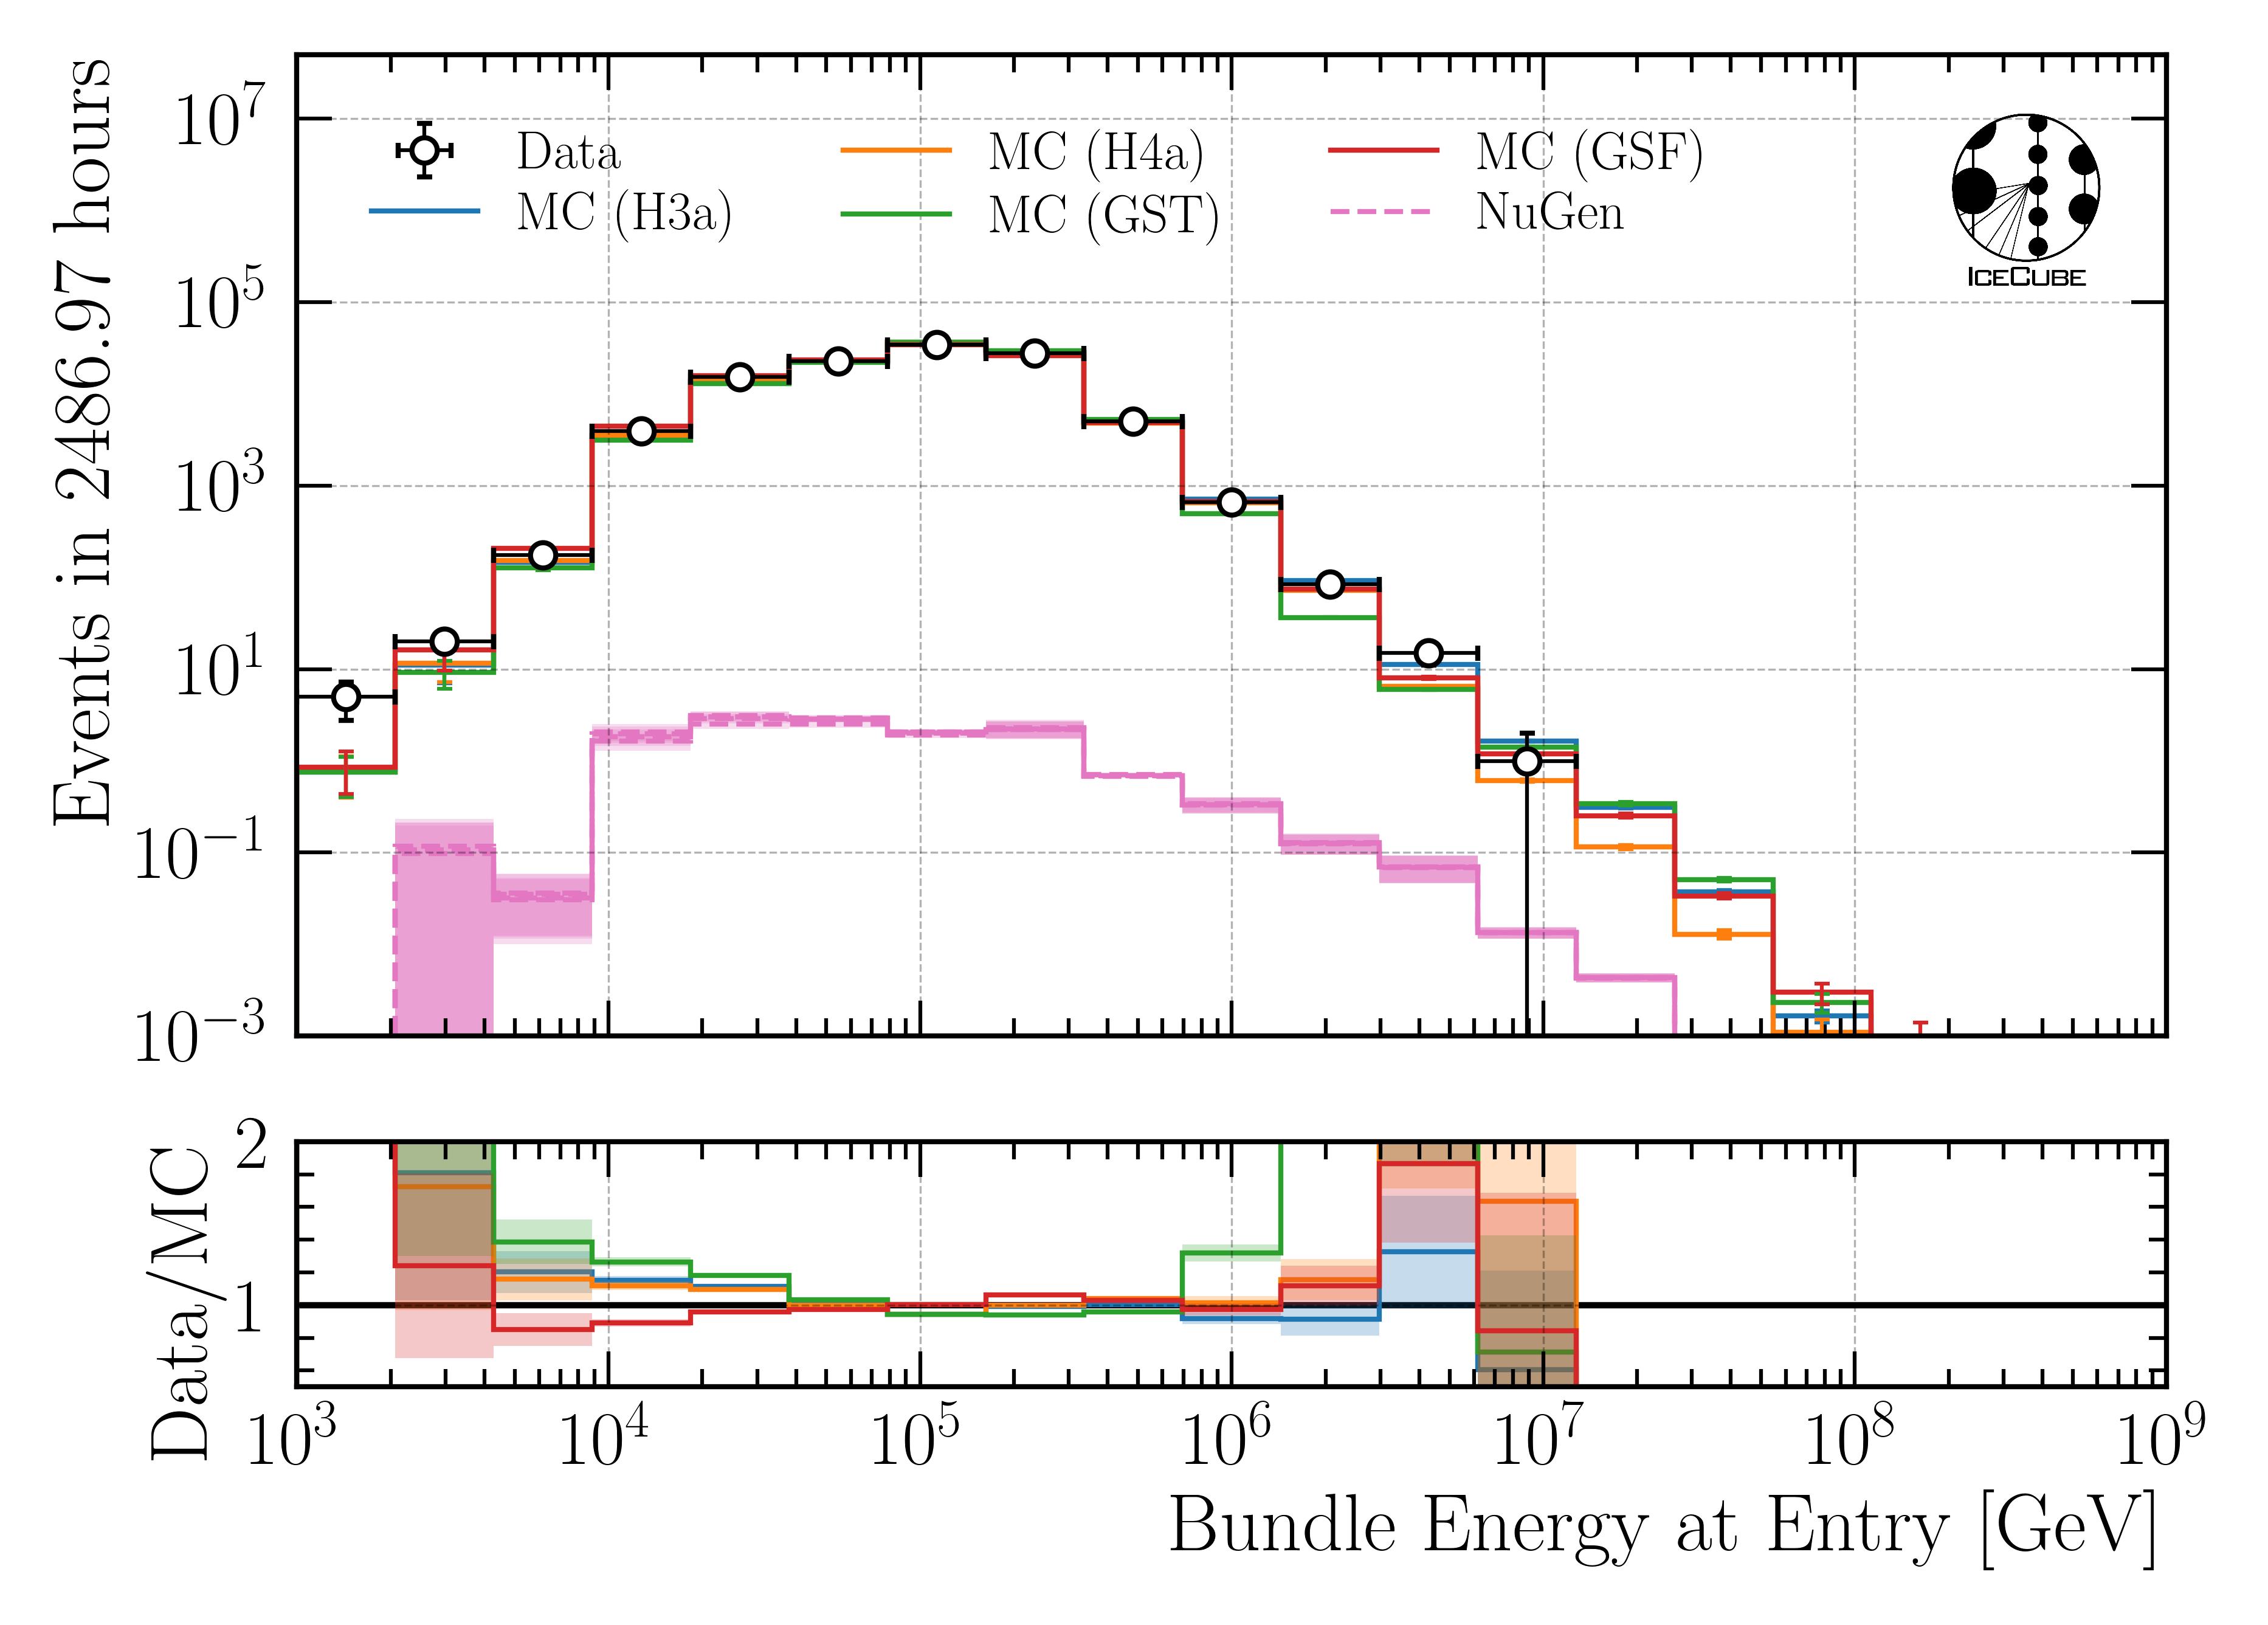
Fig. 97 : Bundle energy at entry reconstructed by DeepLearningReco_leading_bundle_surface_leading_bundle_energy_OC_inputs9_6ms_large_log_02.
Leading muon energy at entry
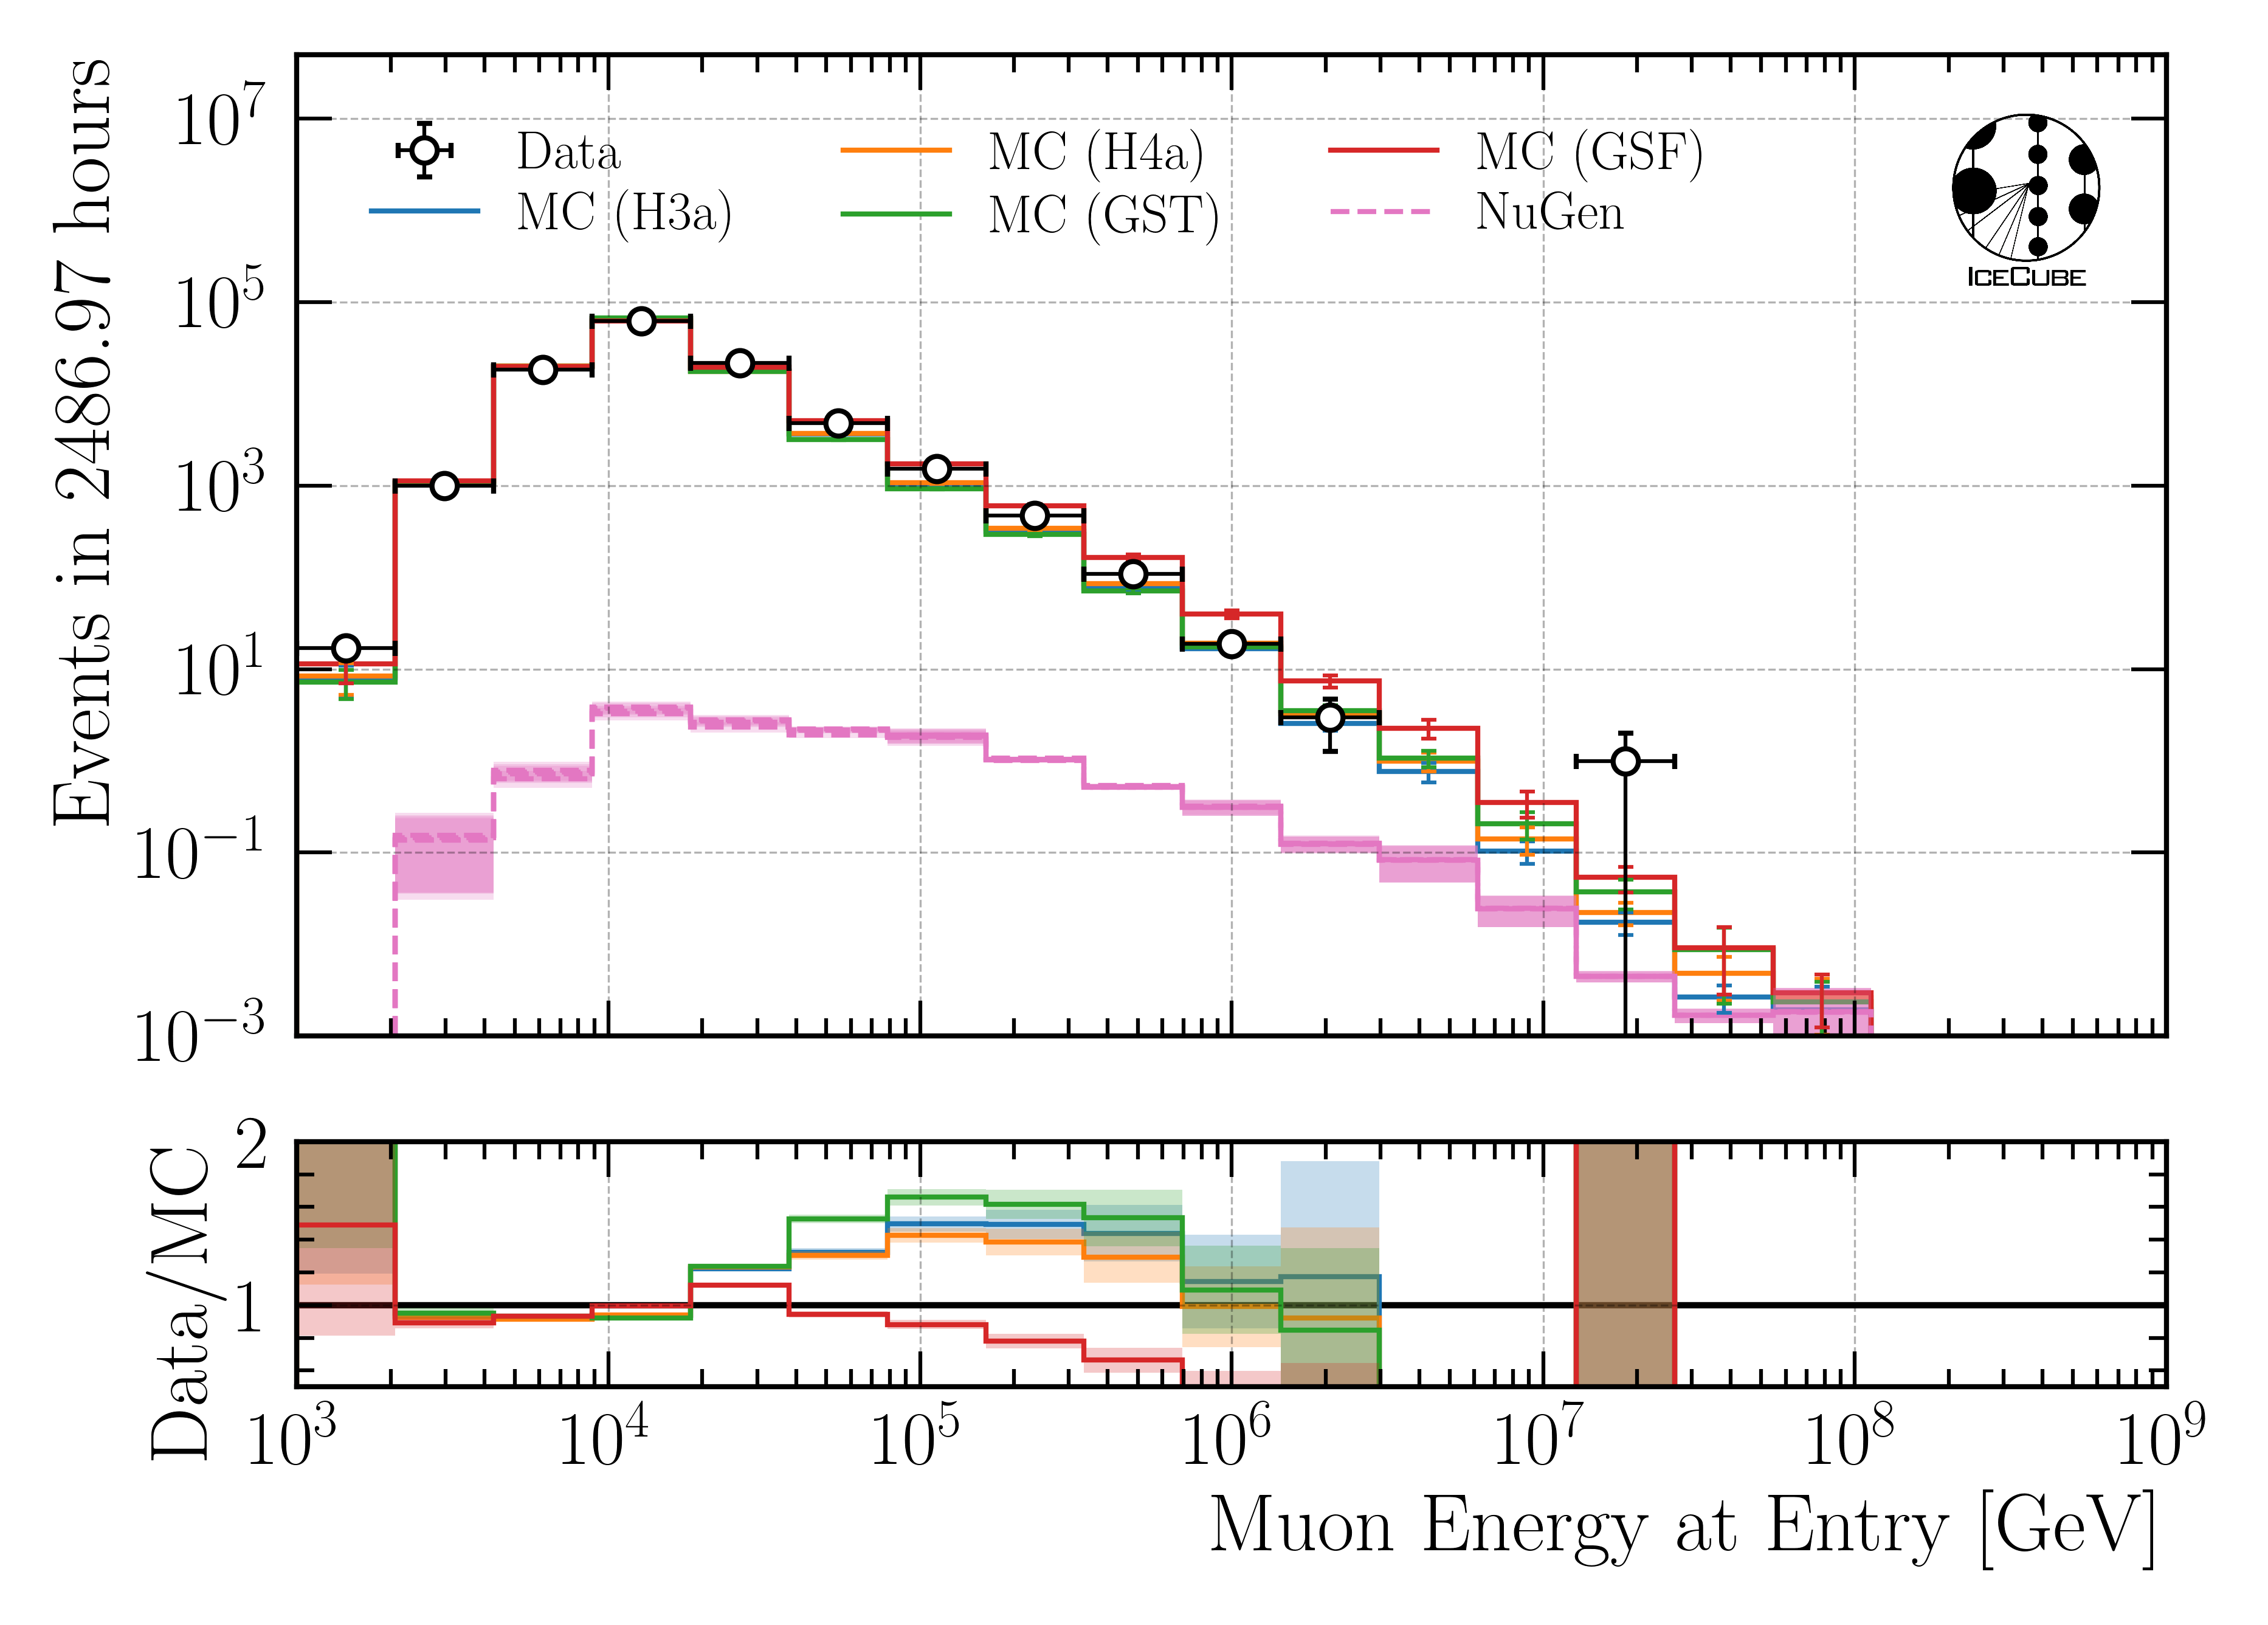
Fig. 98 : Leading muon energy at entry reconstructed by DeepLearningReco_leading_bundle_surface_leading_bundle_energy_OC_inputs9_6ms_large_log_02.
Bundle energy at surface
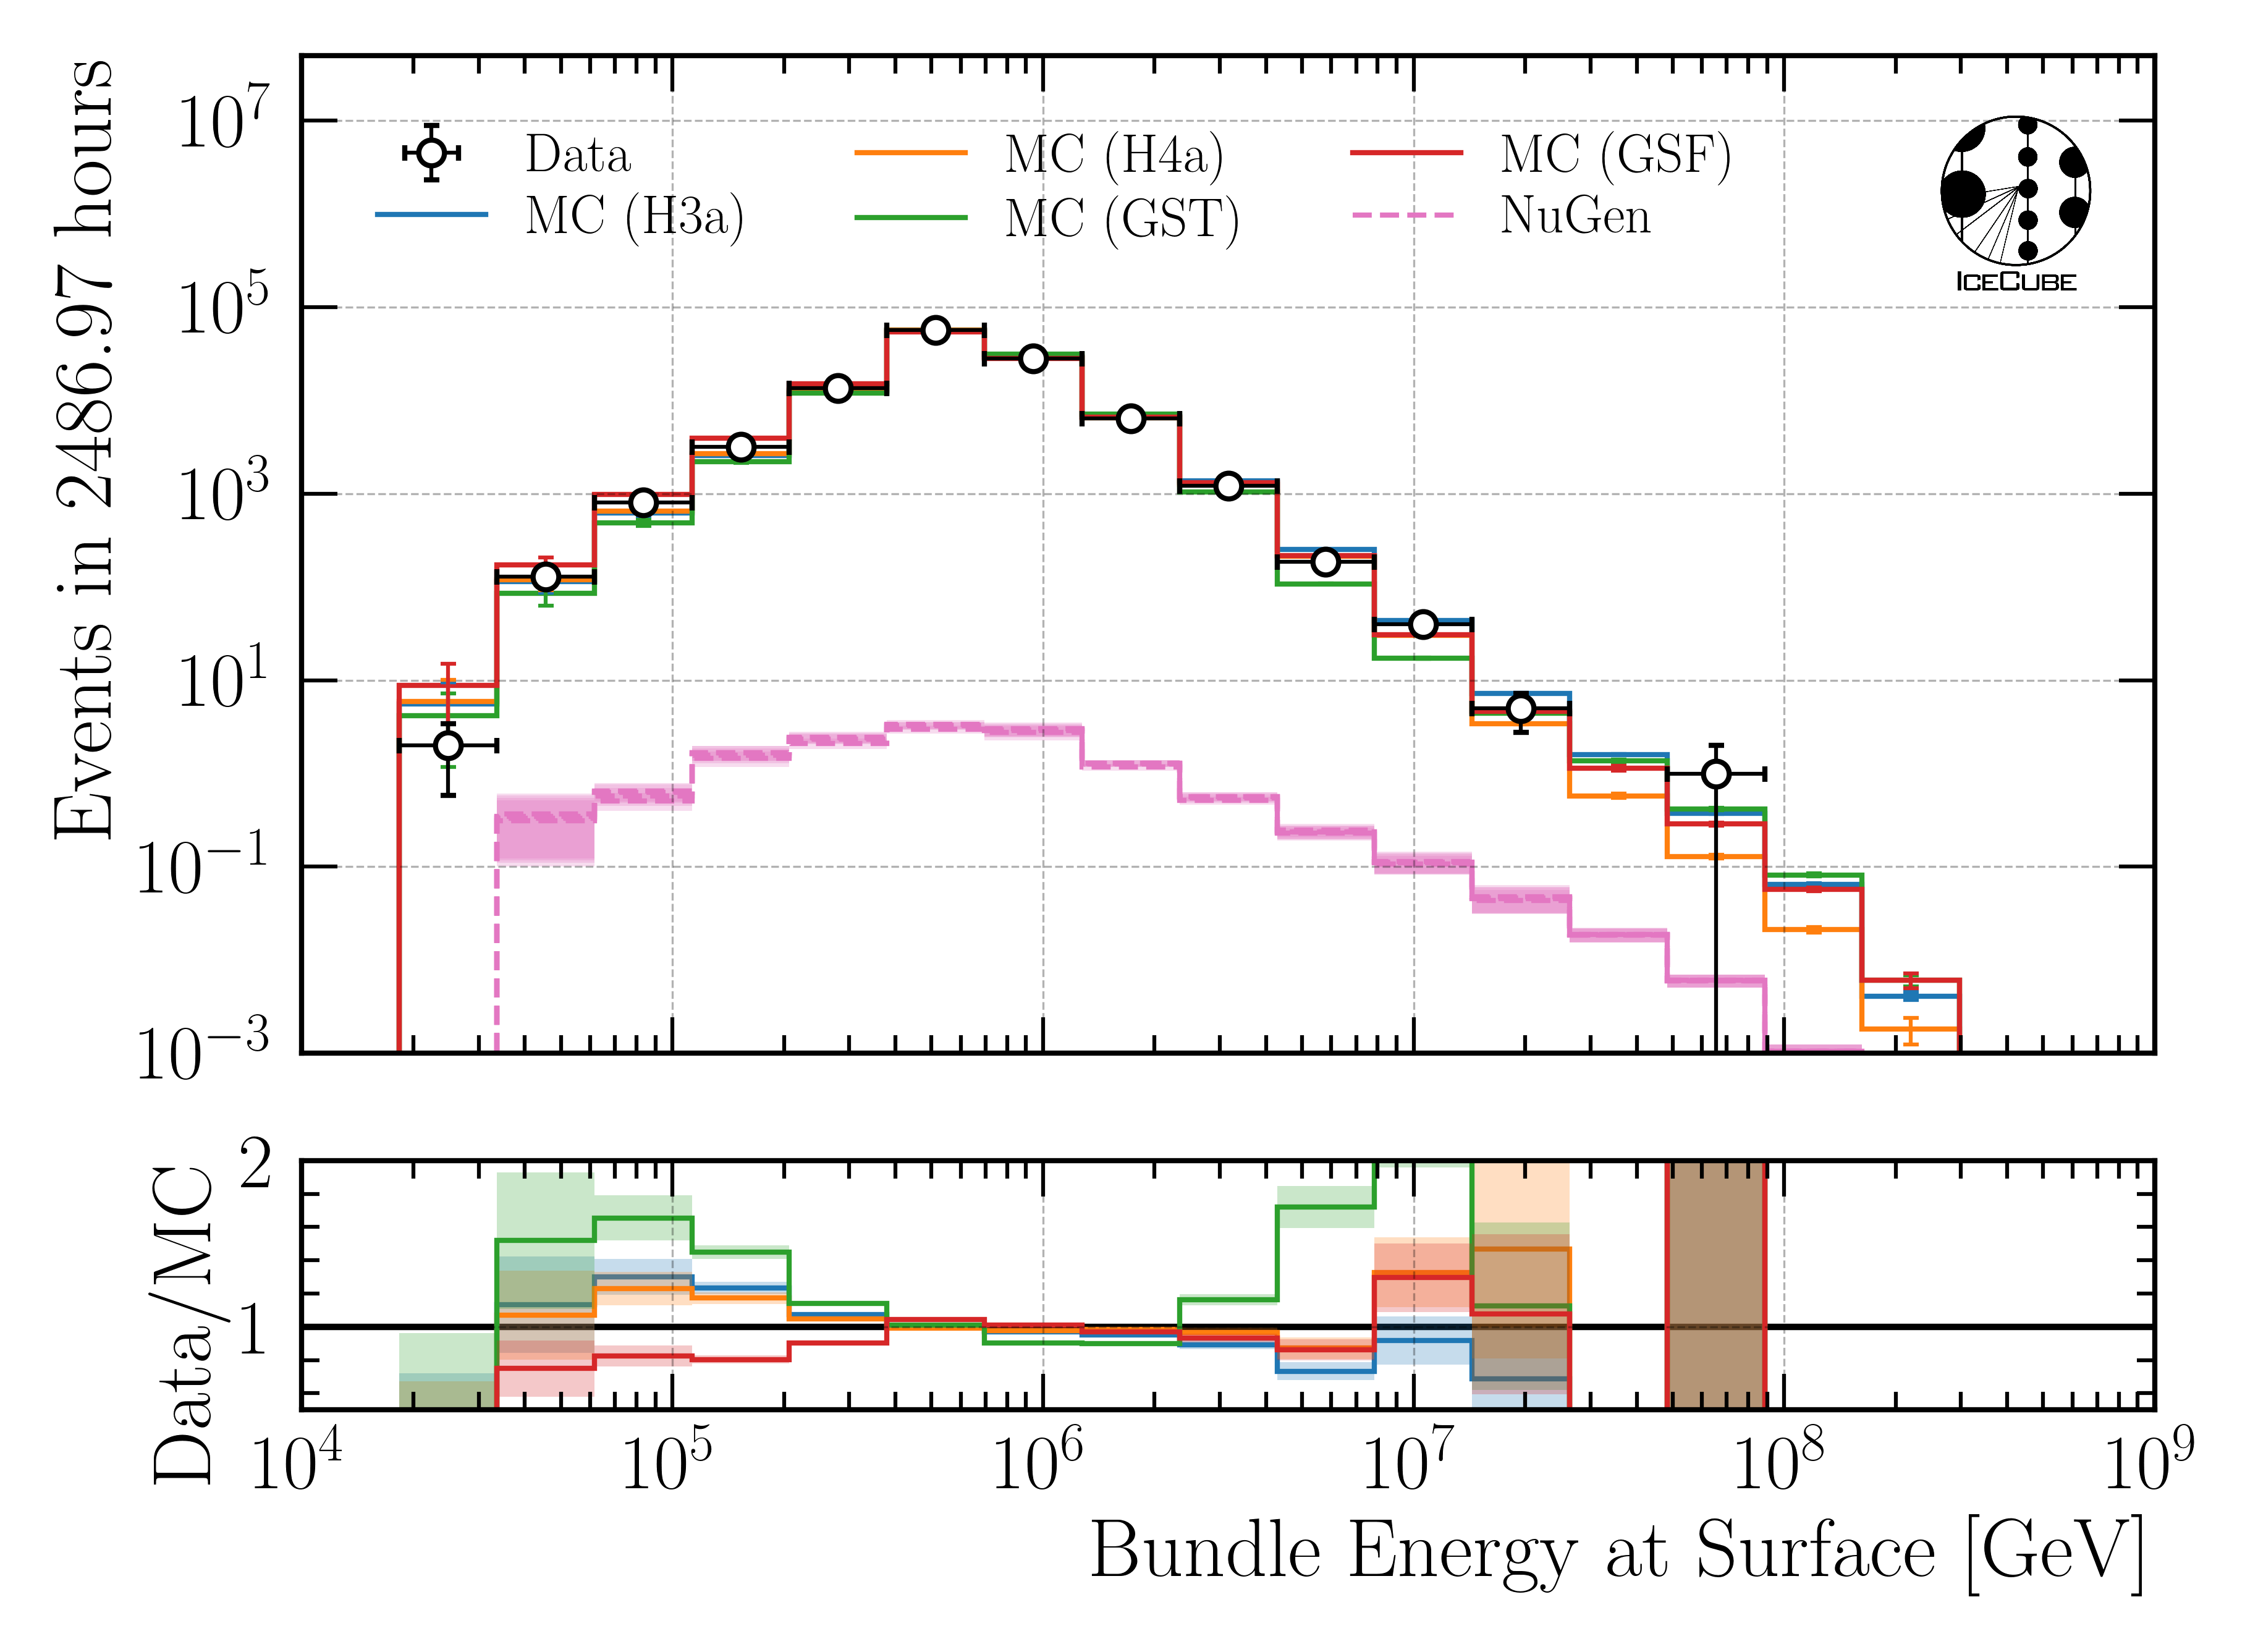
Fig. 99 : Bundle energy at surface reconstructed by DeepLearningReco_leading_bundle_surface_leading_bundle_energy_OC_inputs9_6ms_large_log_02.
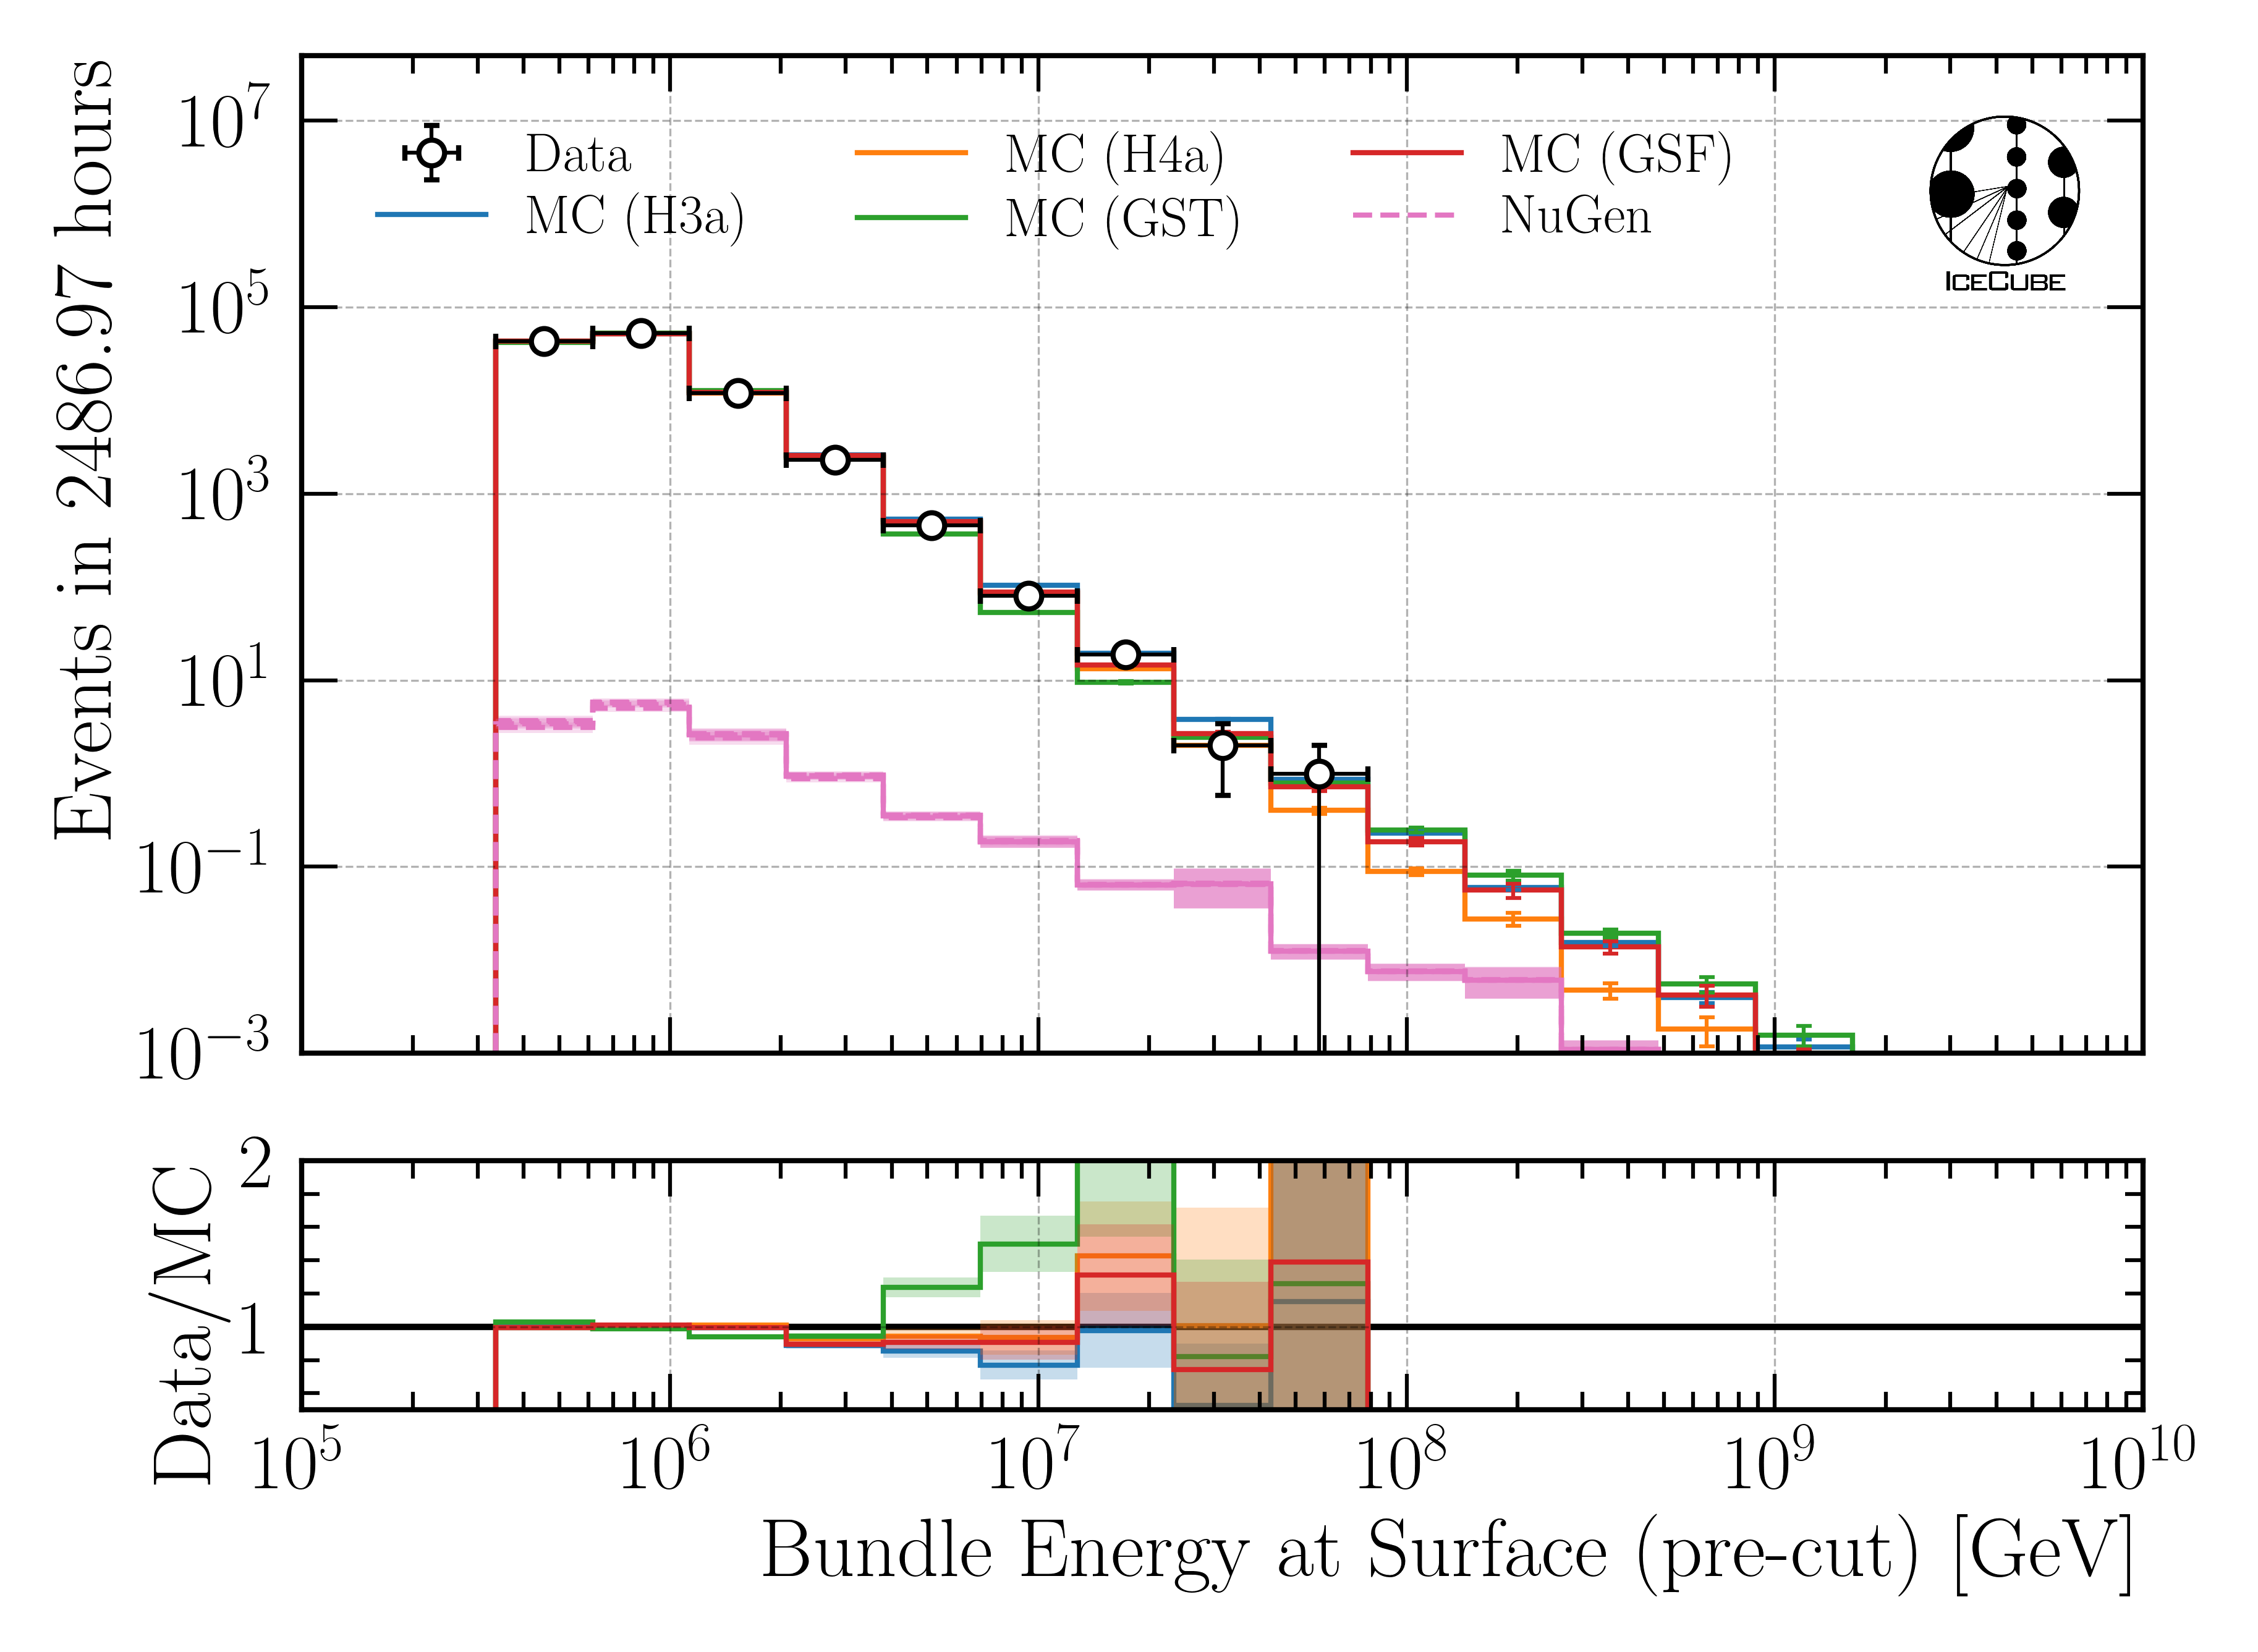
Fig. 100 : Bundle energy at surface reconstructed by pre-cut network DeepLearningReco_precut_surface_bundle_energy_3inputs_6ms_01.
Leading muon energy at surface
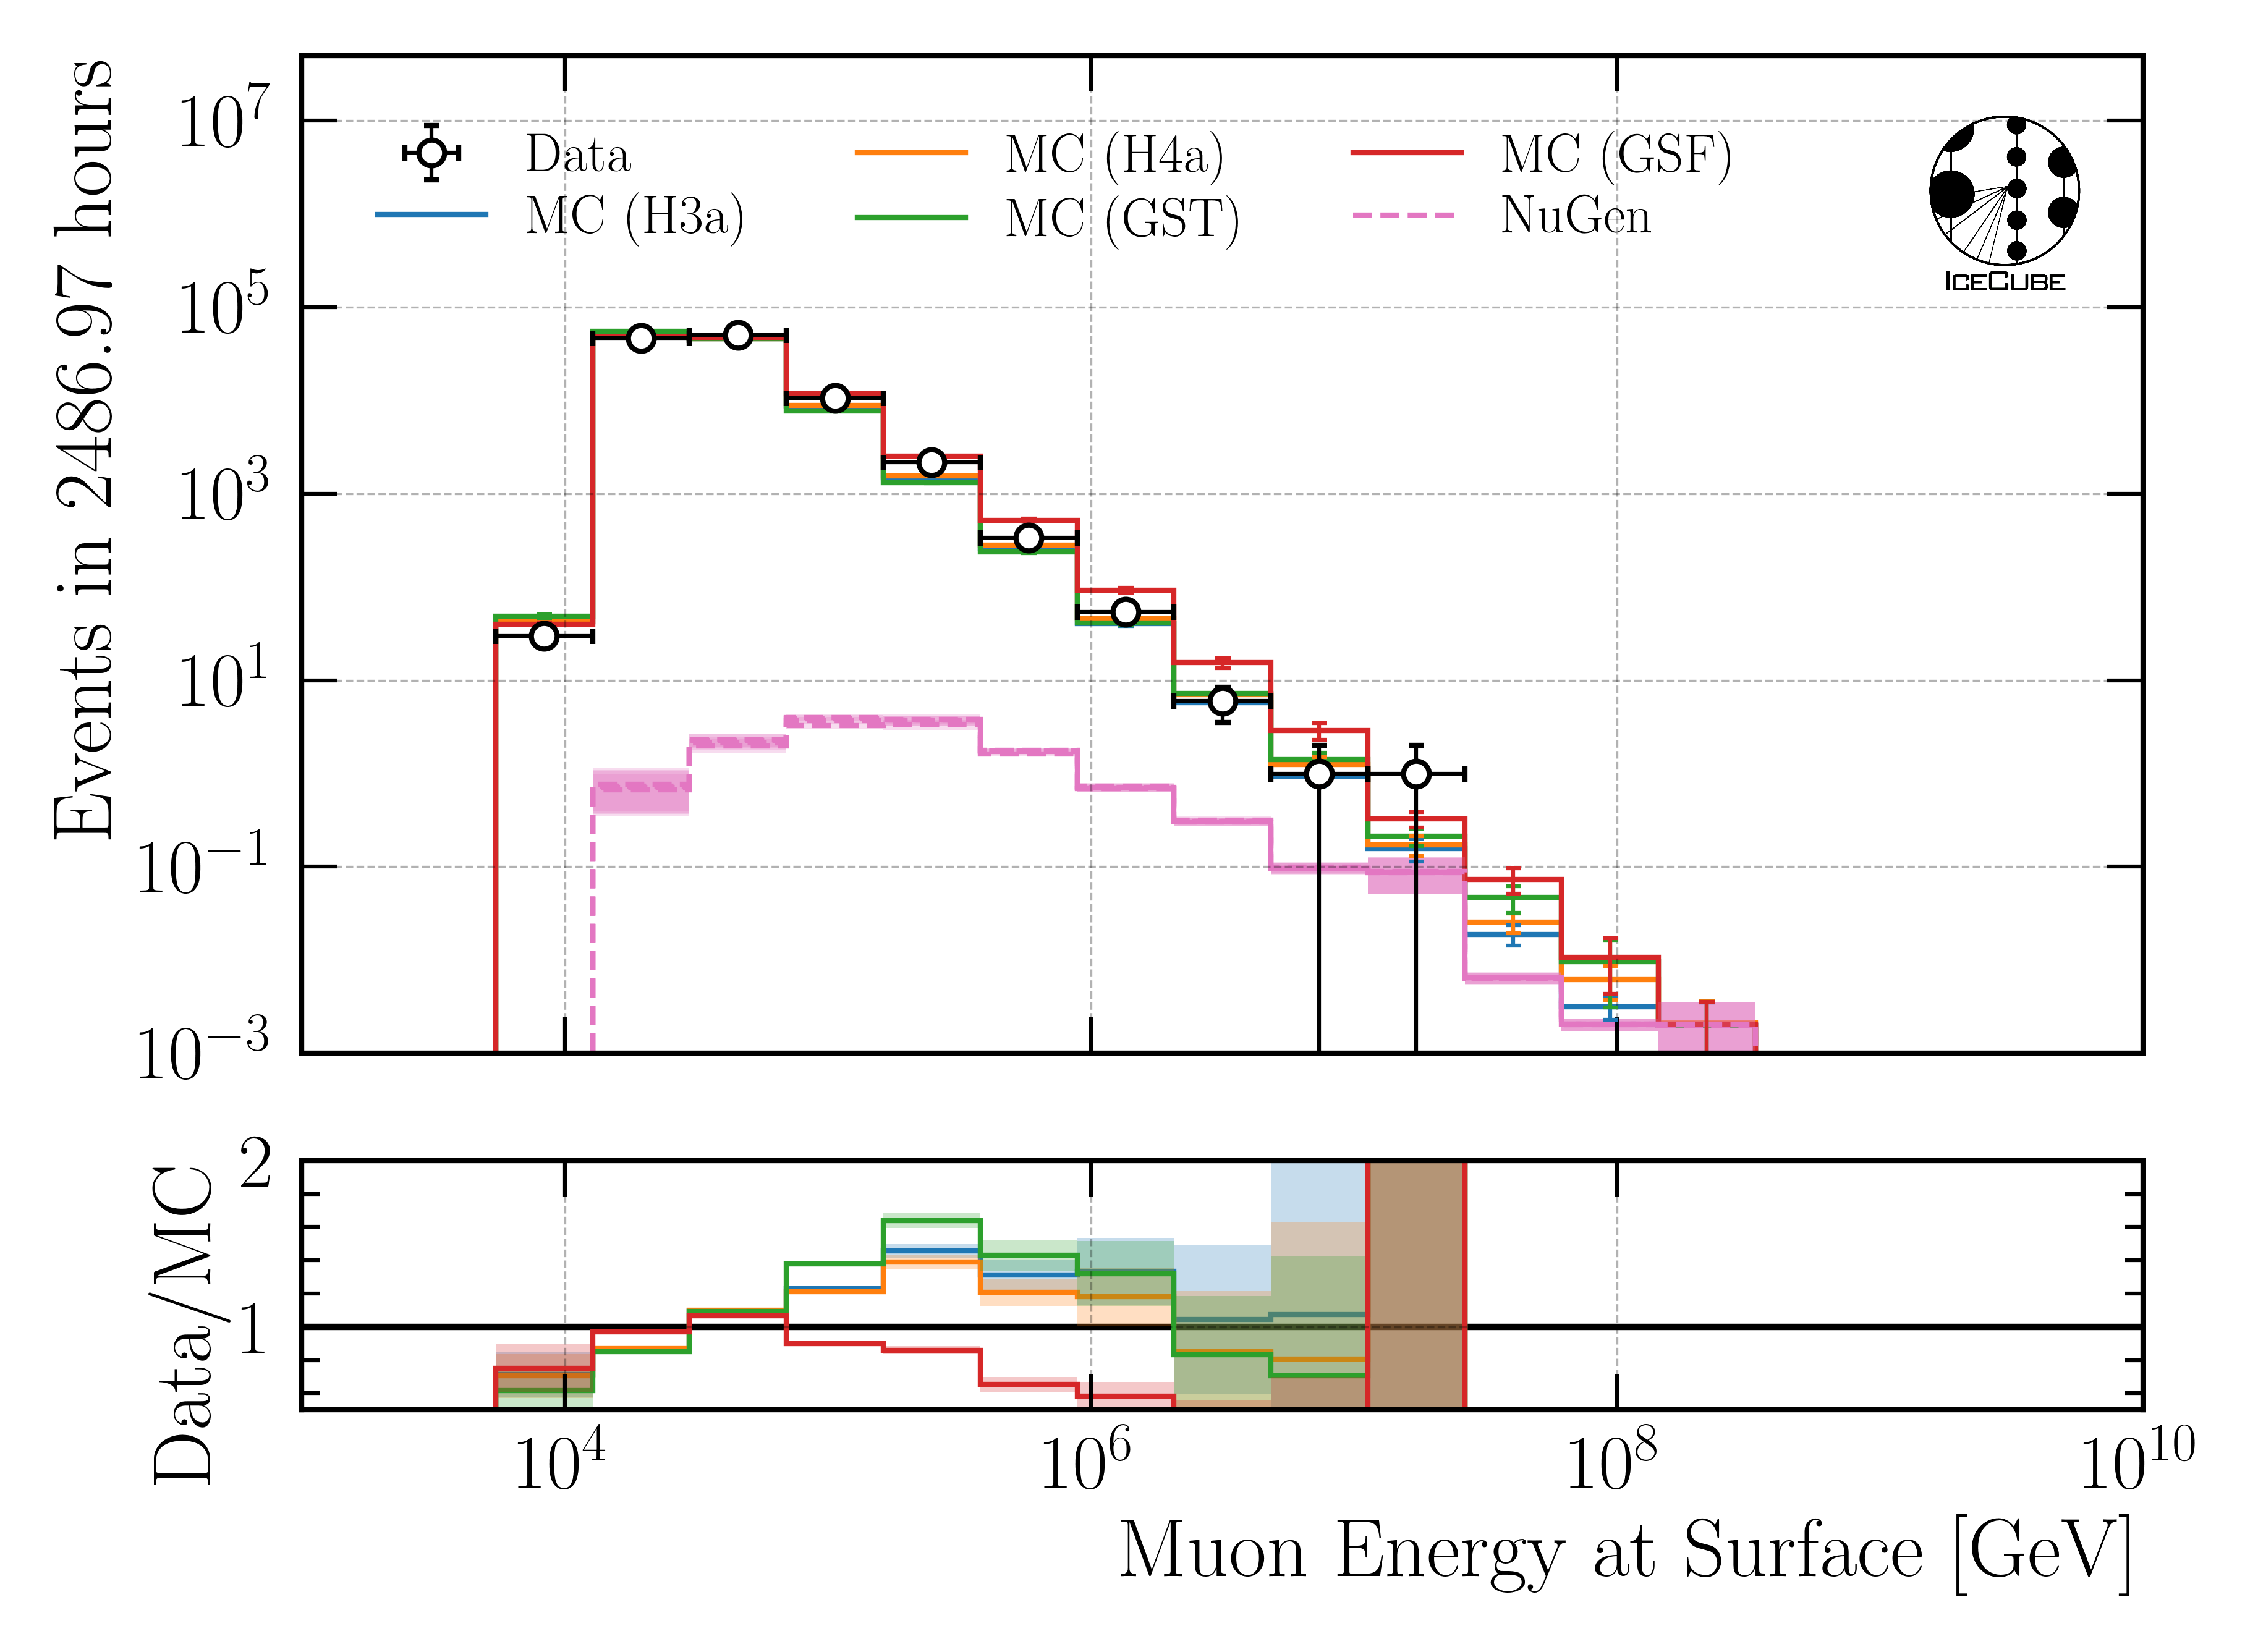
Fig. 101 : Leading muon energy at surface reconstructed by DeepLearningReco_leading_bundle_surface_leading_bundle_energy_OC_inputs9_6ms_large_log_02.
Energy uncertainty
Bundle energy at entry - uncertainty
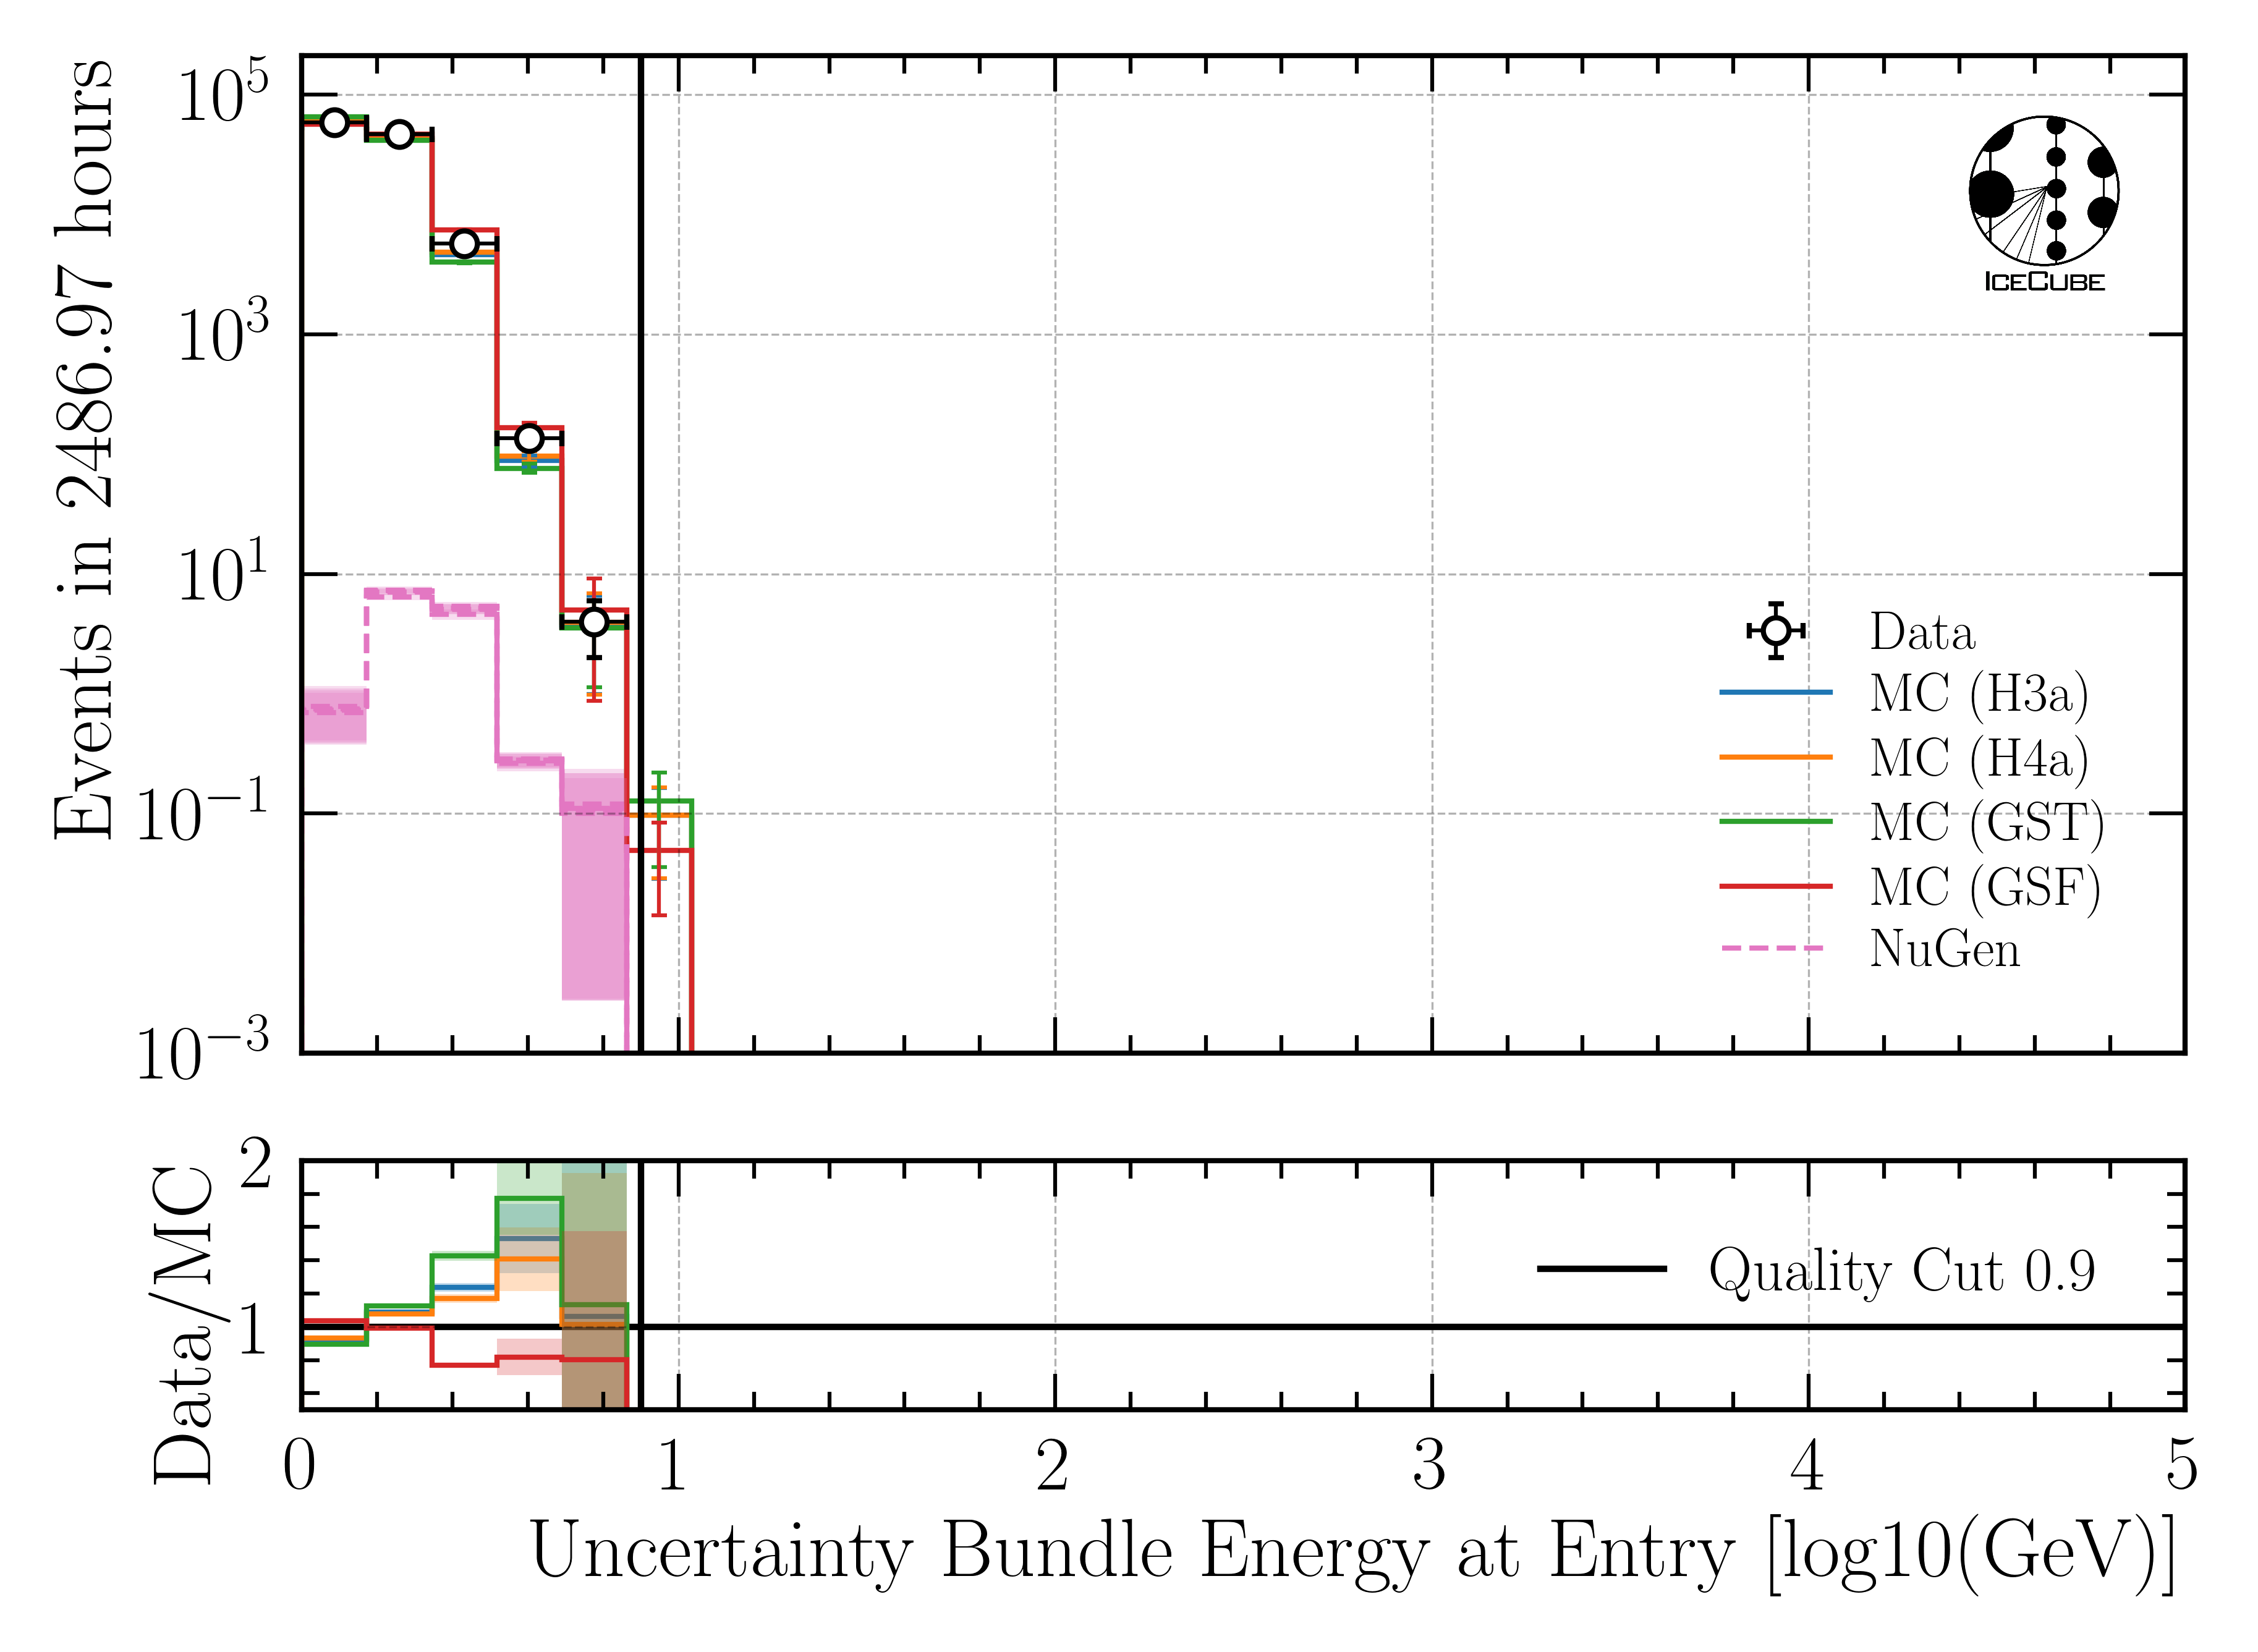
Fig. 102 : Uncertainty of bundle energy at entry reconstructed by DeepLearningReco_leading_bundle_surface_leading_bundle_energy_OC_inputs9_6ms_large_log_02.
Leading muon energy at entry - uncertainty
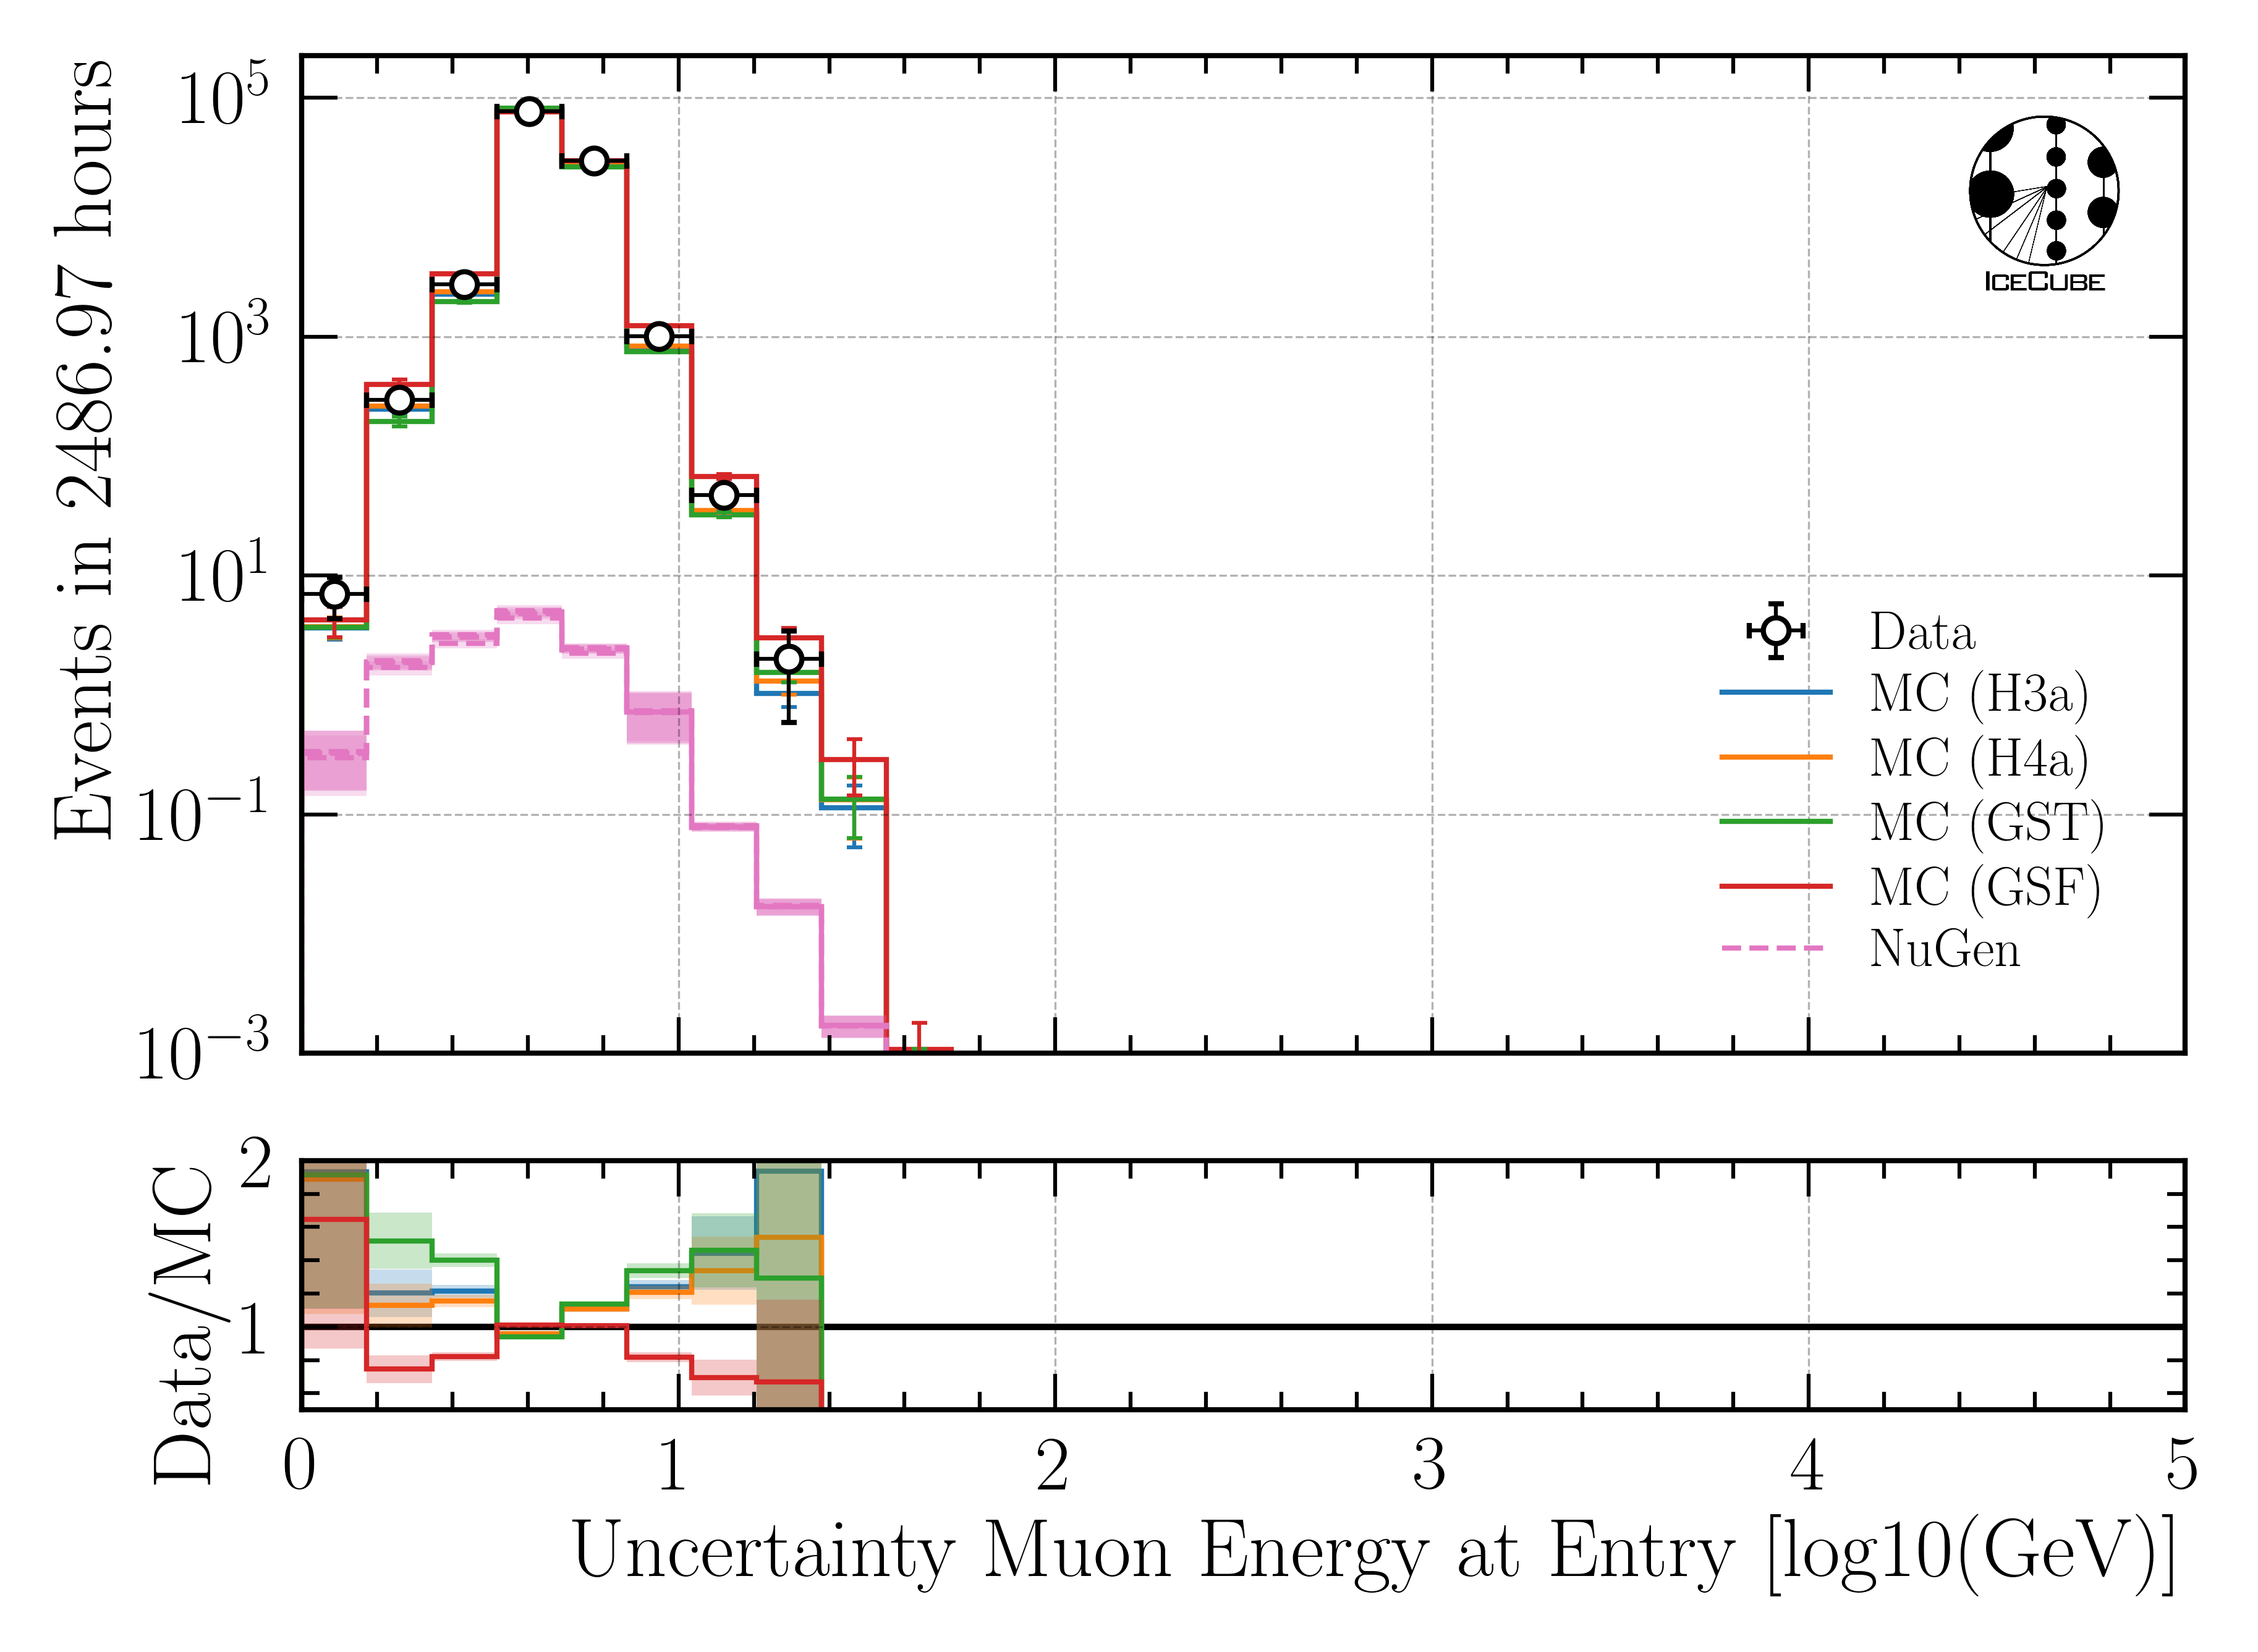
Fig. 103 : Uncertainty of leading muon energy at entry reconstructed by DeepLearningReco_leading_bundle_surface_leading_bundle_energy_OC_inputs9_6ms_large_log_02.
Bundle energy at surface - uncertainty
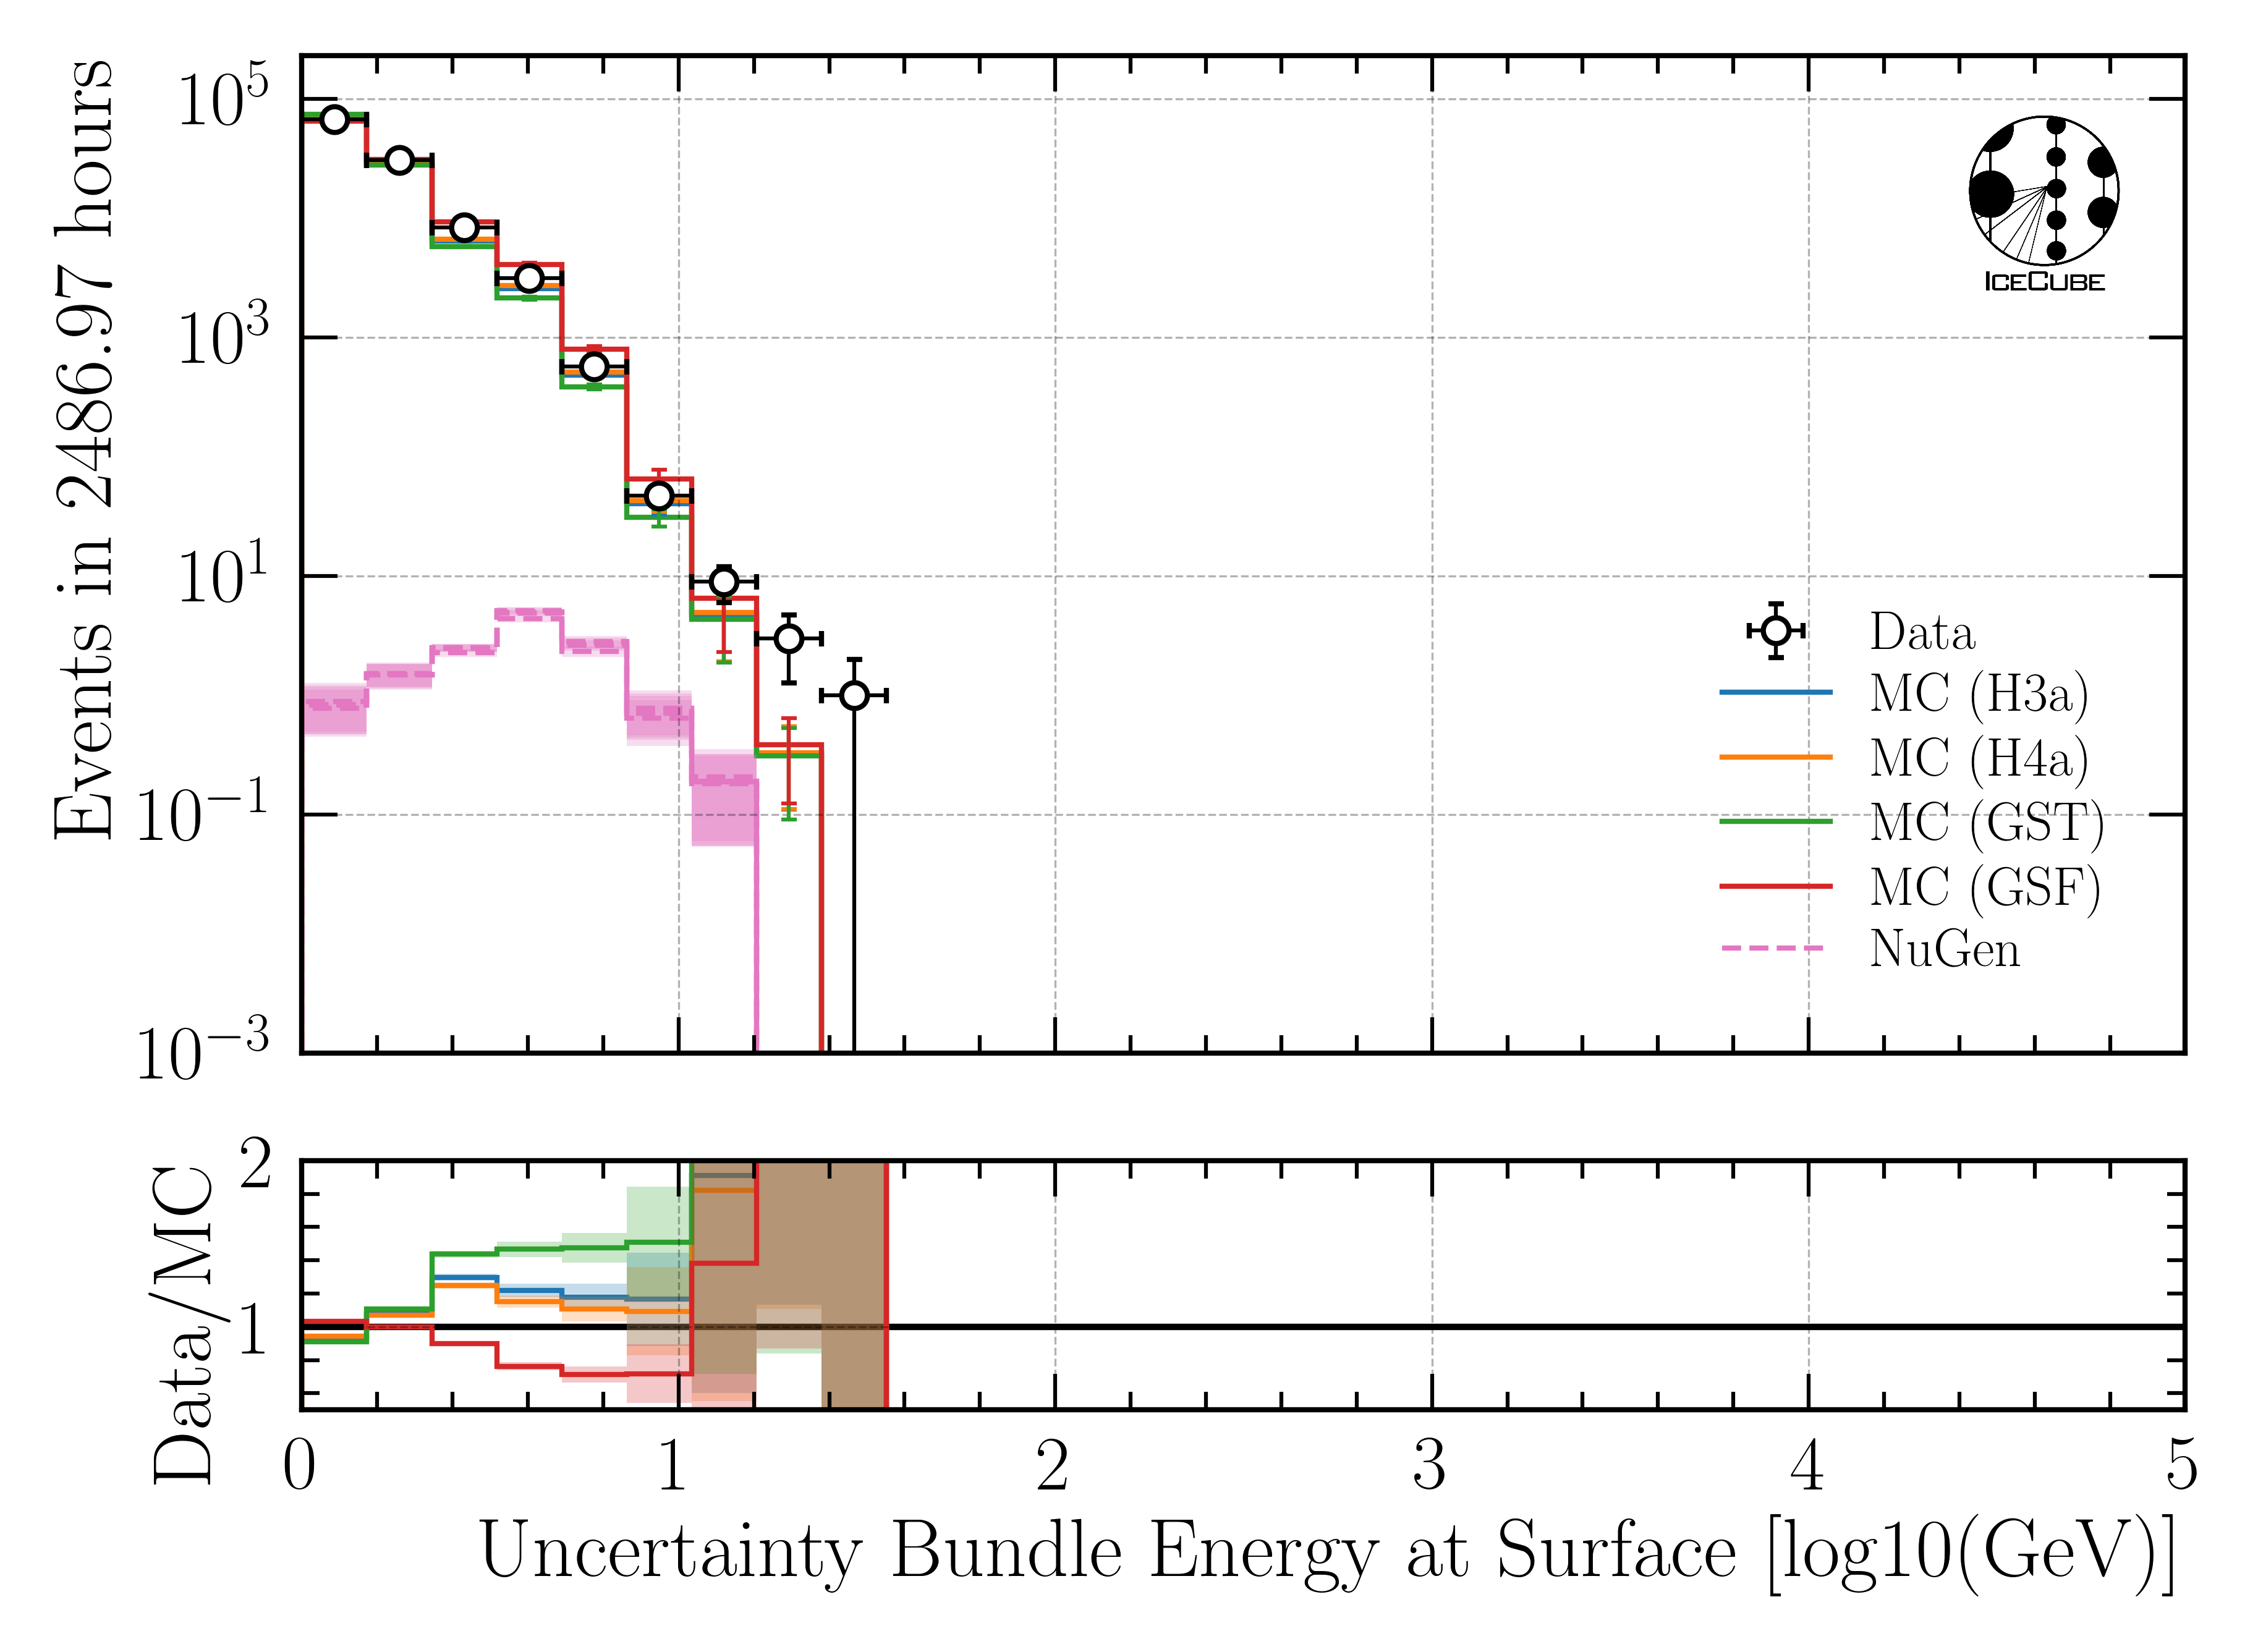
Fig. 104 : Uncertainty of bundle energy at surface reconstructed by DeepLearningReco_leading_bundle_surface_leading_bundle_energy_OC_inputs9_6ms_large_log_02.
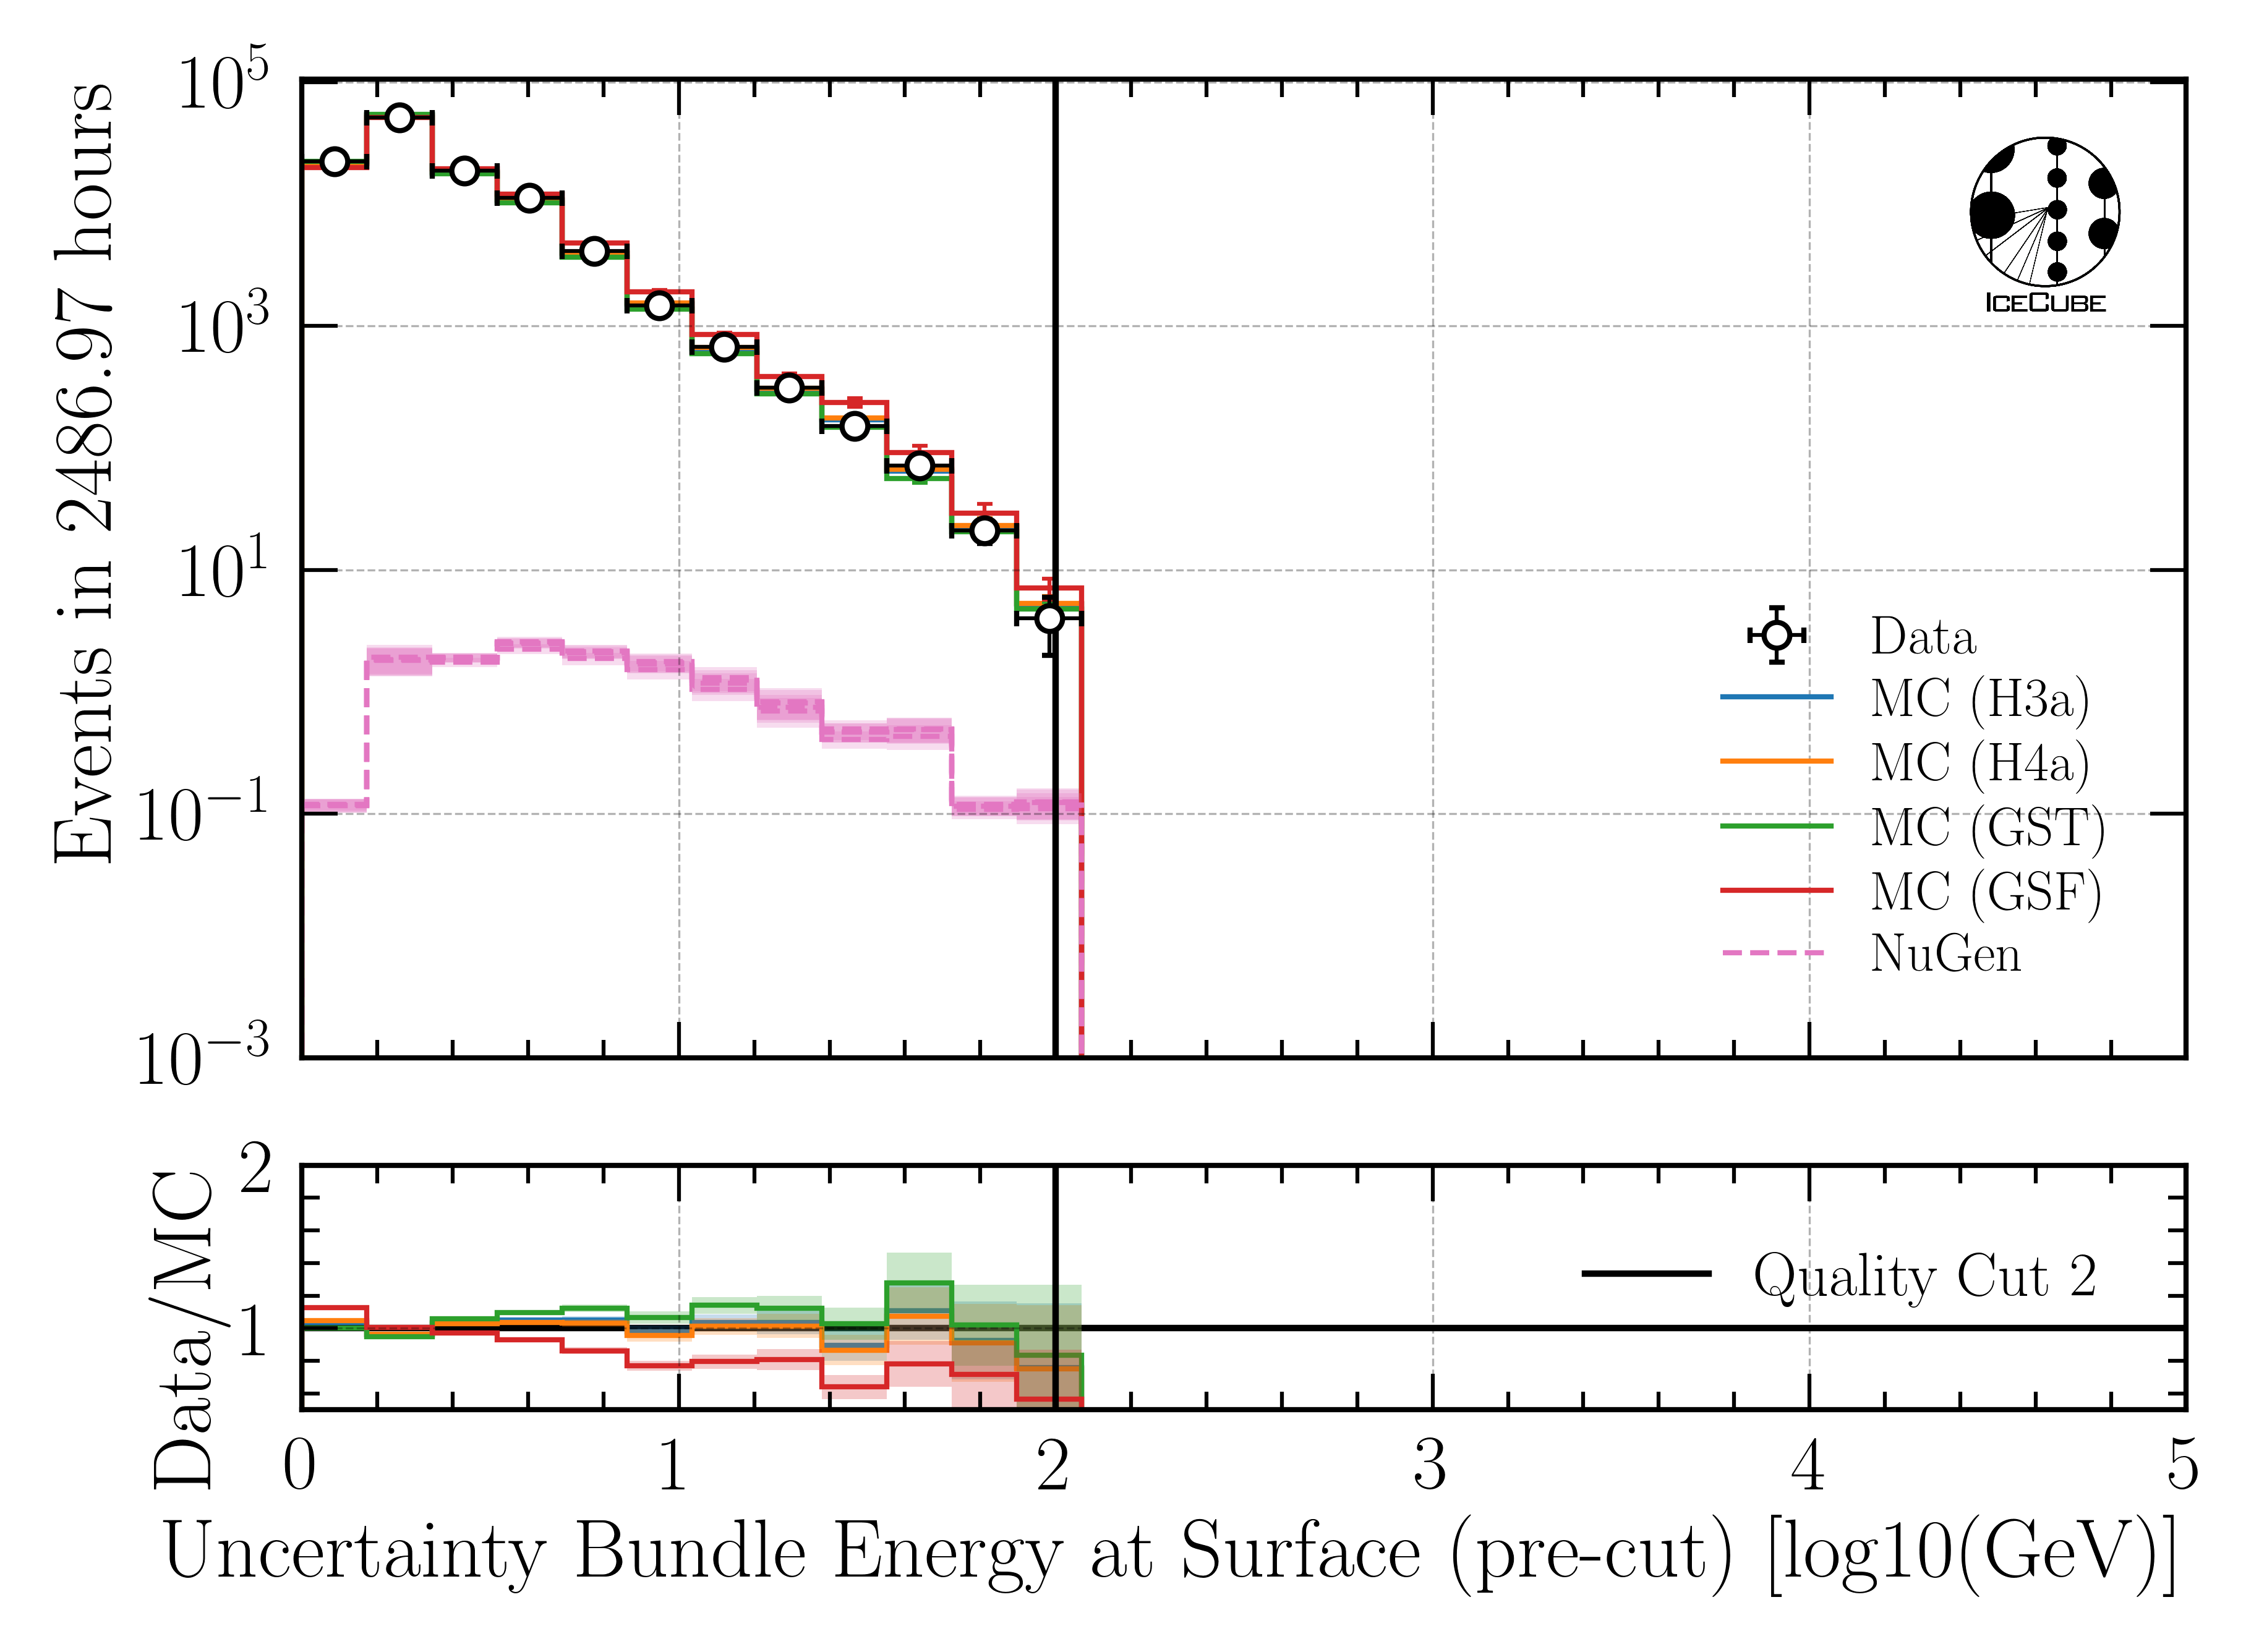
Fig. 105 : Uncertainty of bundle energy at surface reconstructed by pre-cut network DeepLearningReco_precut_surface_bundle_energy_3inputs_6ms_01.
Leading muon energy at surface - uncertainty
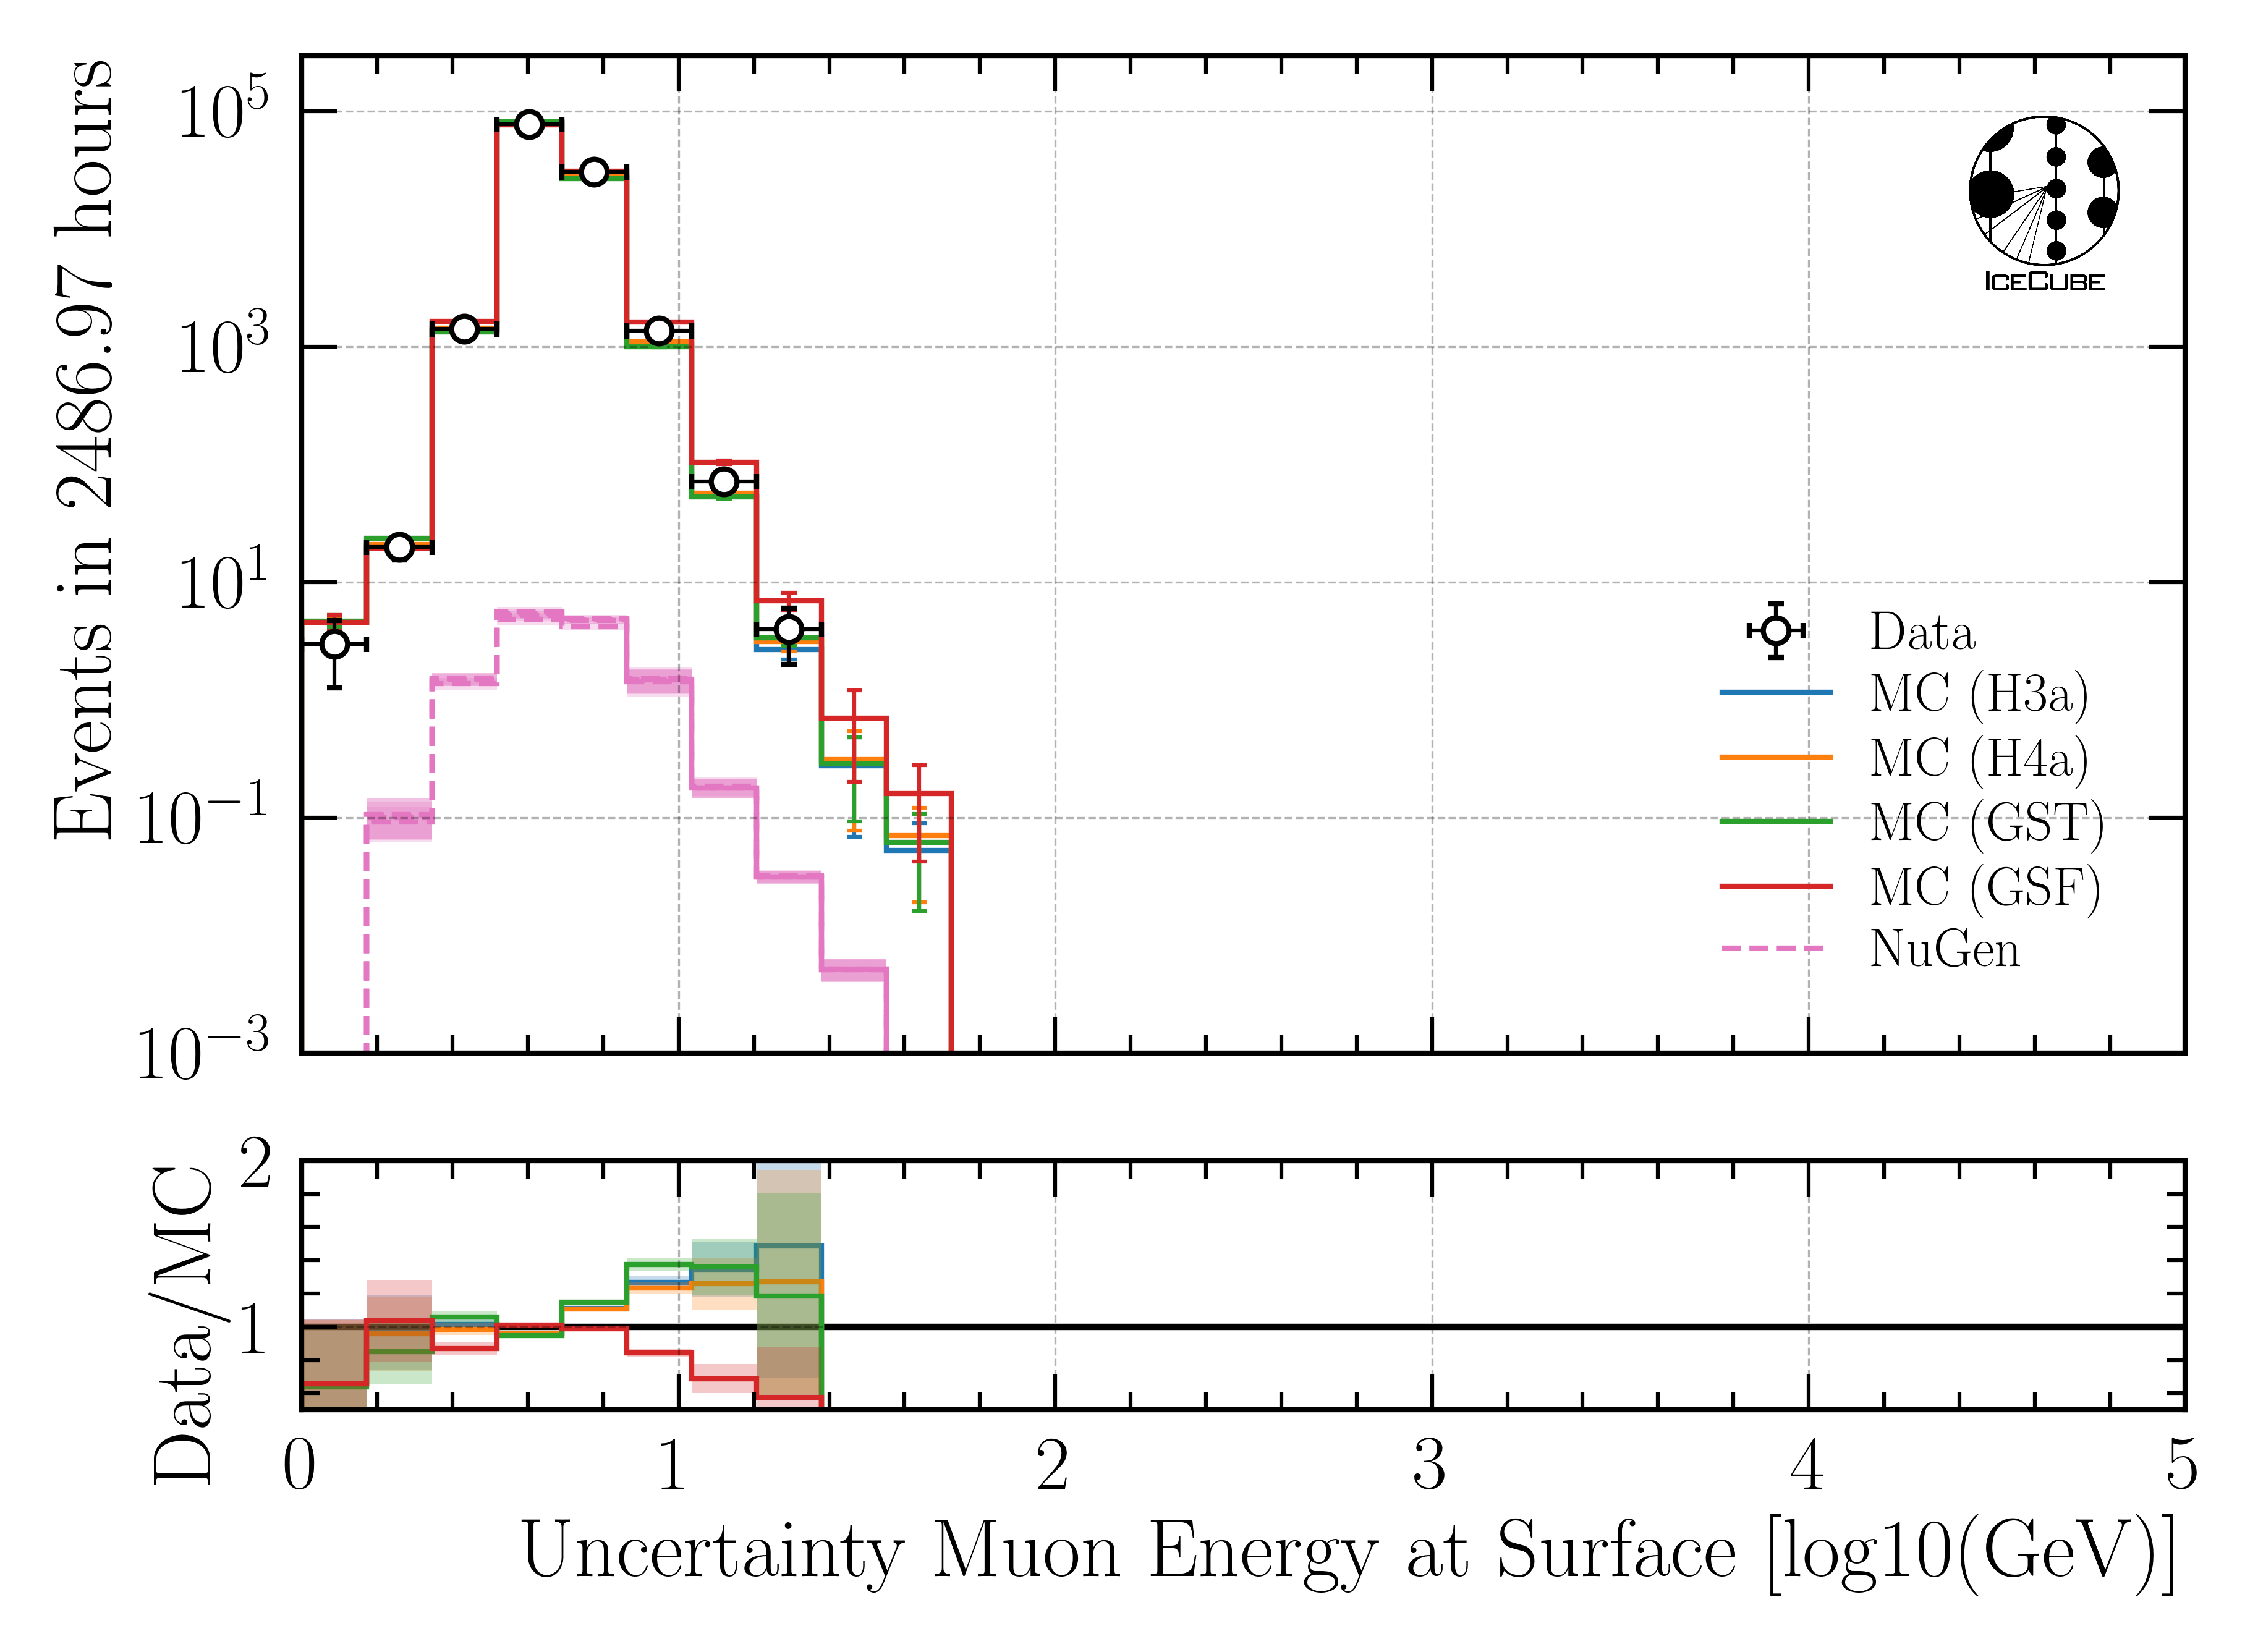
Fig. 106 : Uncertainty of leading muon energy at surface reconstructed by DeepLearningReco_leading_bundle_surface_leading_bundle_energy_OC_inputs9_6ms_large_log_02.
Zenith
Cosine zenith
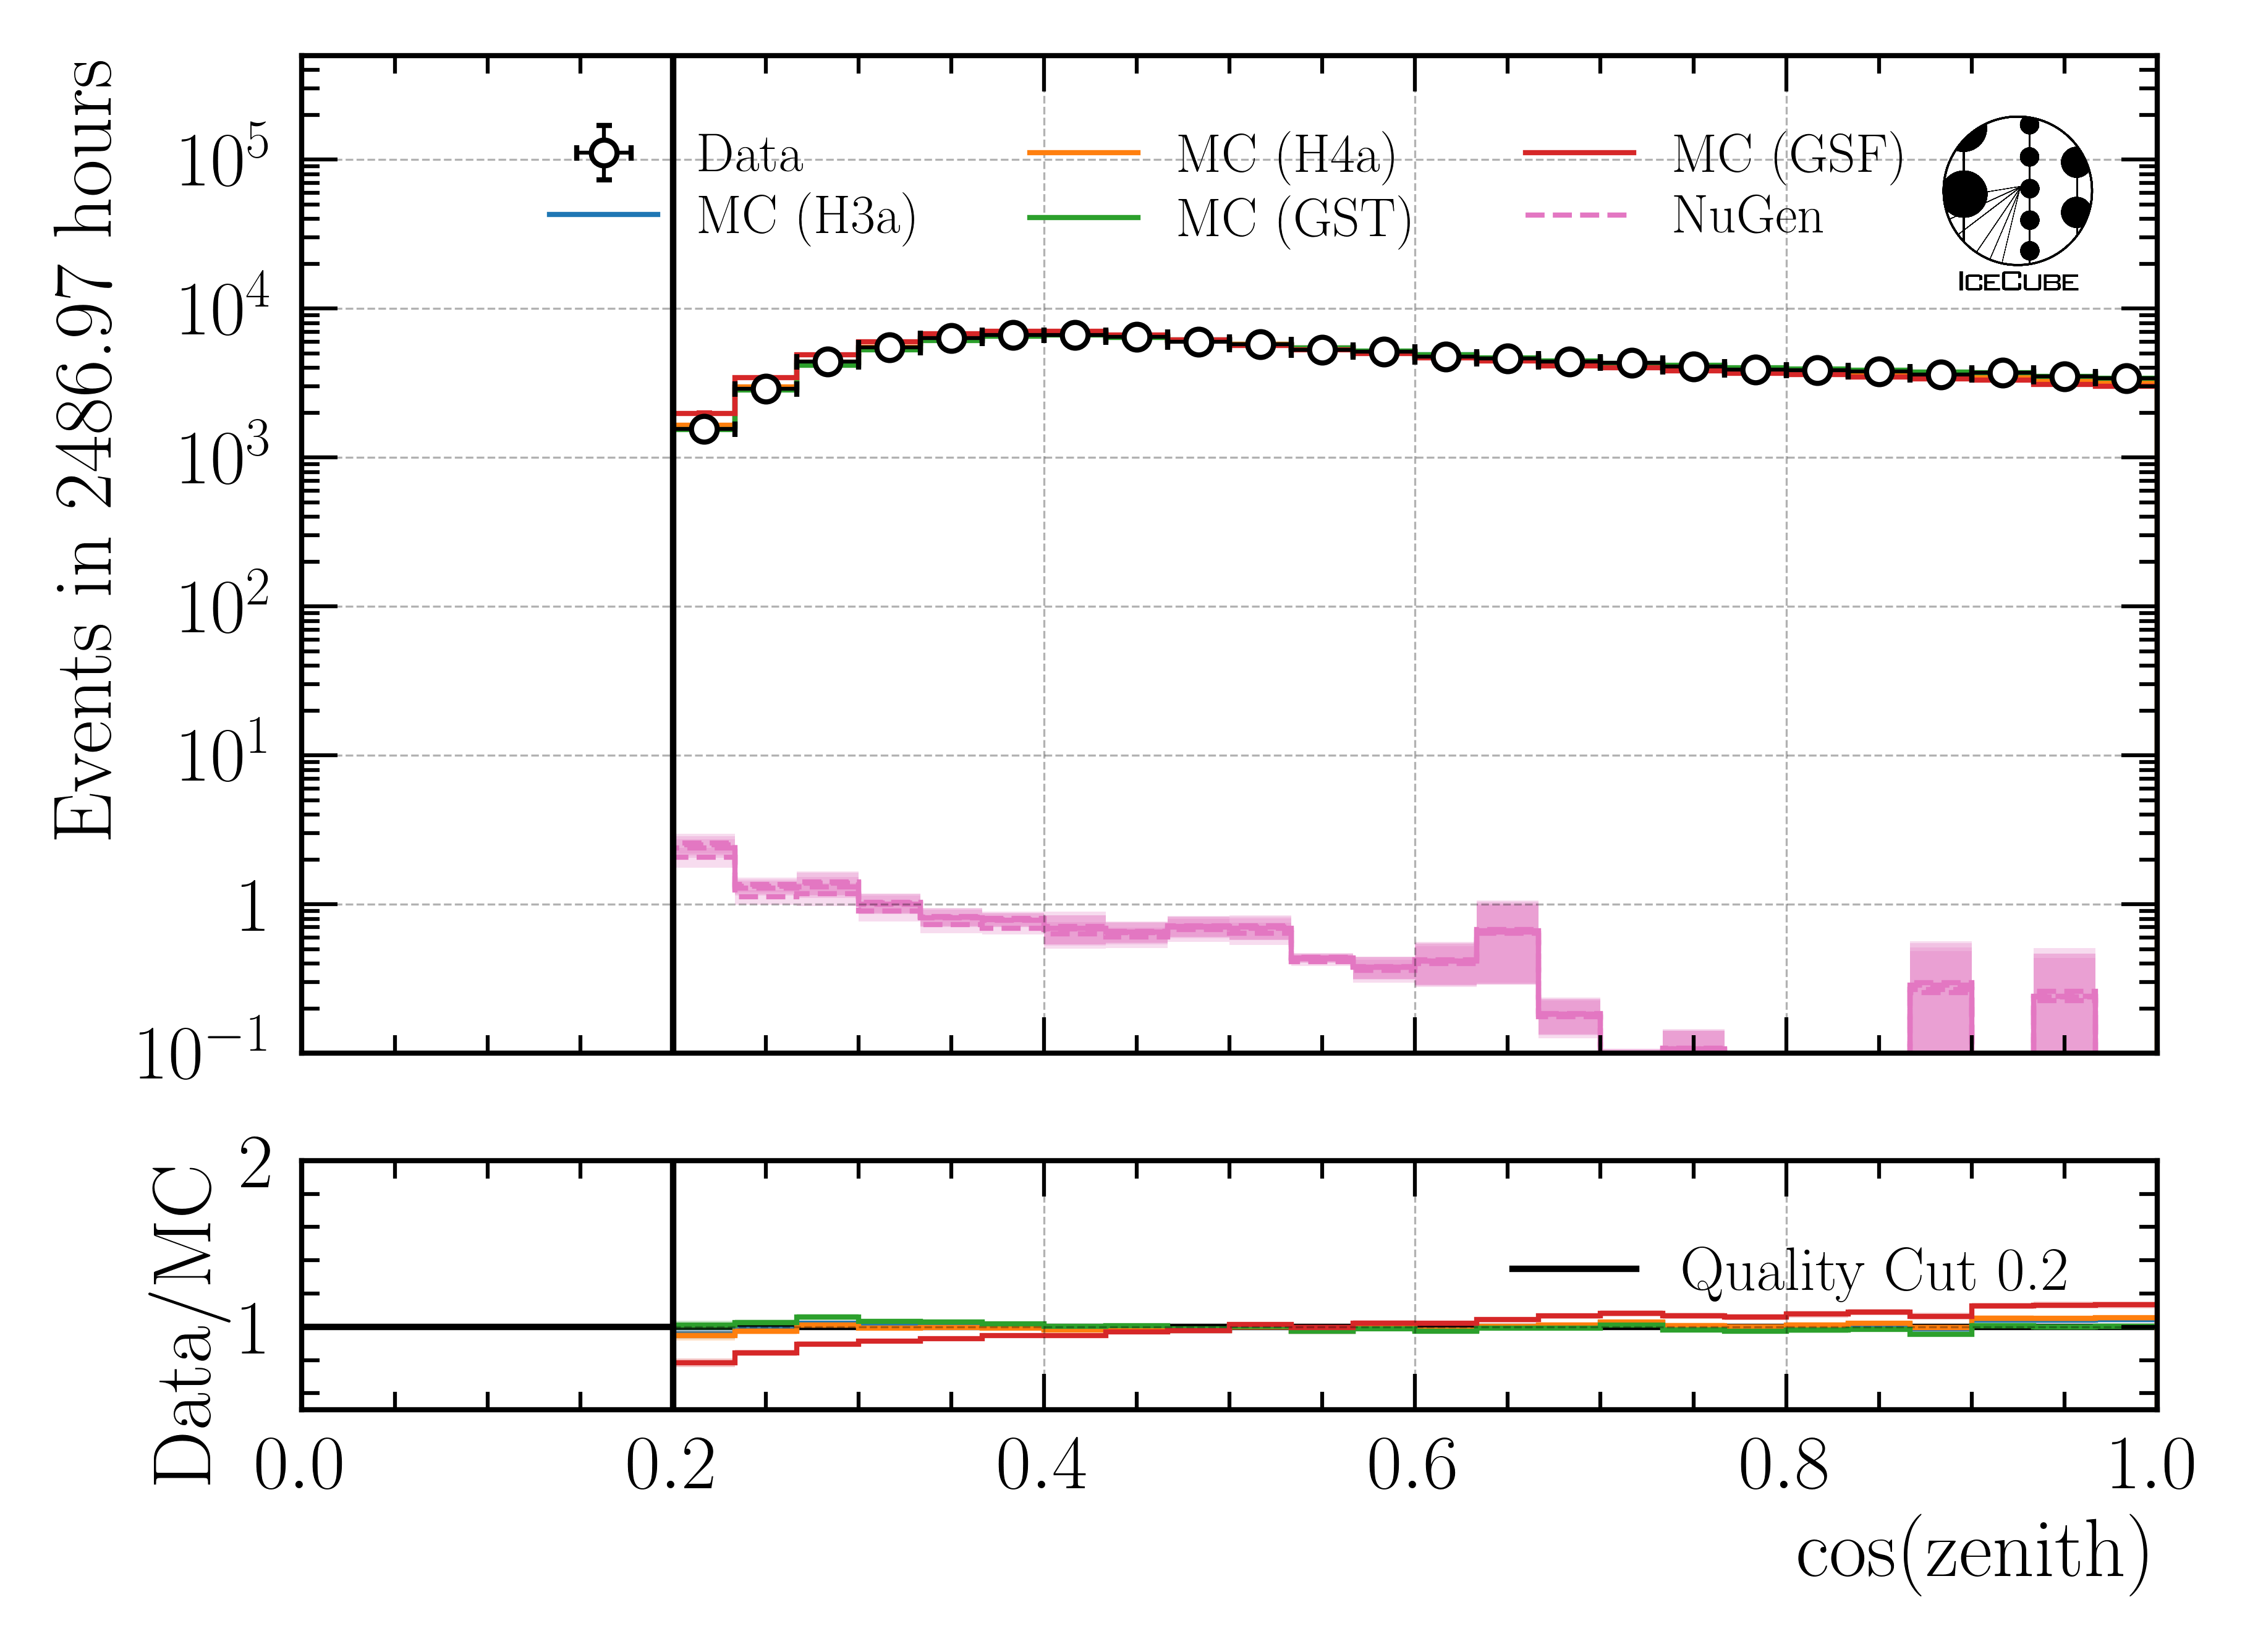
Fig. 107 : Cosine zenith reconstructed by DeepLearningReco_direction_9inputs_6ms_medium_02_03.
Zenith - uncertainty
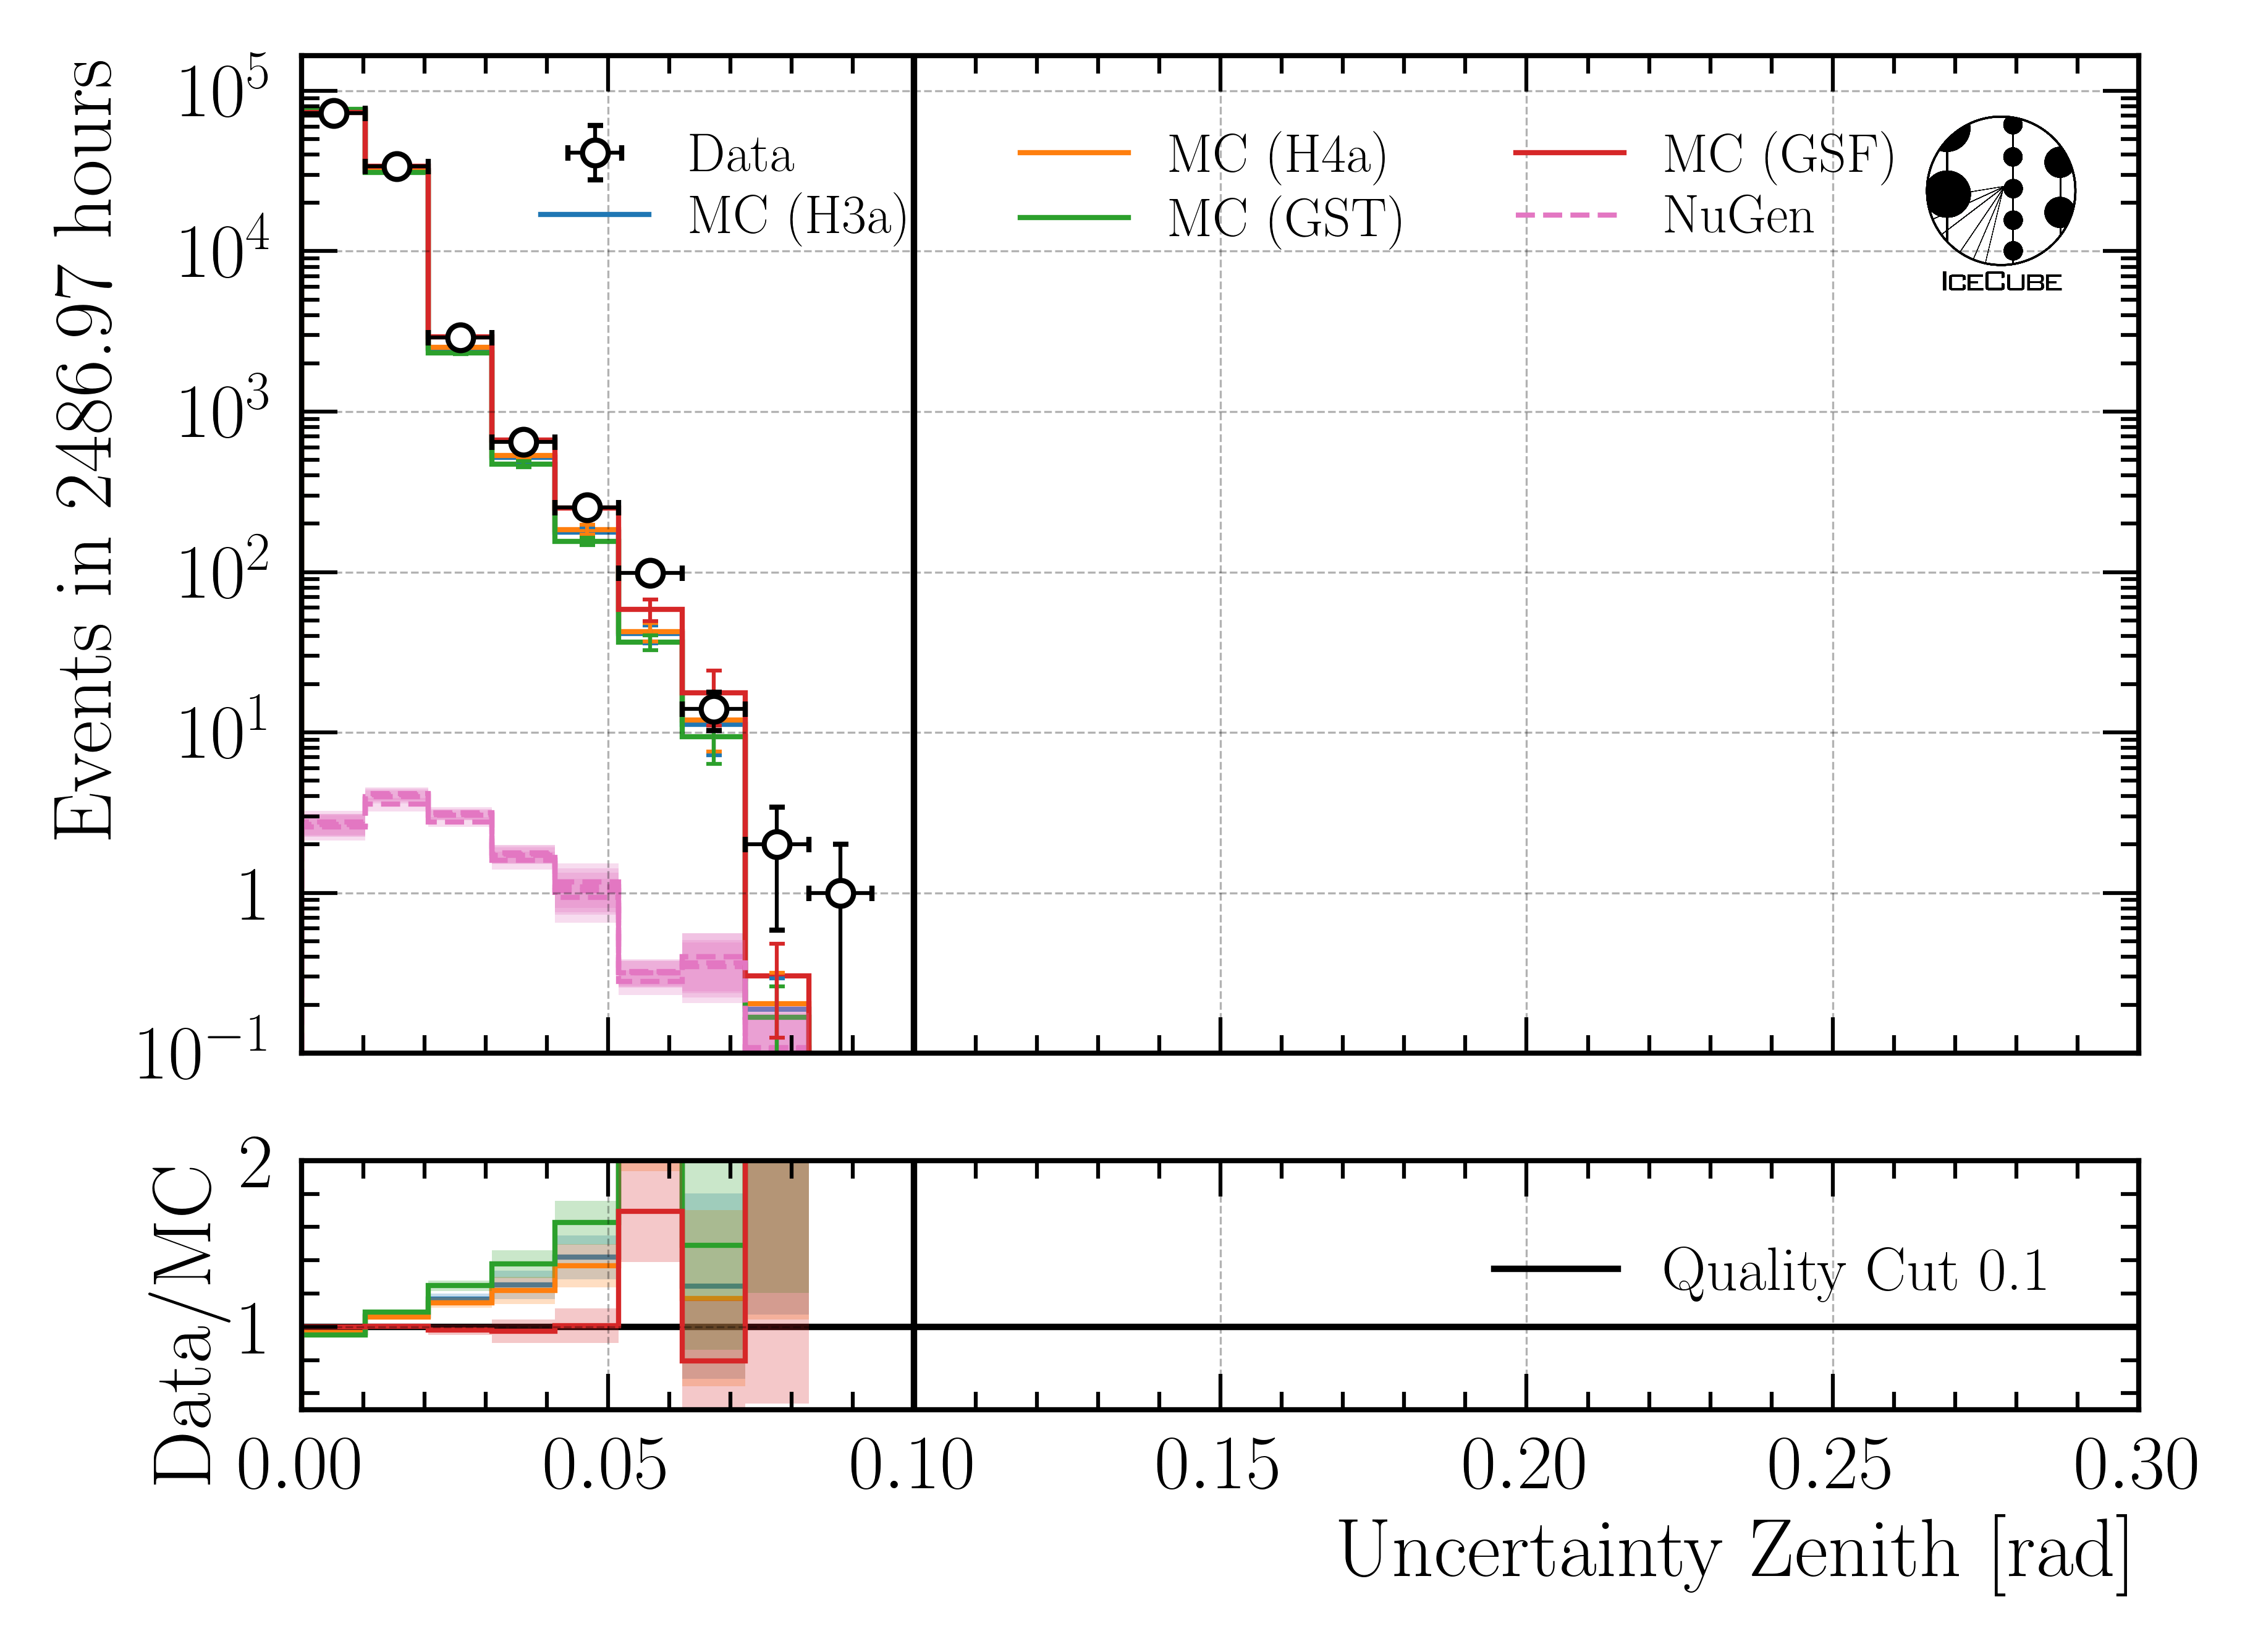
Fig. 108 : Uncertainty of zenith reconstructed by DeepLearningReco_direction_9inputs_6ms_medium_02_03.
Azimuth
Azimuth
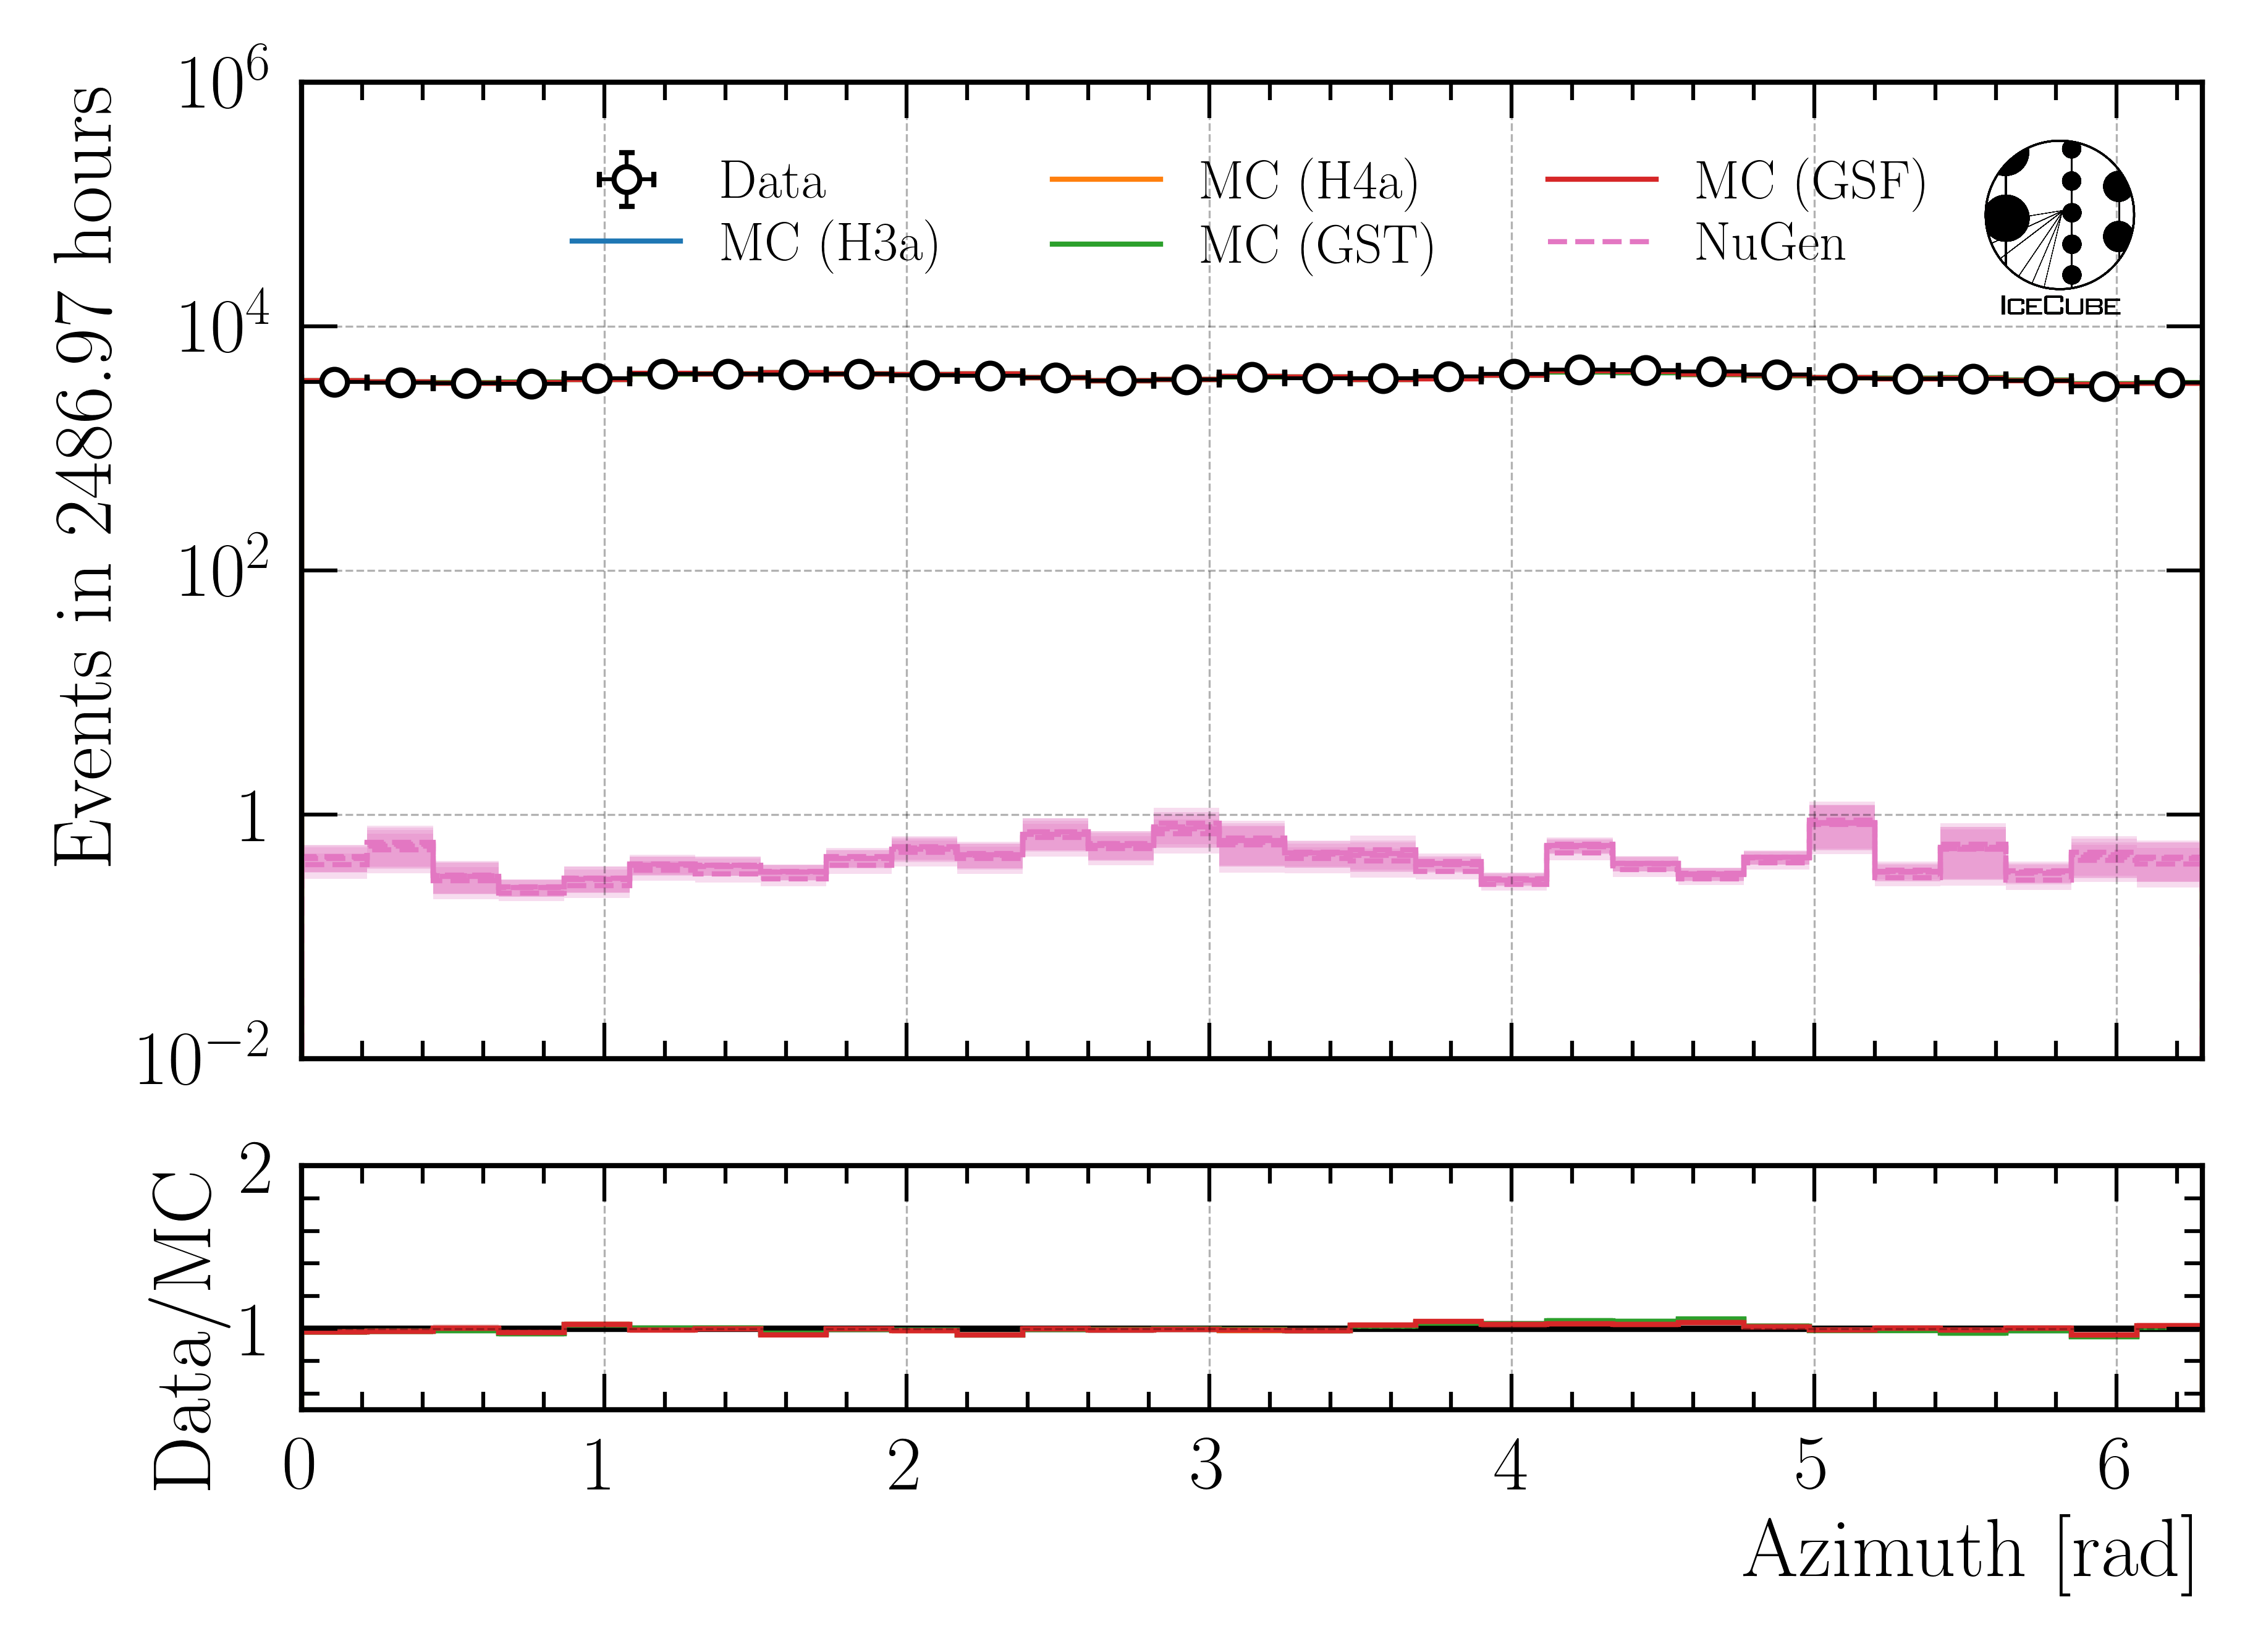
Fig. 109 : Azimuth reconstructed by DeepLearningReco_direction_9inputs_6ms_medium_02_03.
Azimuth - uncertainty
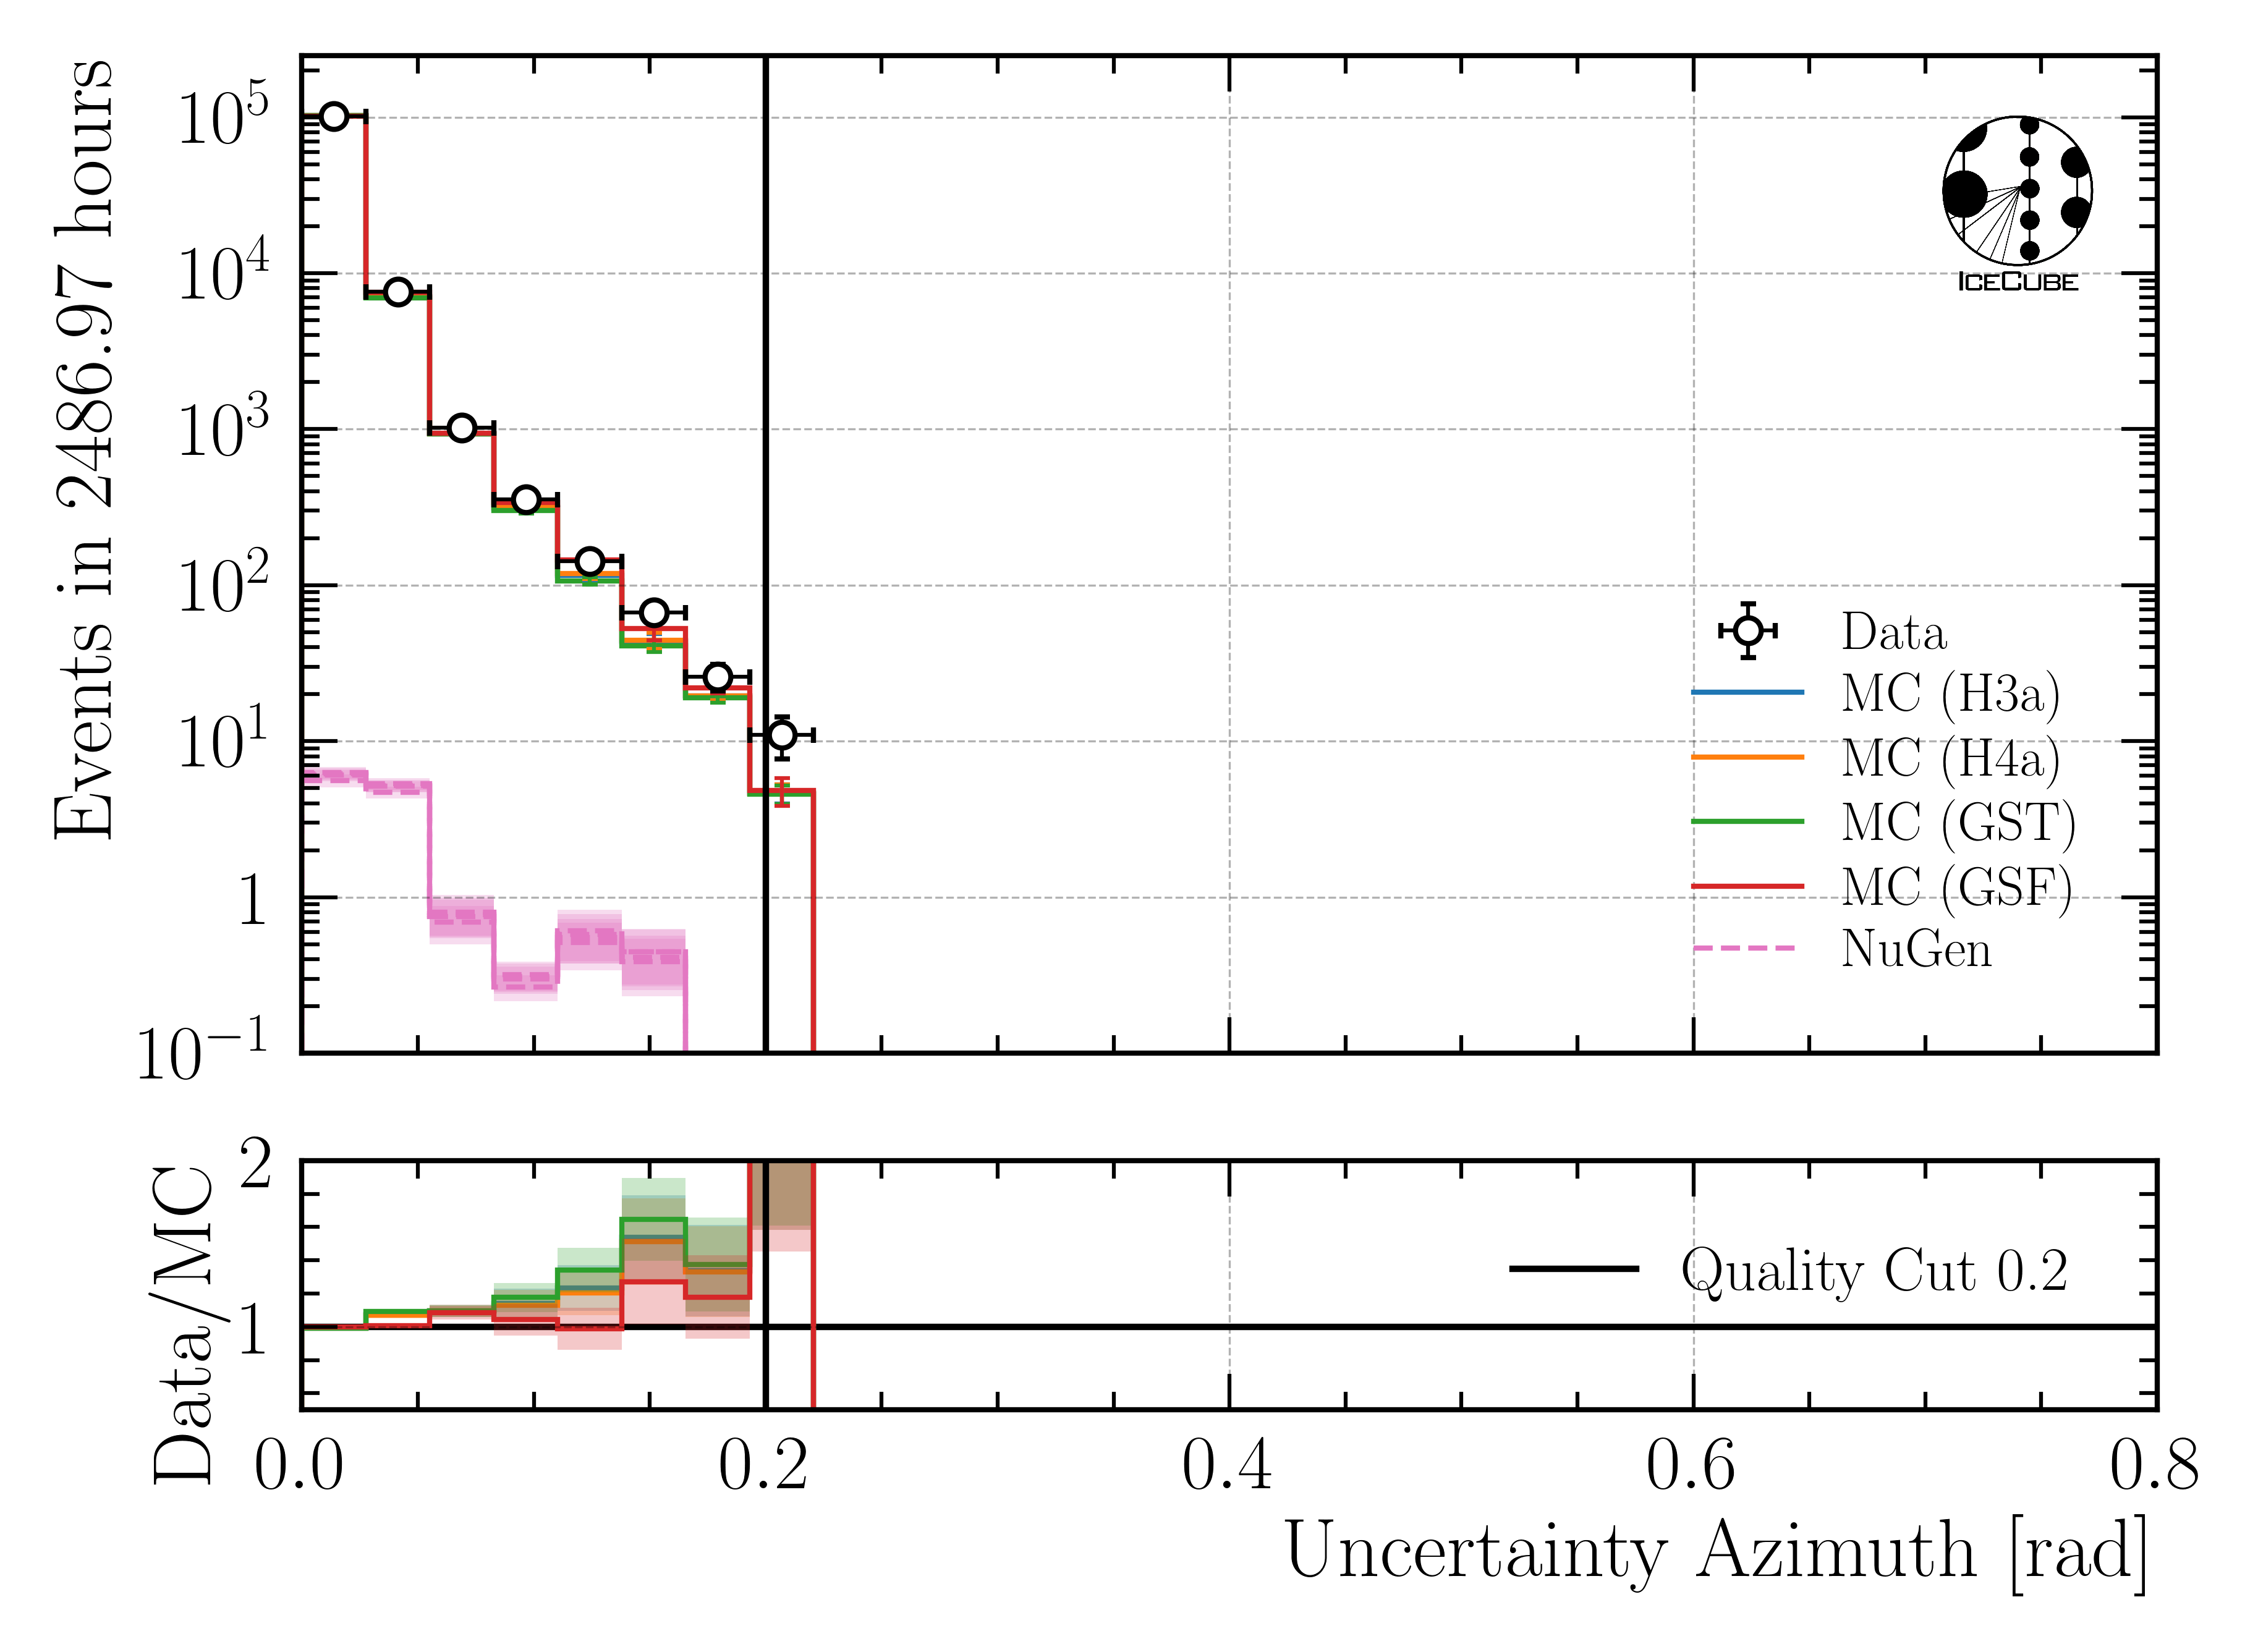
Fig. 110 : Uncertainty of azimuth reconstructed by DeepLearningReco_direction_9inputs_6ms_medium_02_03.
Center position
Time
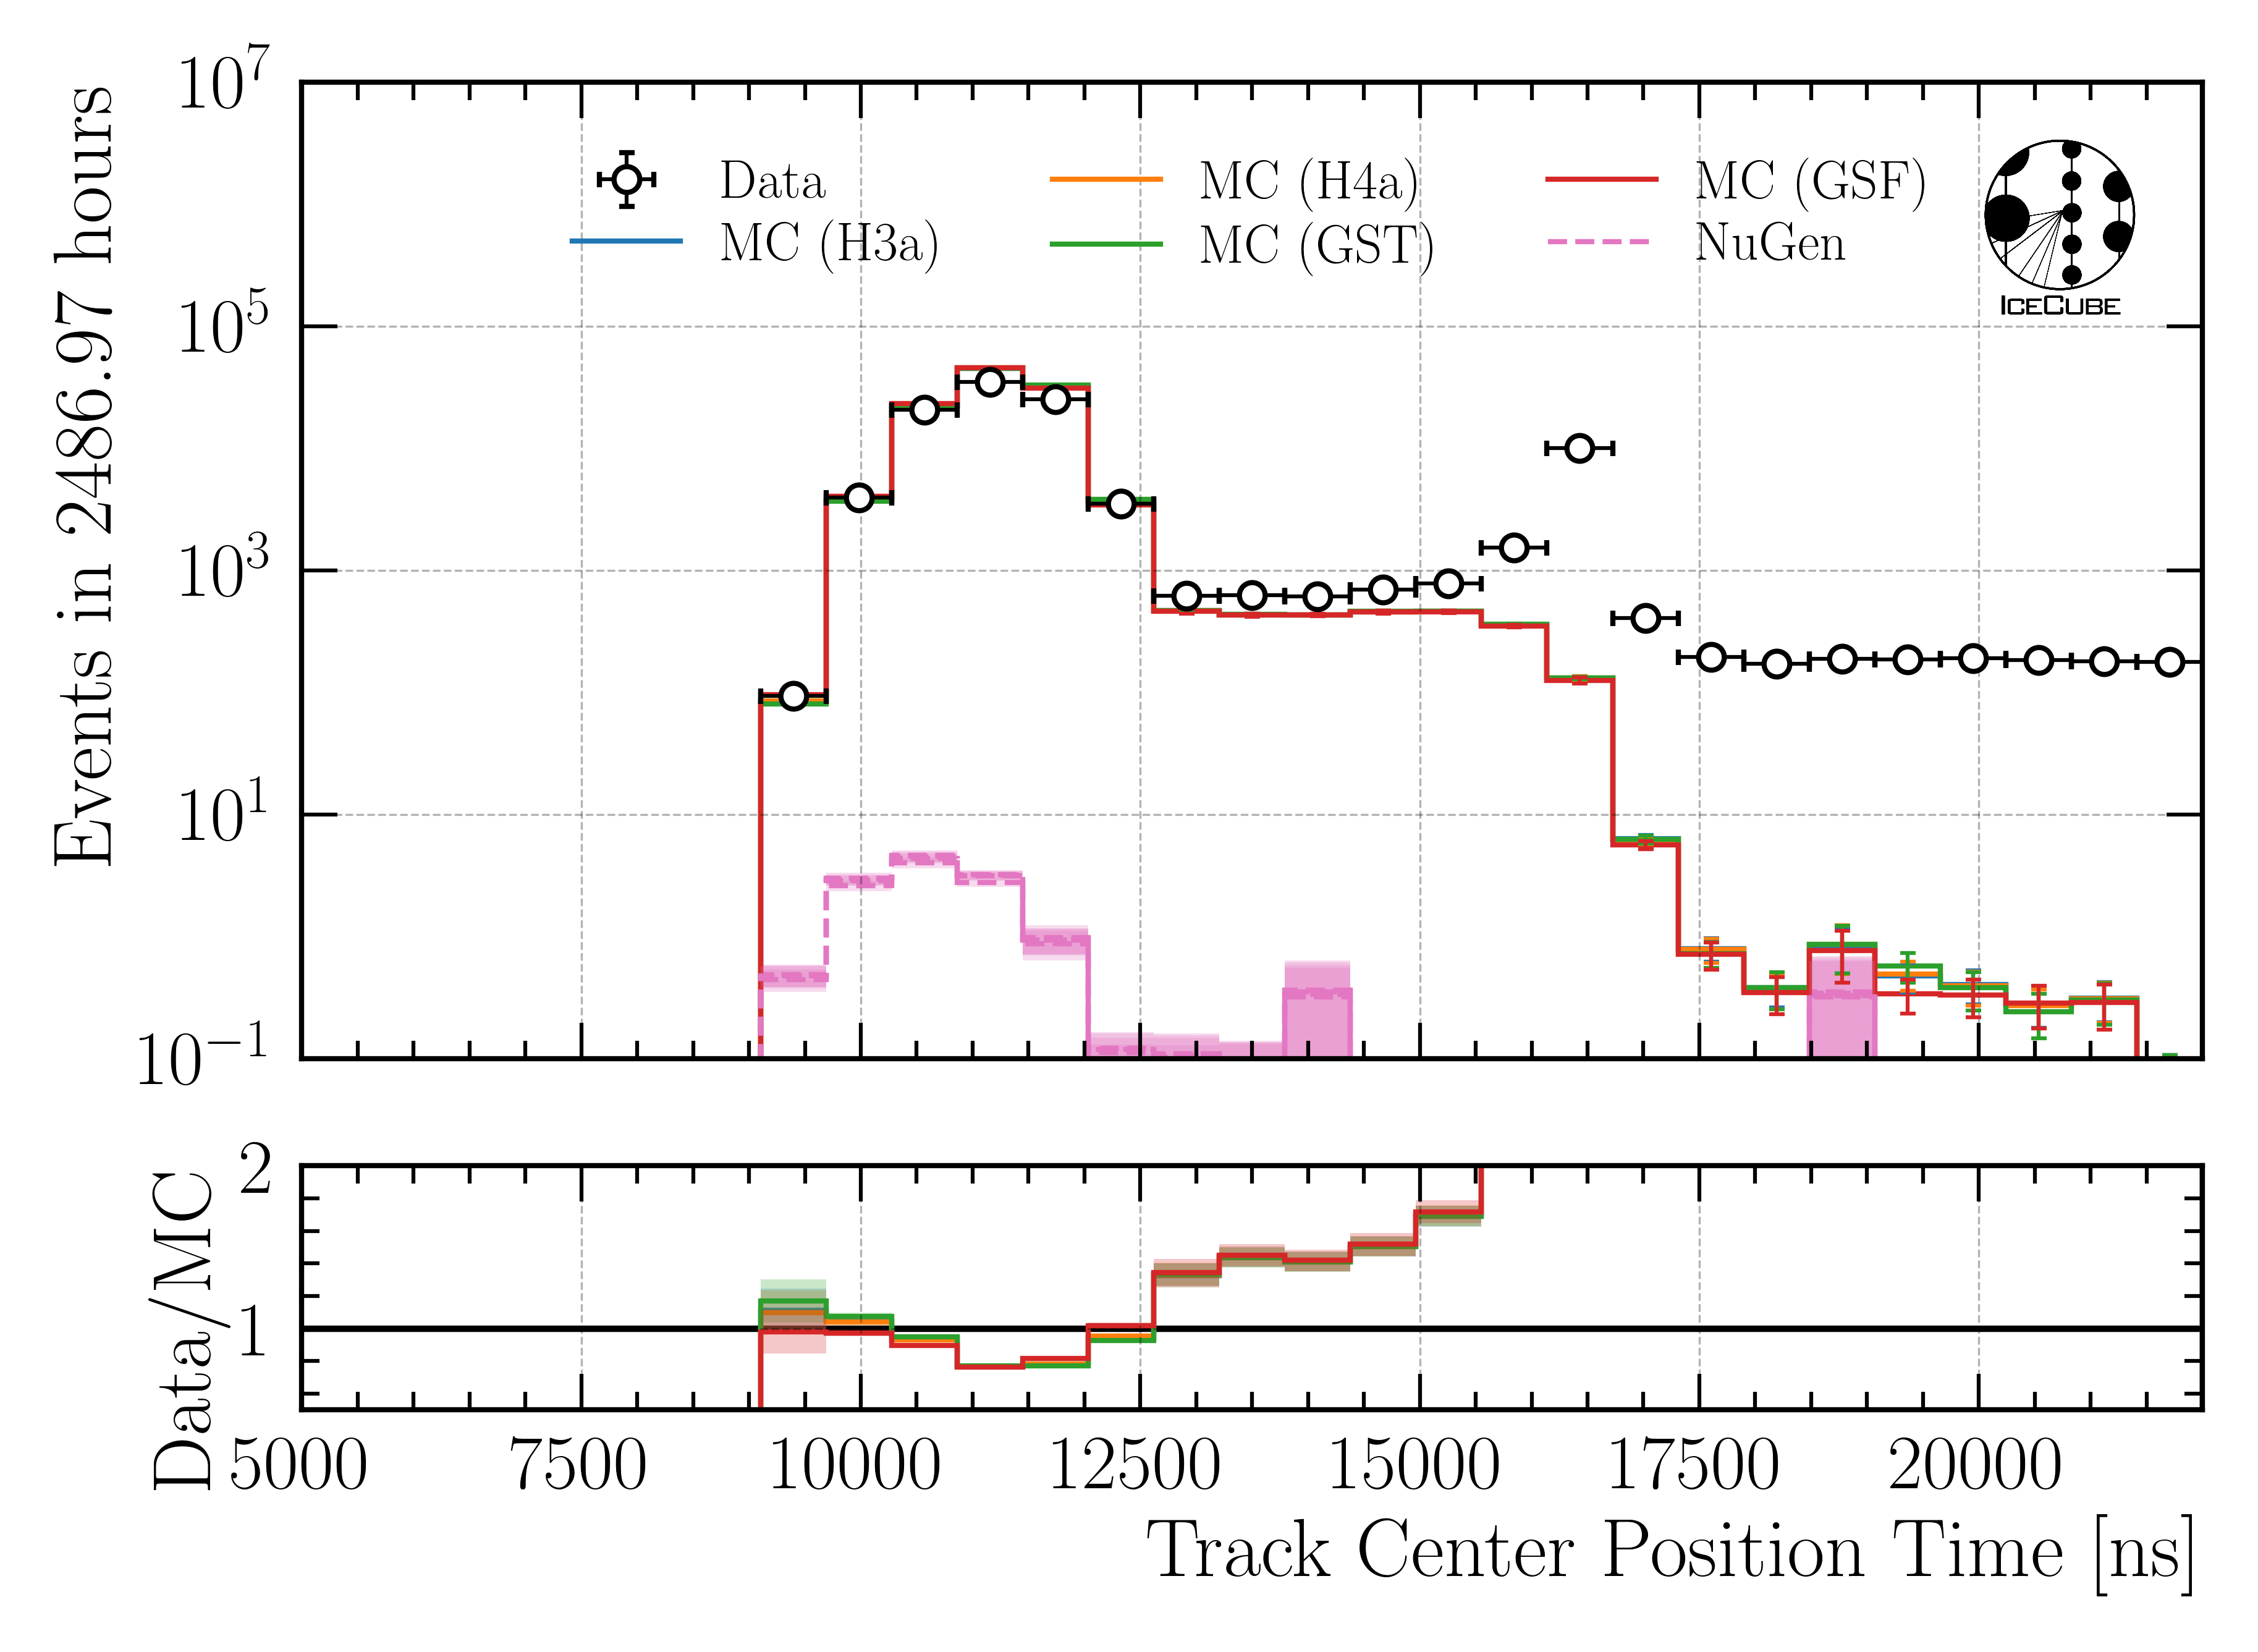
Fig. 111 : Center time reconstructed by DeepLearningReco_track_geometry_9inputs_6ms_medium_01.
Time - uncertainty
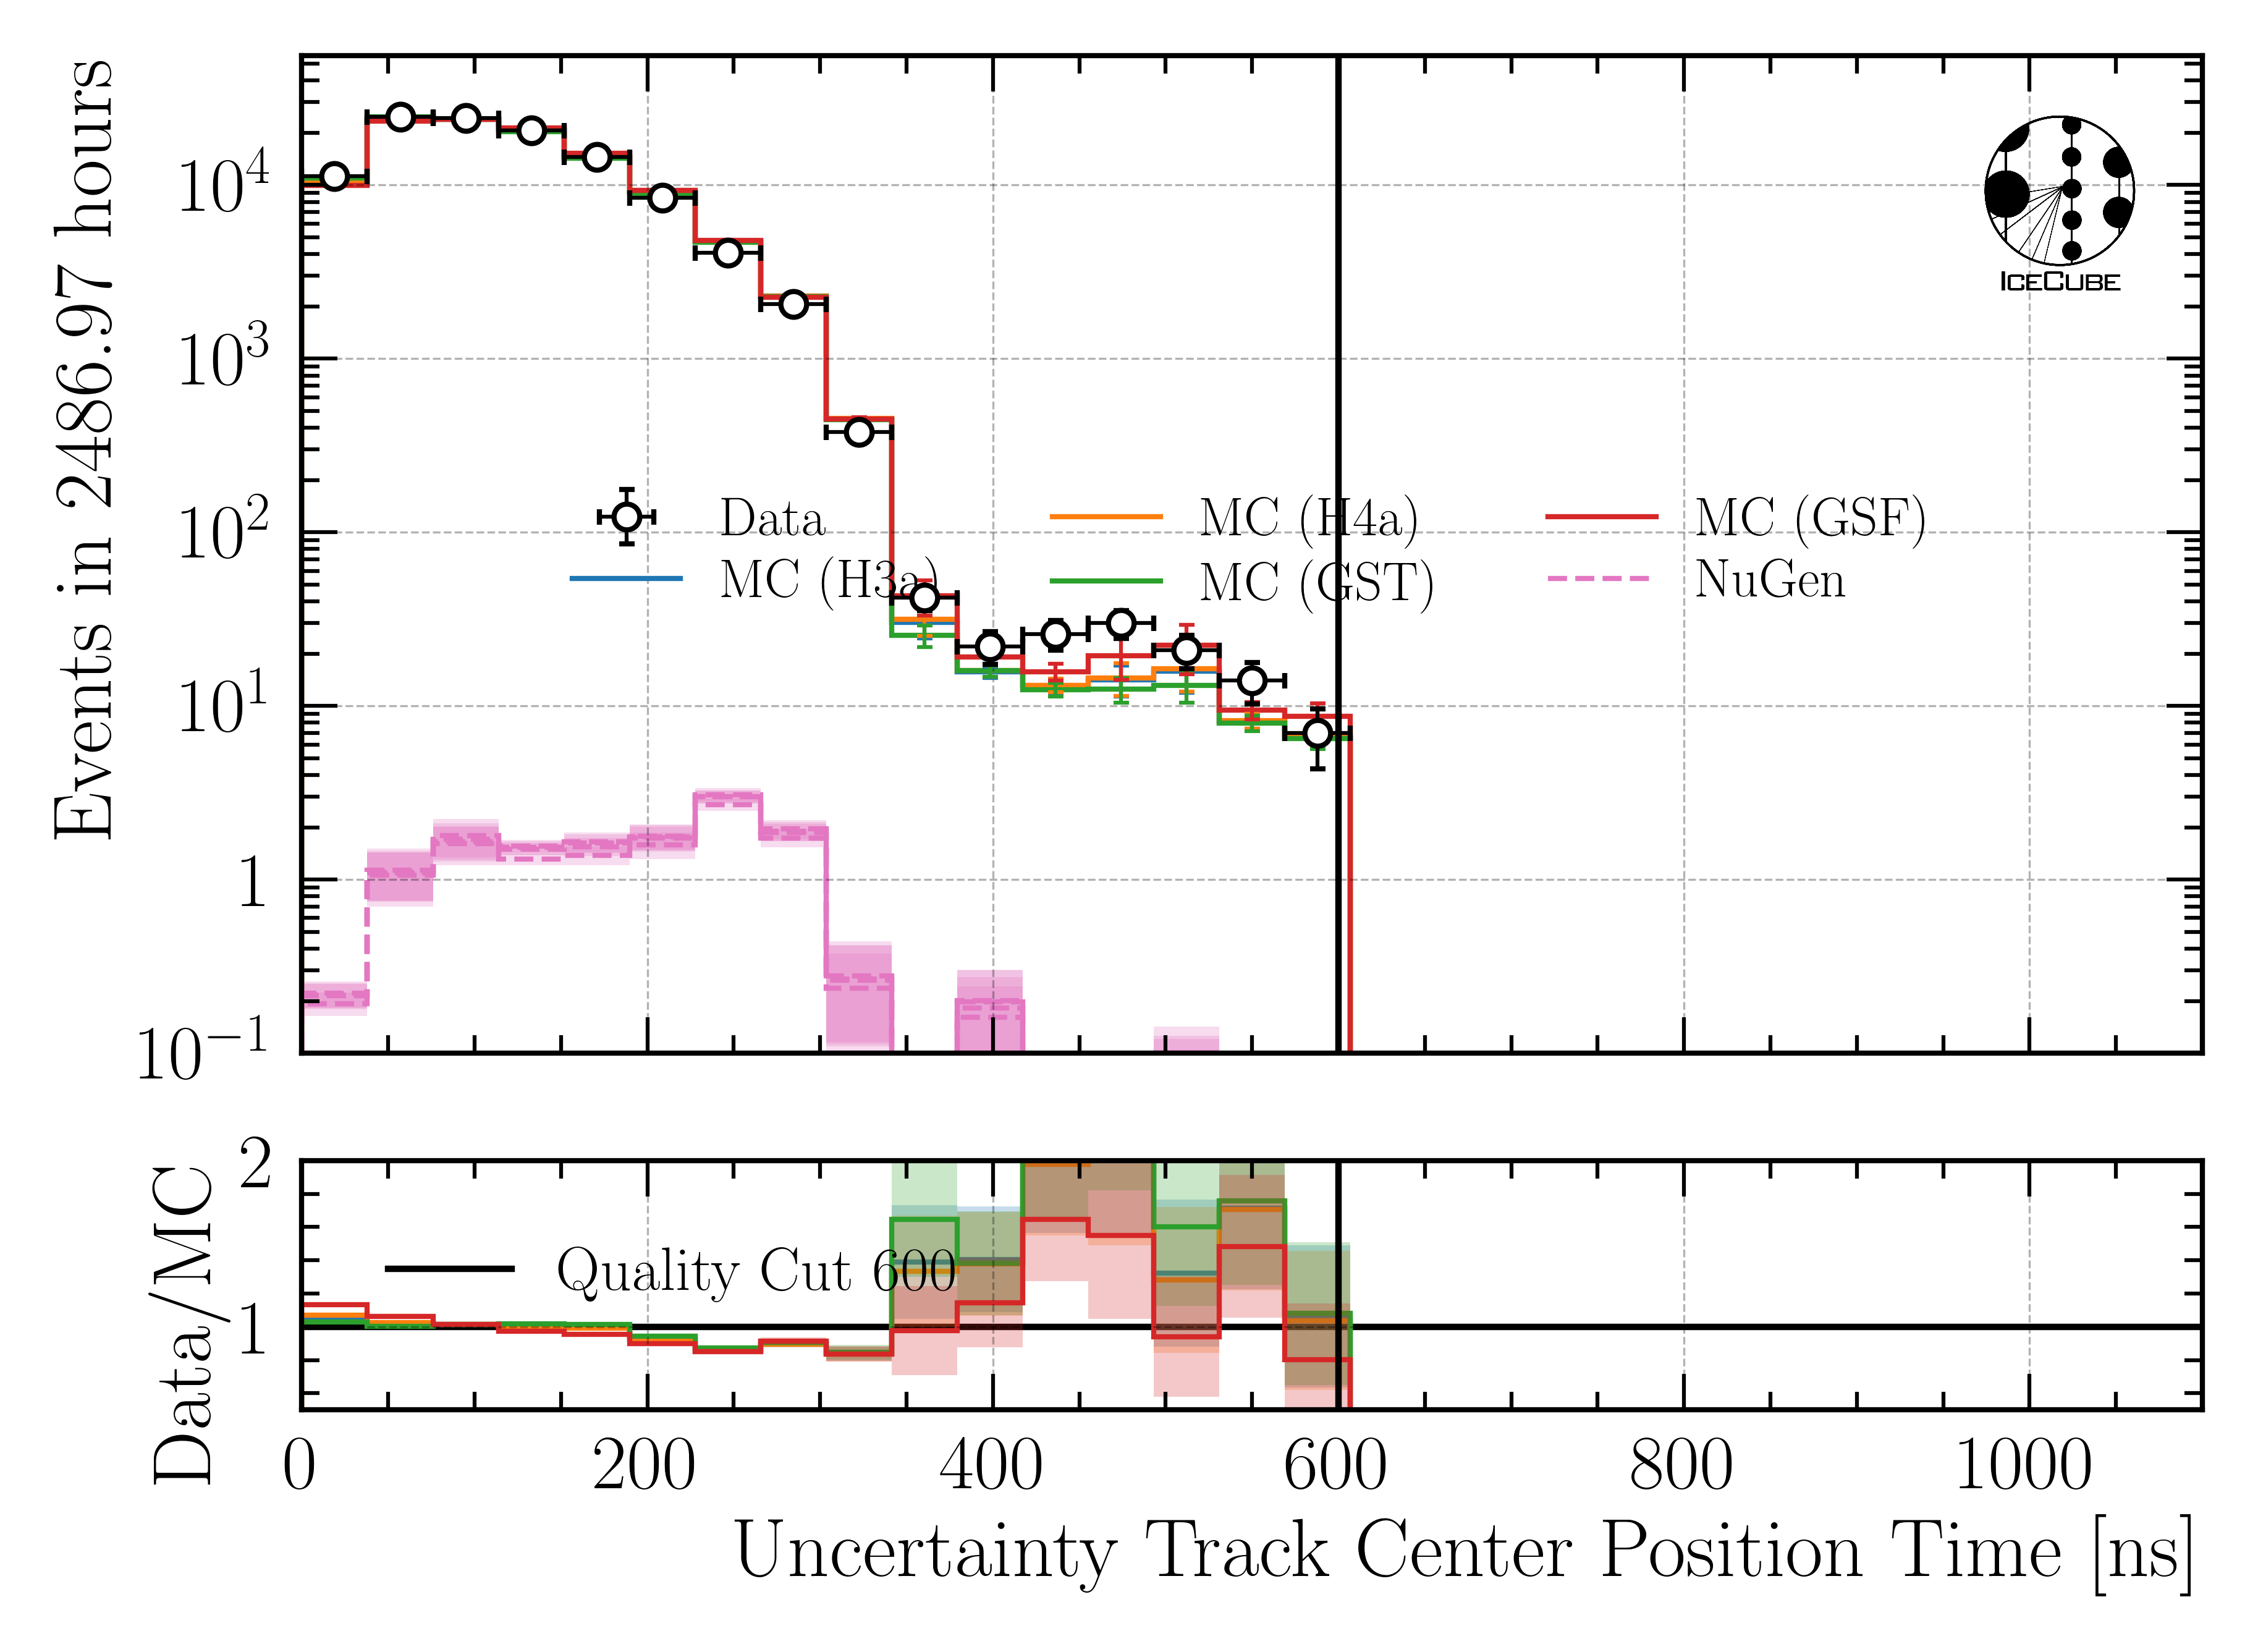
Fig. 112 : Uncertainty of center time reconstructed by DeepLearningReco_track_geometry_9inputs_6ms_medium_01.
Position x
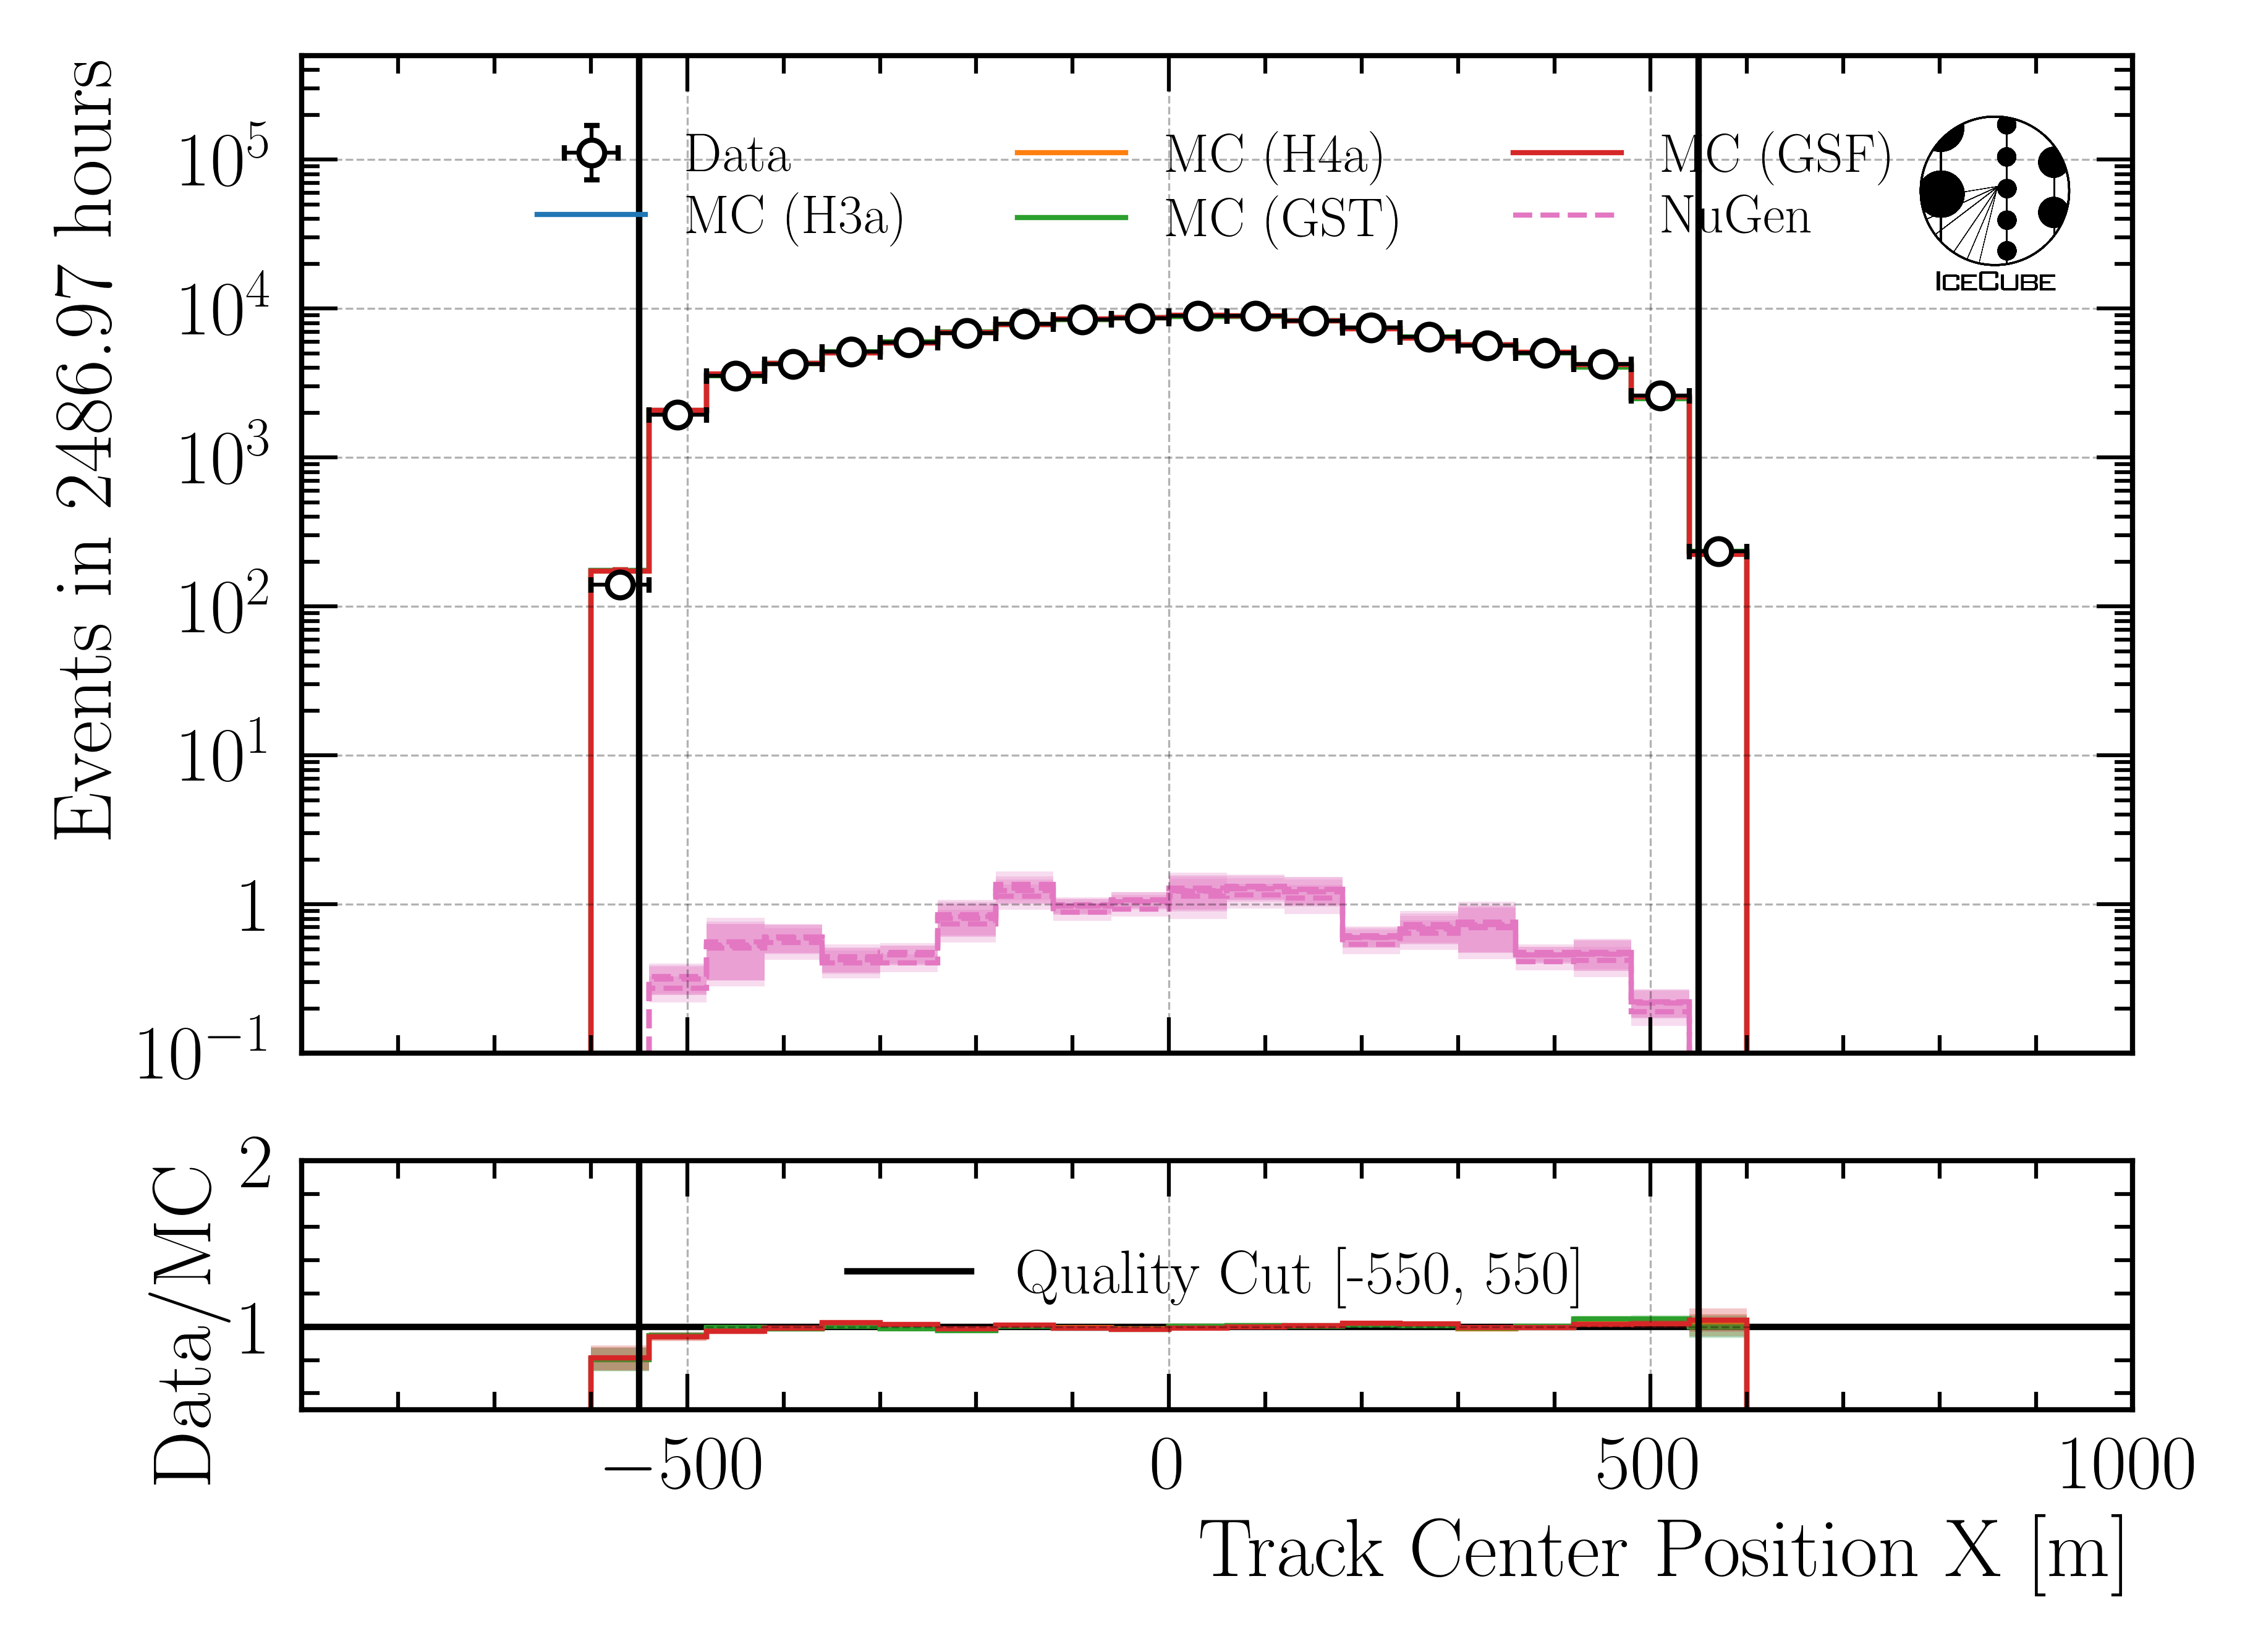
Fig. 113 : Center position x reconstructed by DeepLearningReco_track_geometry_9inputs_6ms_medium_01.
Position x - uncertainty
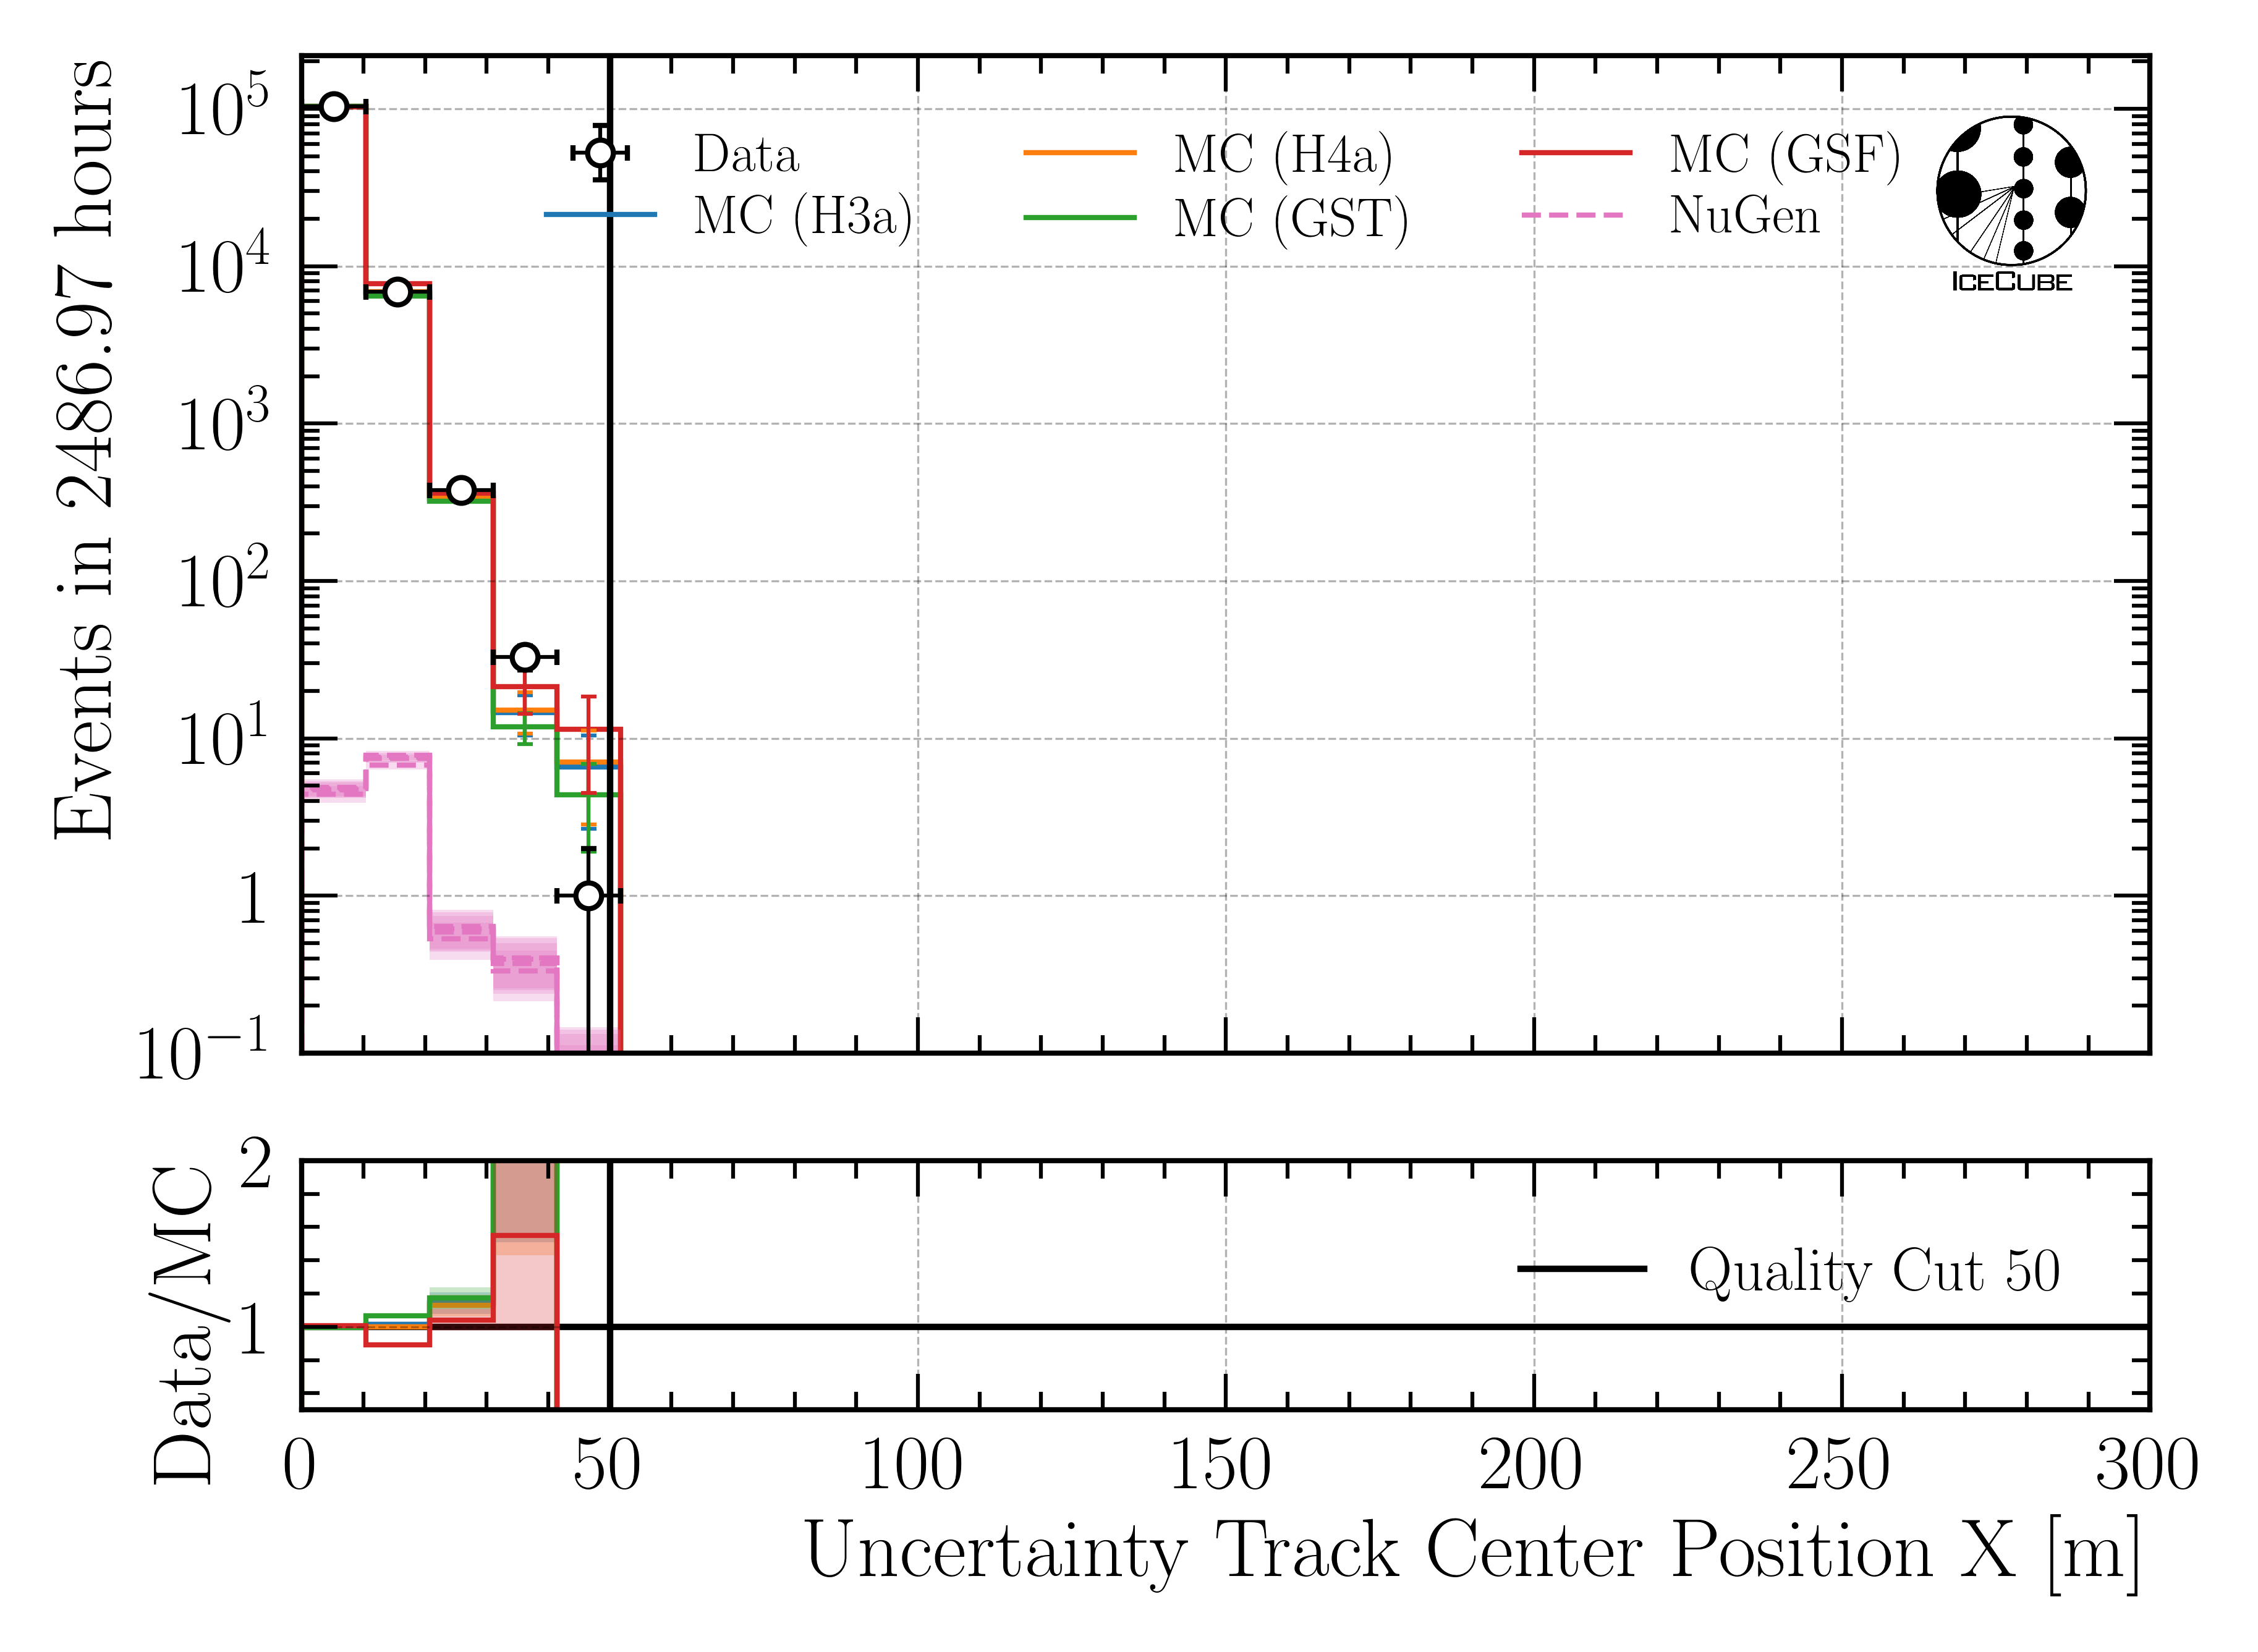
Fig. 114 : Uncertainty of center position x reconstructed by DeepLearningReco_track_geometry_9inputs_6ms_medium_01.
Position y
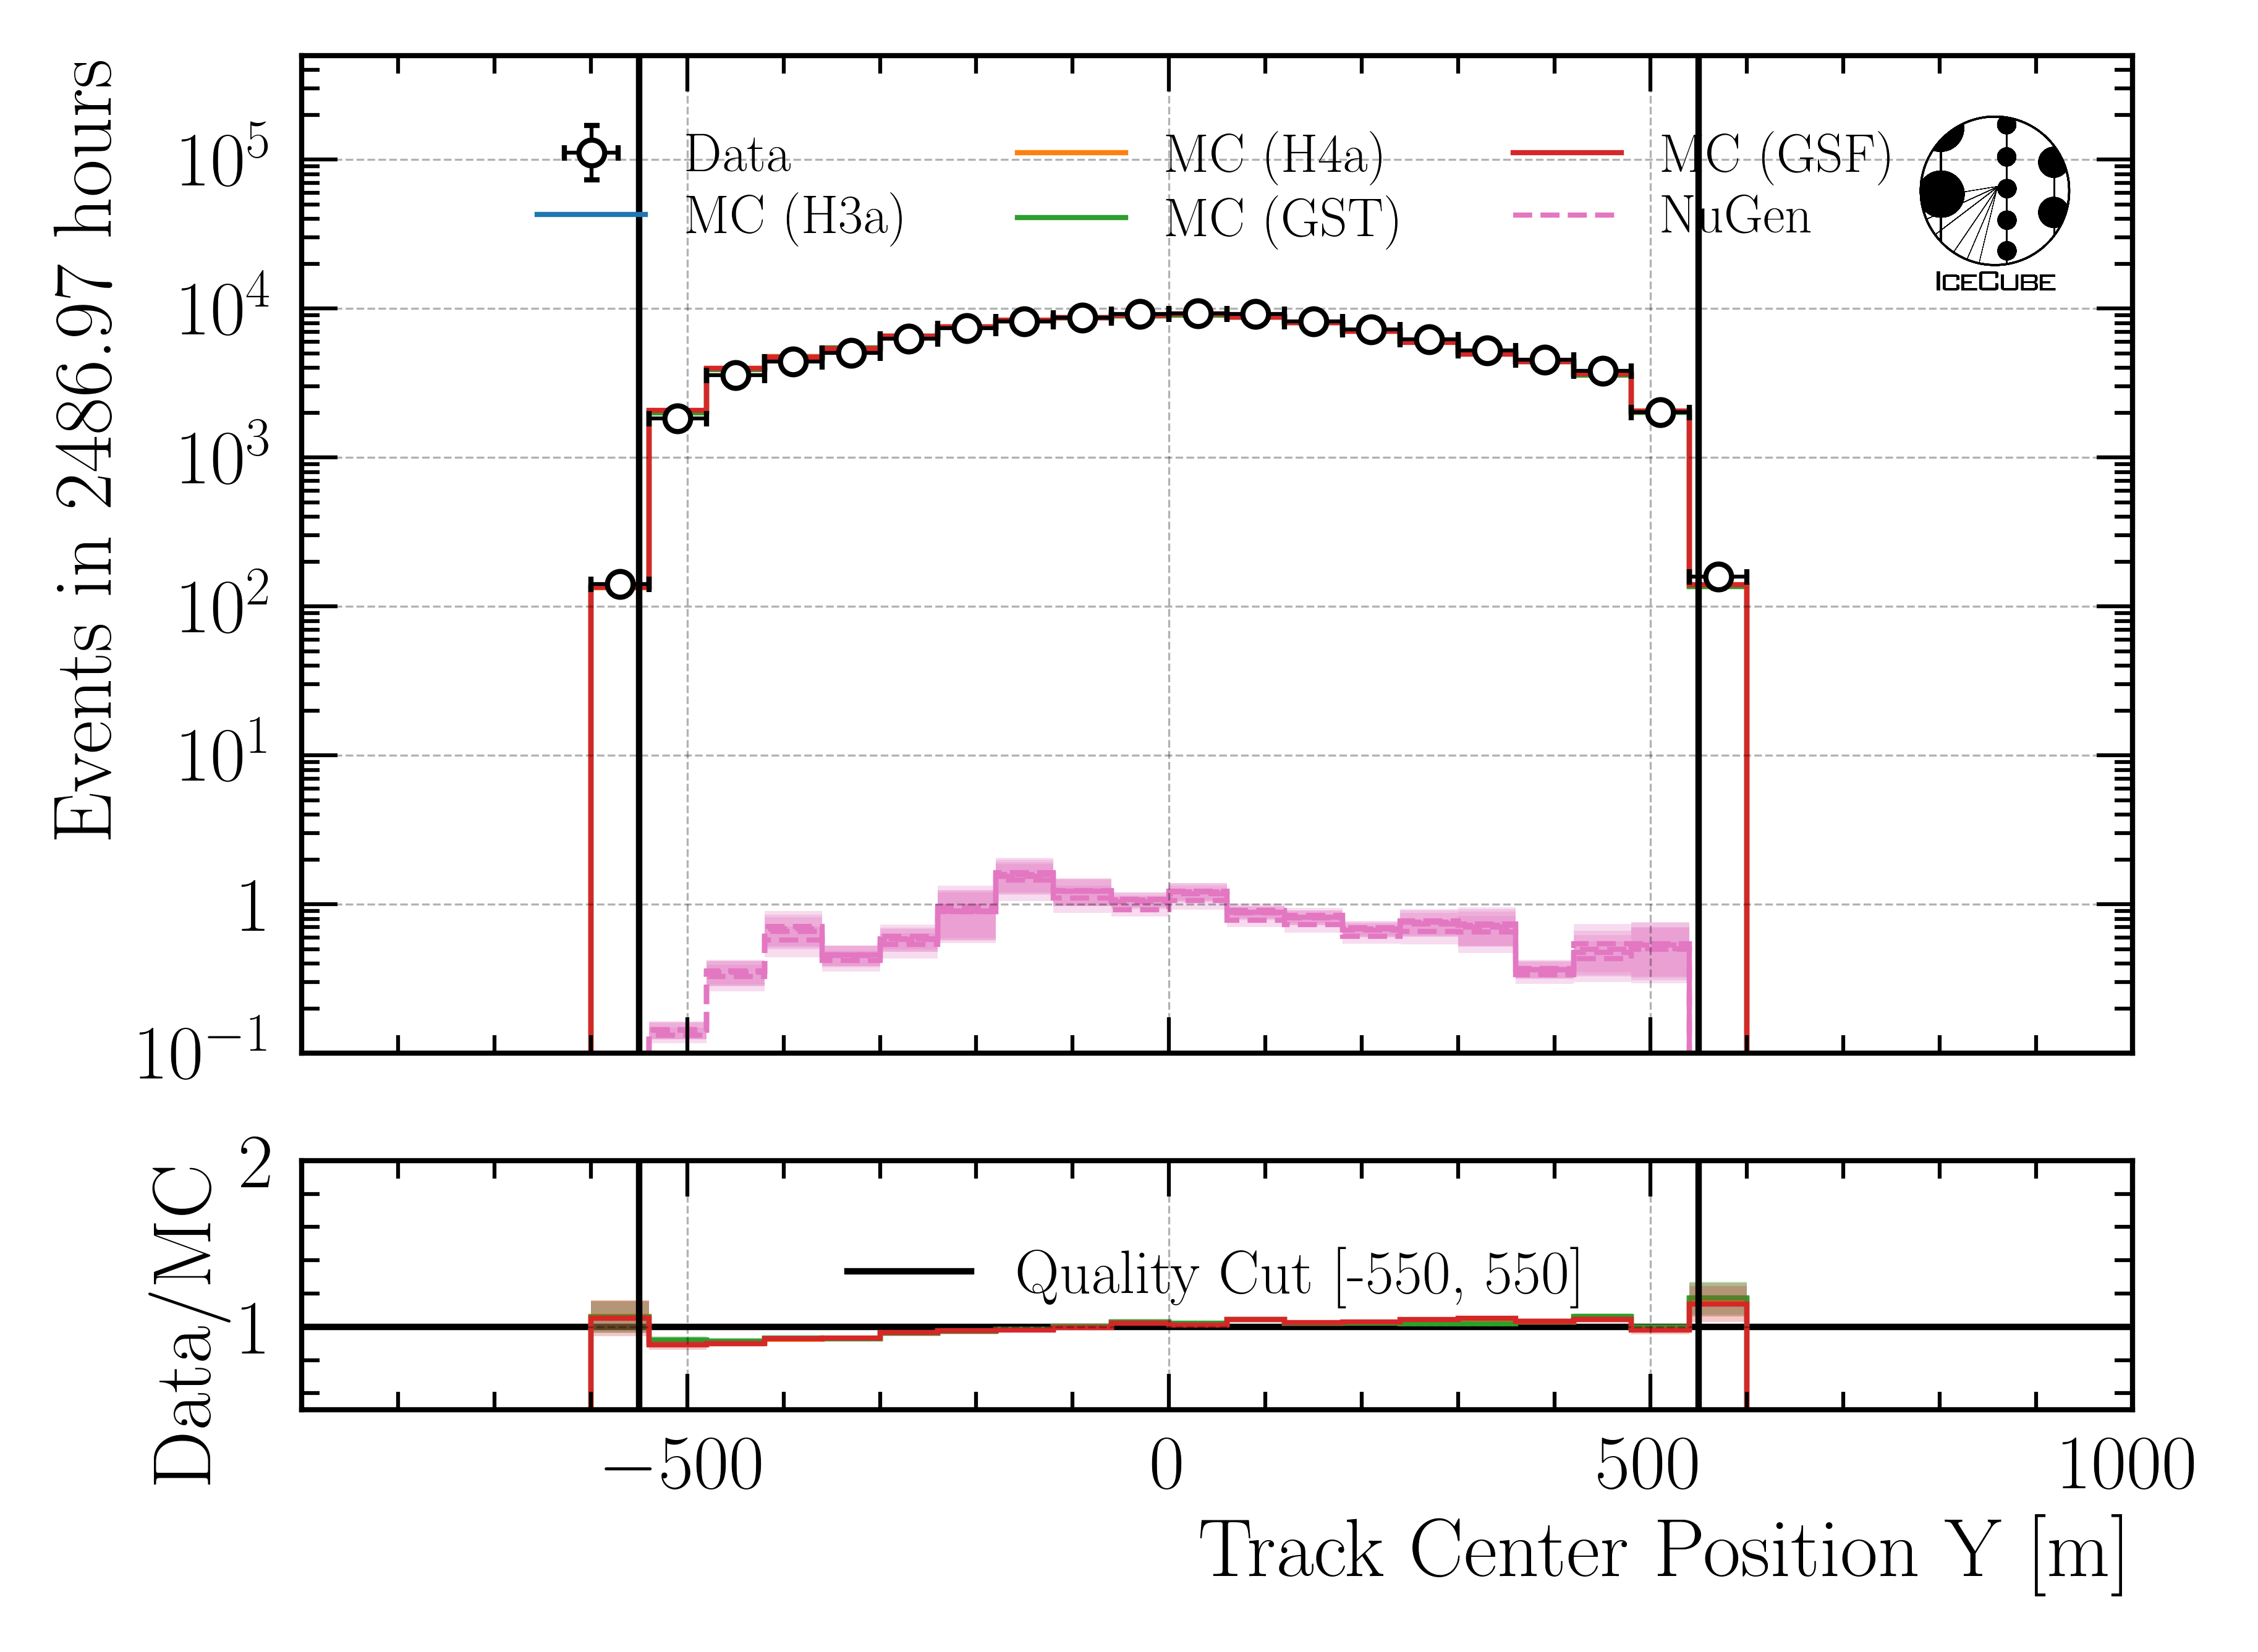
Fig. 115 : Center position y reconstructed by DeepLearningReco_track_geometry_9inputs_6ms_medium_01.
Position y - uncertainty
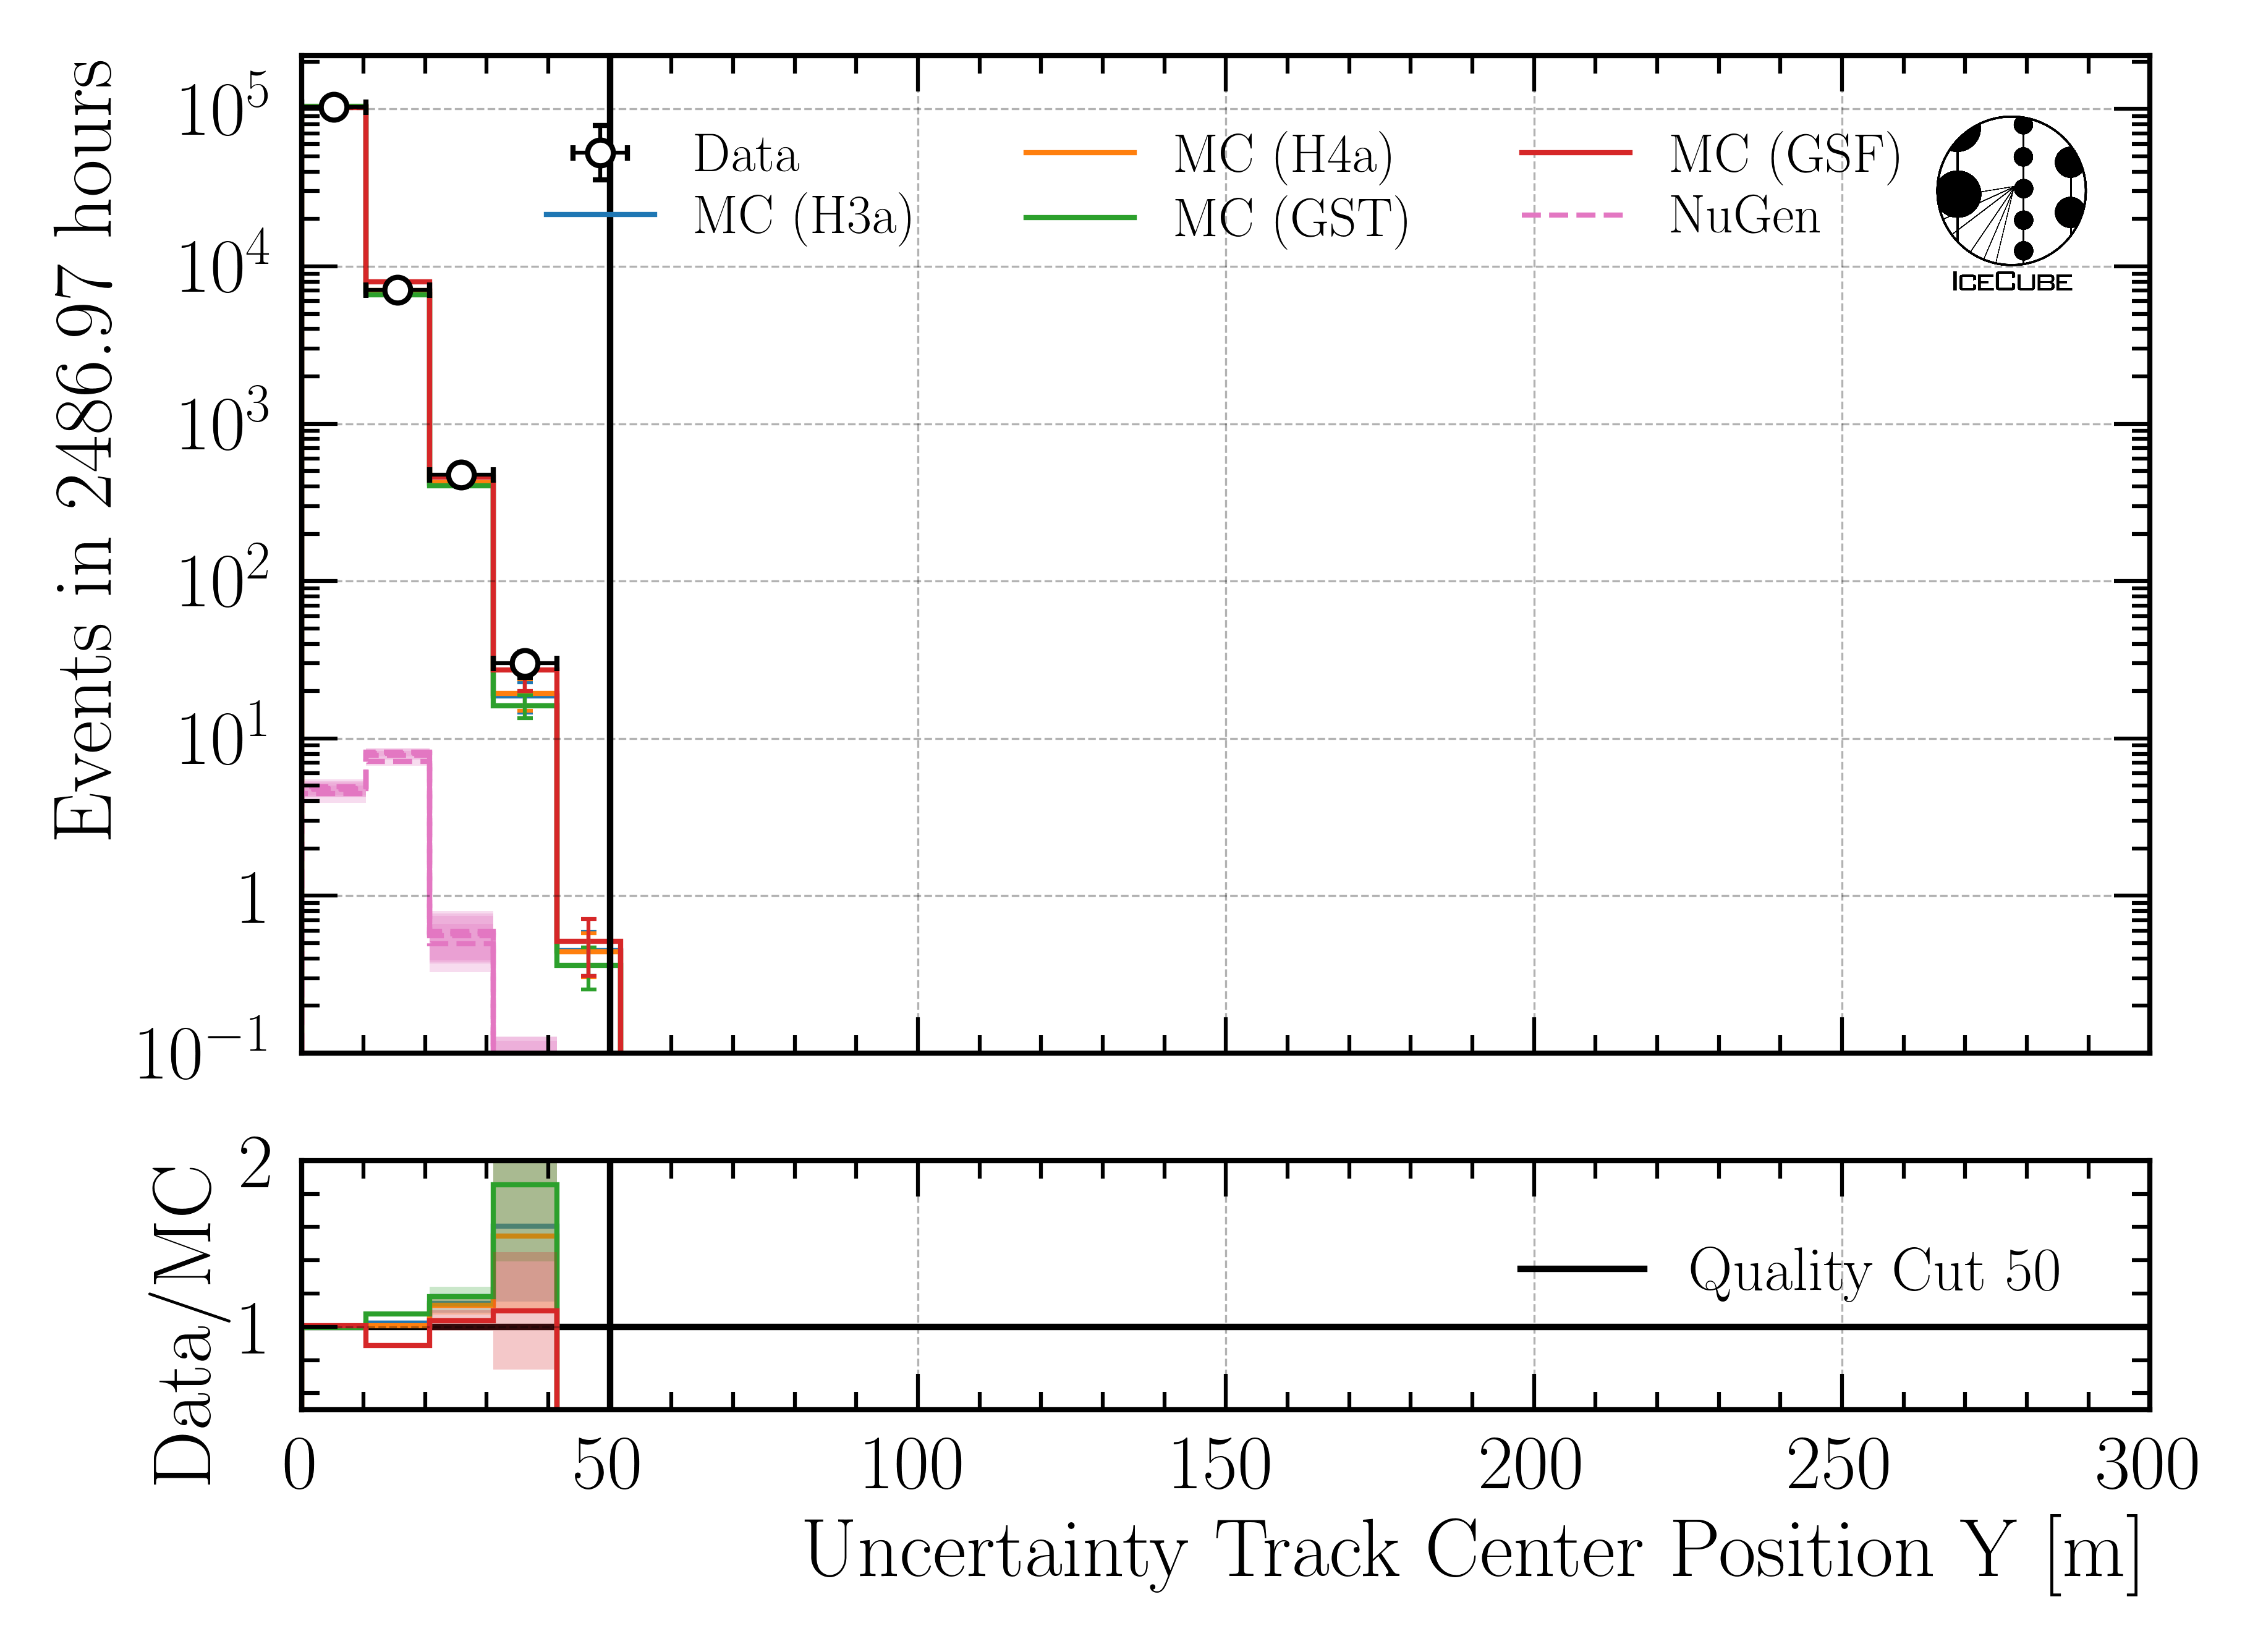
Fig. 116 : Uncertainty of center position y reconstructed by DeepLearningReco_track_geometry_9inputs_6ms_medium_01.
Position z
Further investigations of the z-vertex can be found in the Appendix/Z-vertex investigations (L5).
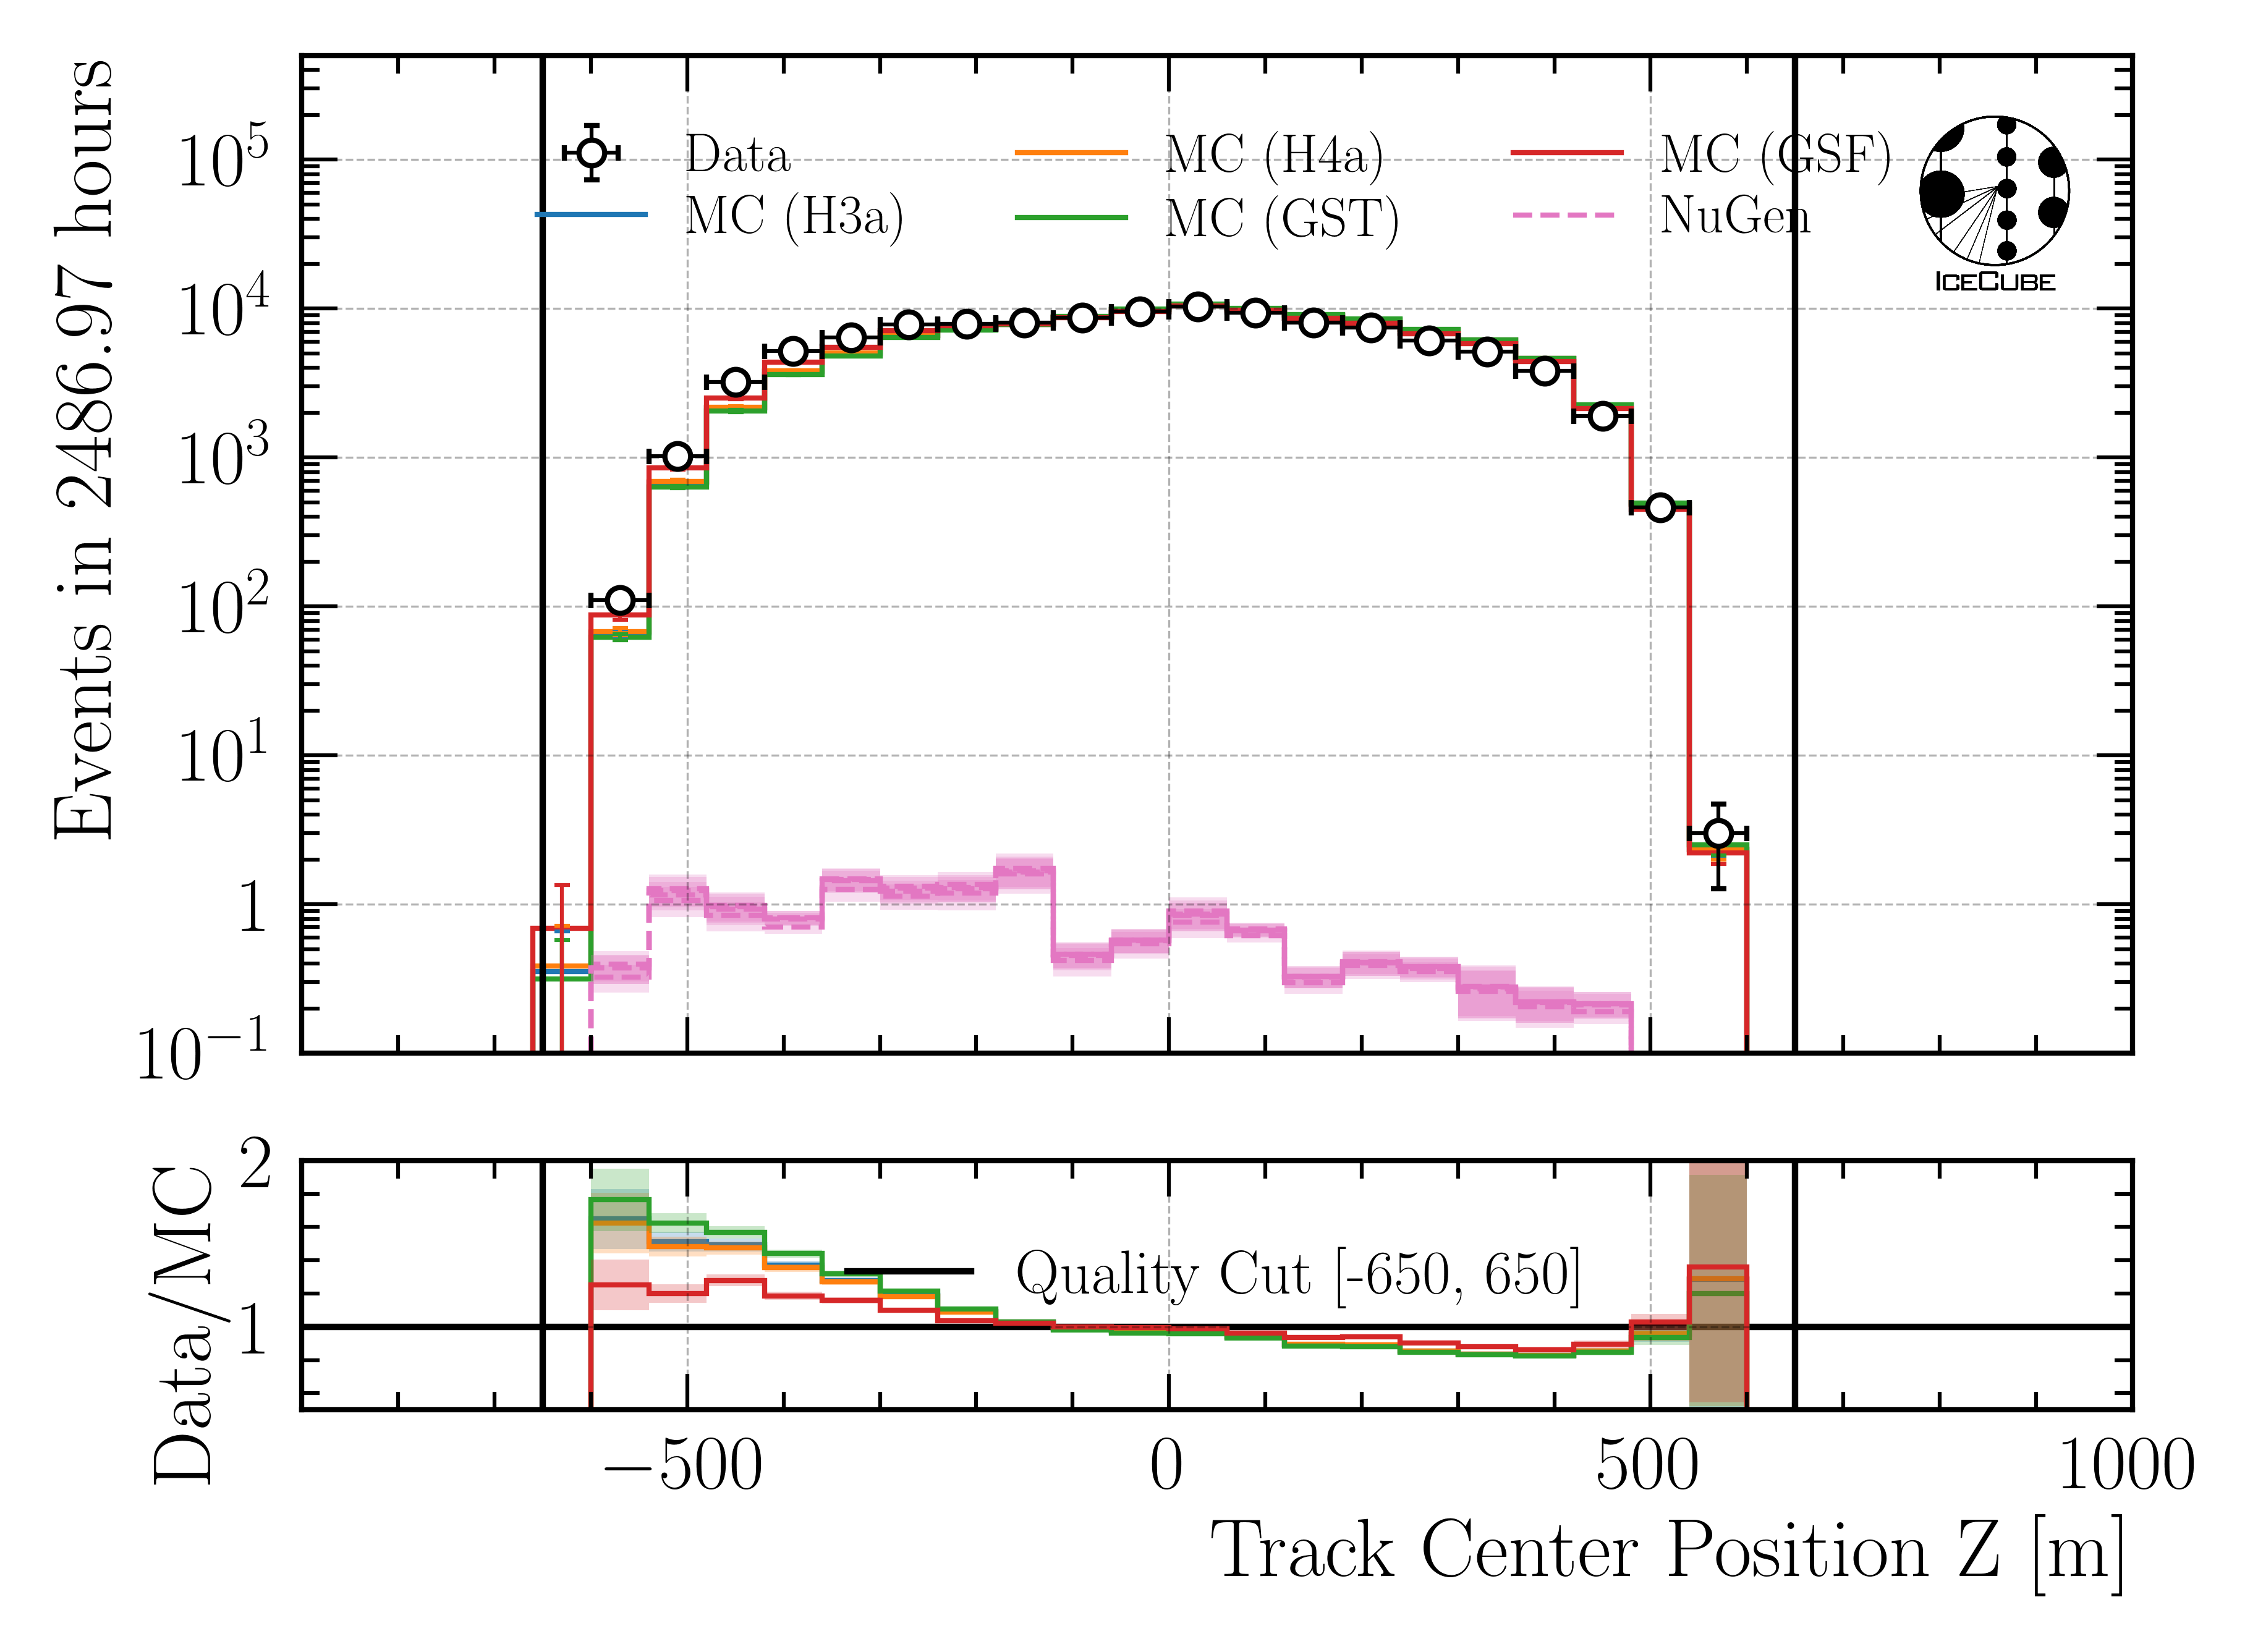
Fig. 117 : Center position z reconstructed by DeepLearningReco_track_geometry_9inputs_6ms_medium_01.
Position z - uncertainty
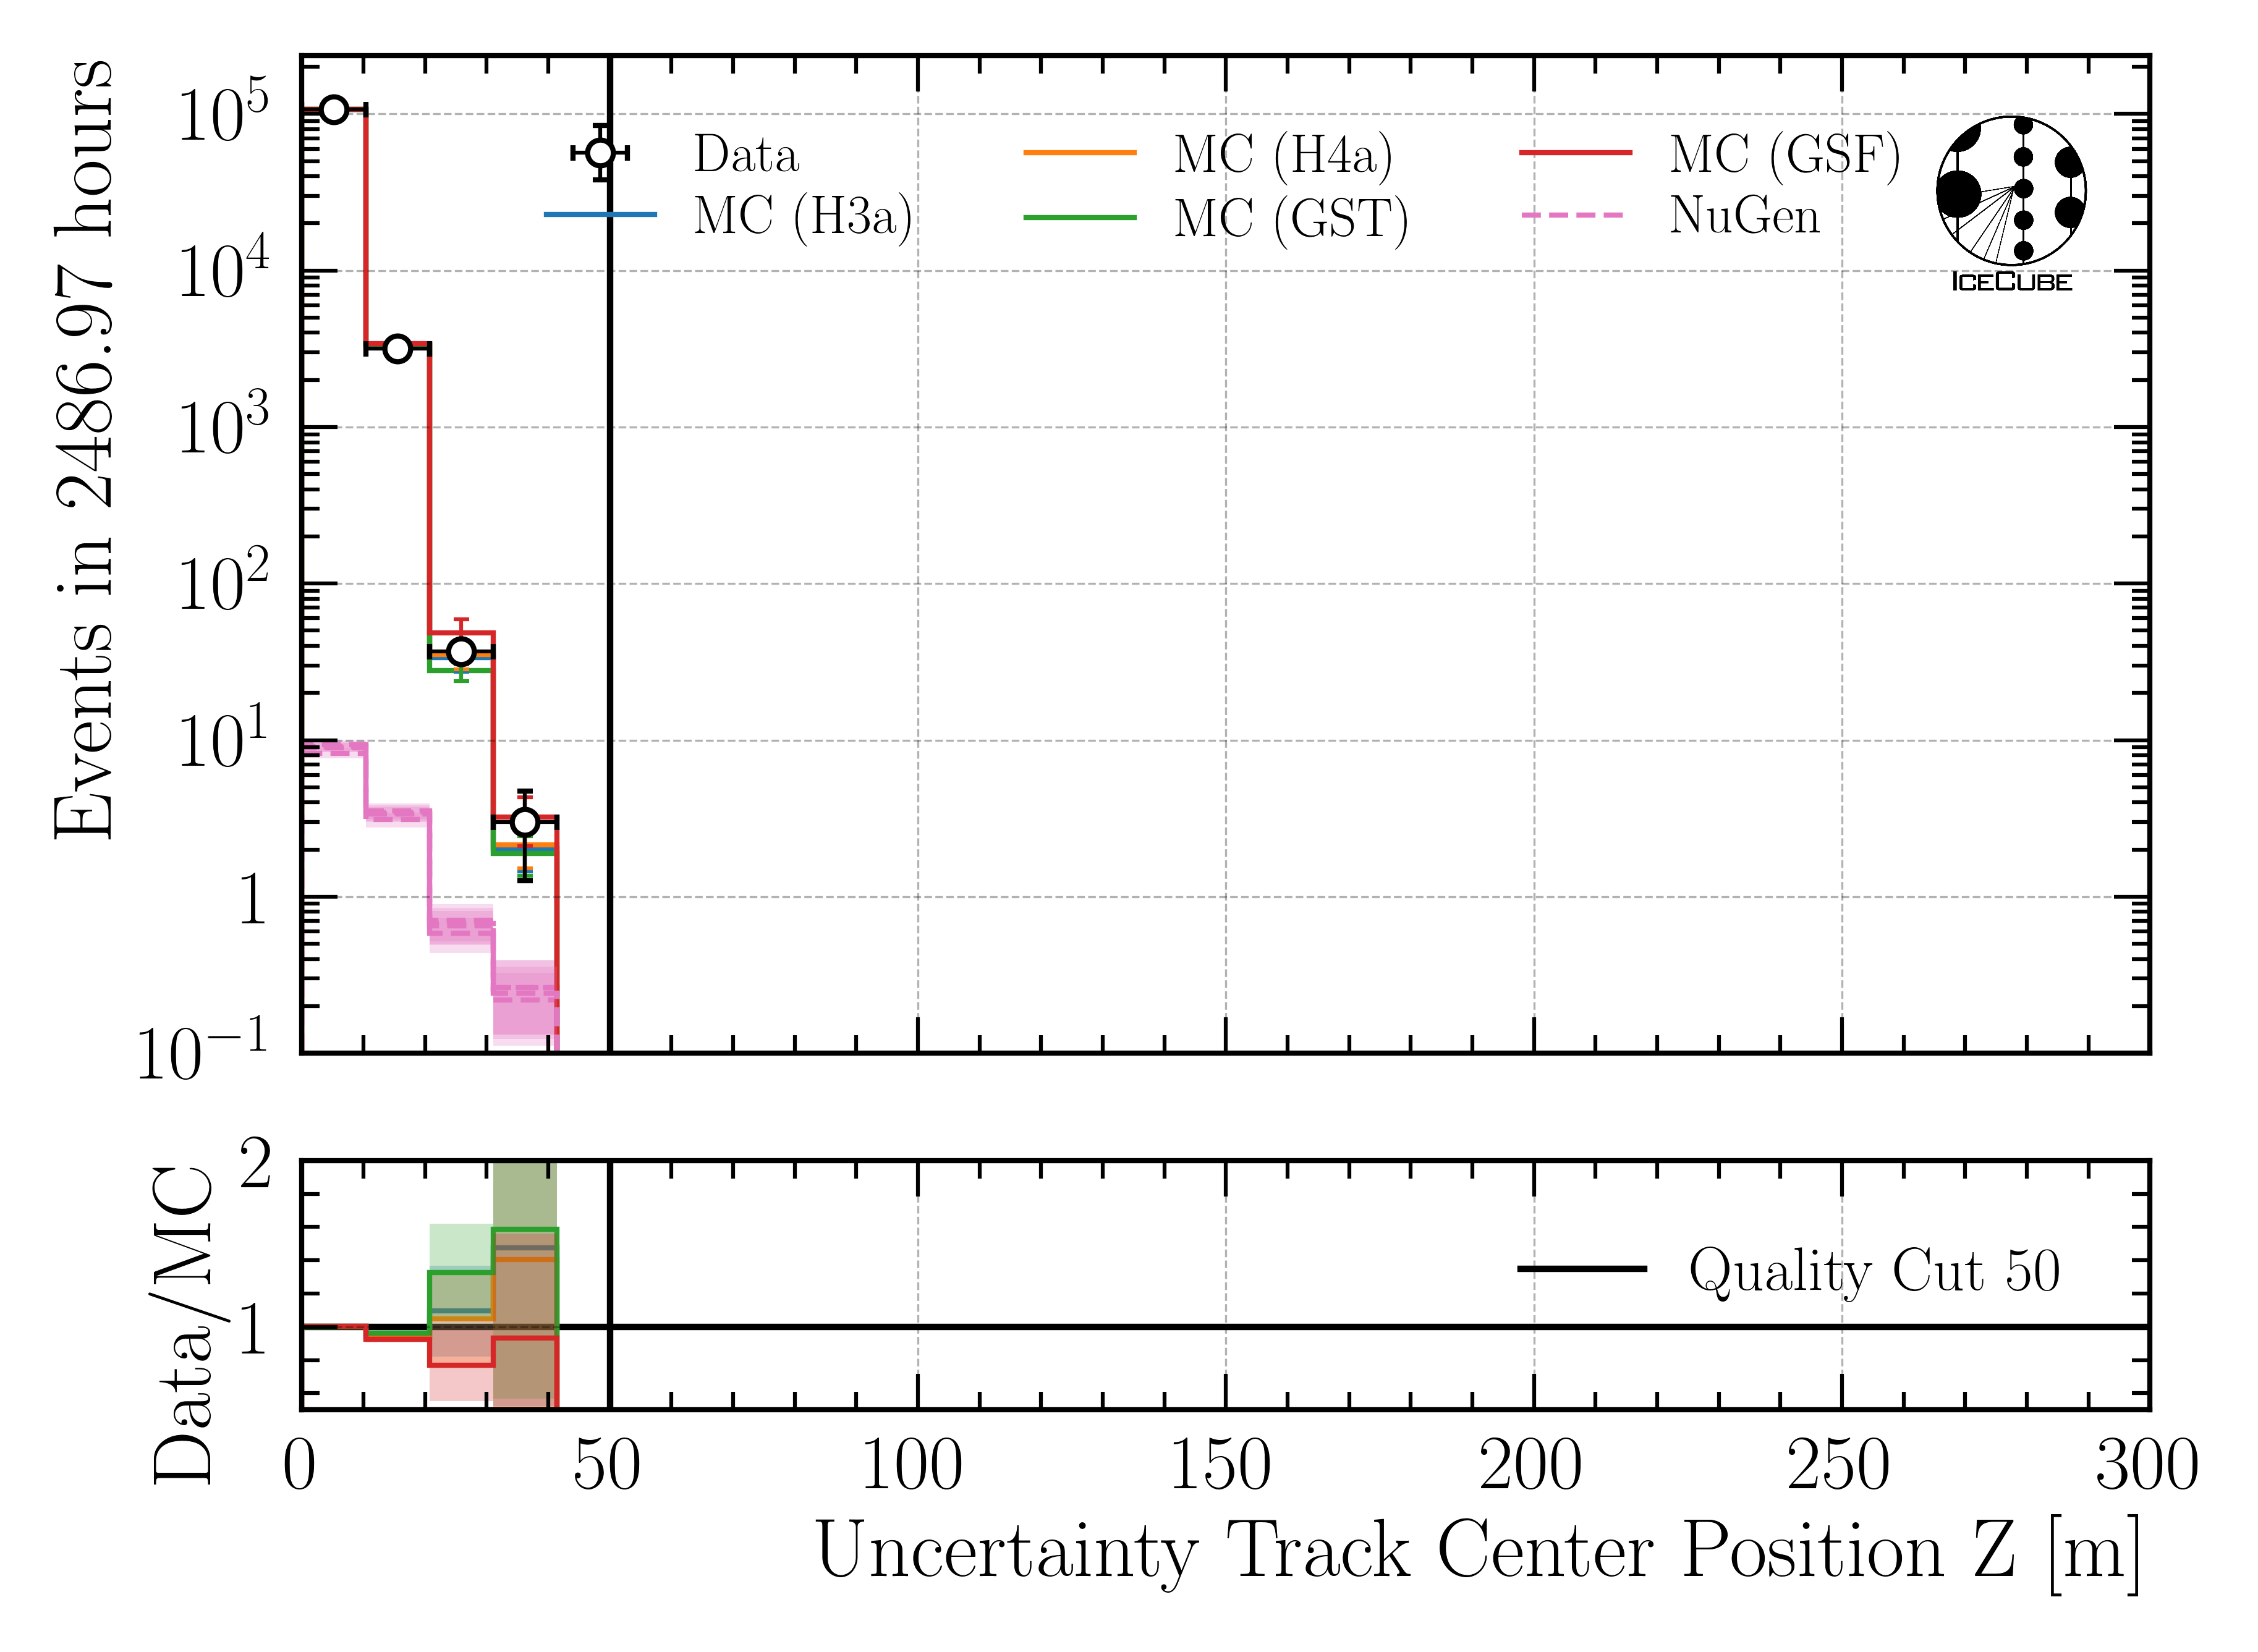
Fig. 118 : Uncertainty of center position z reconstructed by DeepLearningReco_track_geometry_9inputs_6ms_medium_01.
Entry position
Time
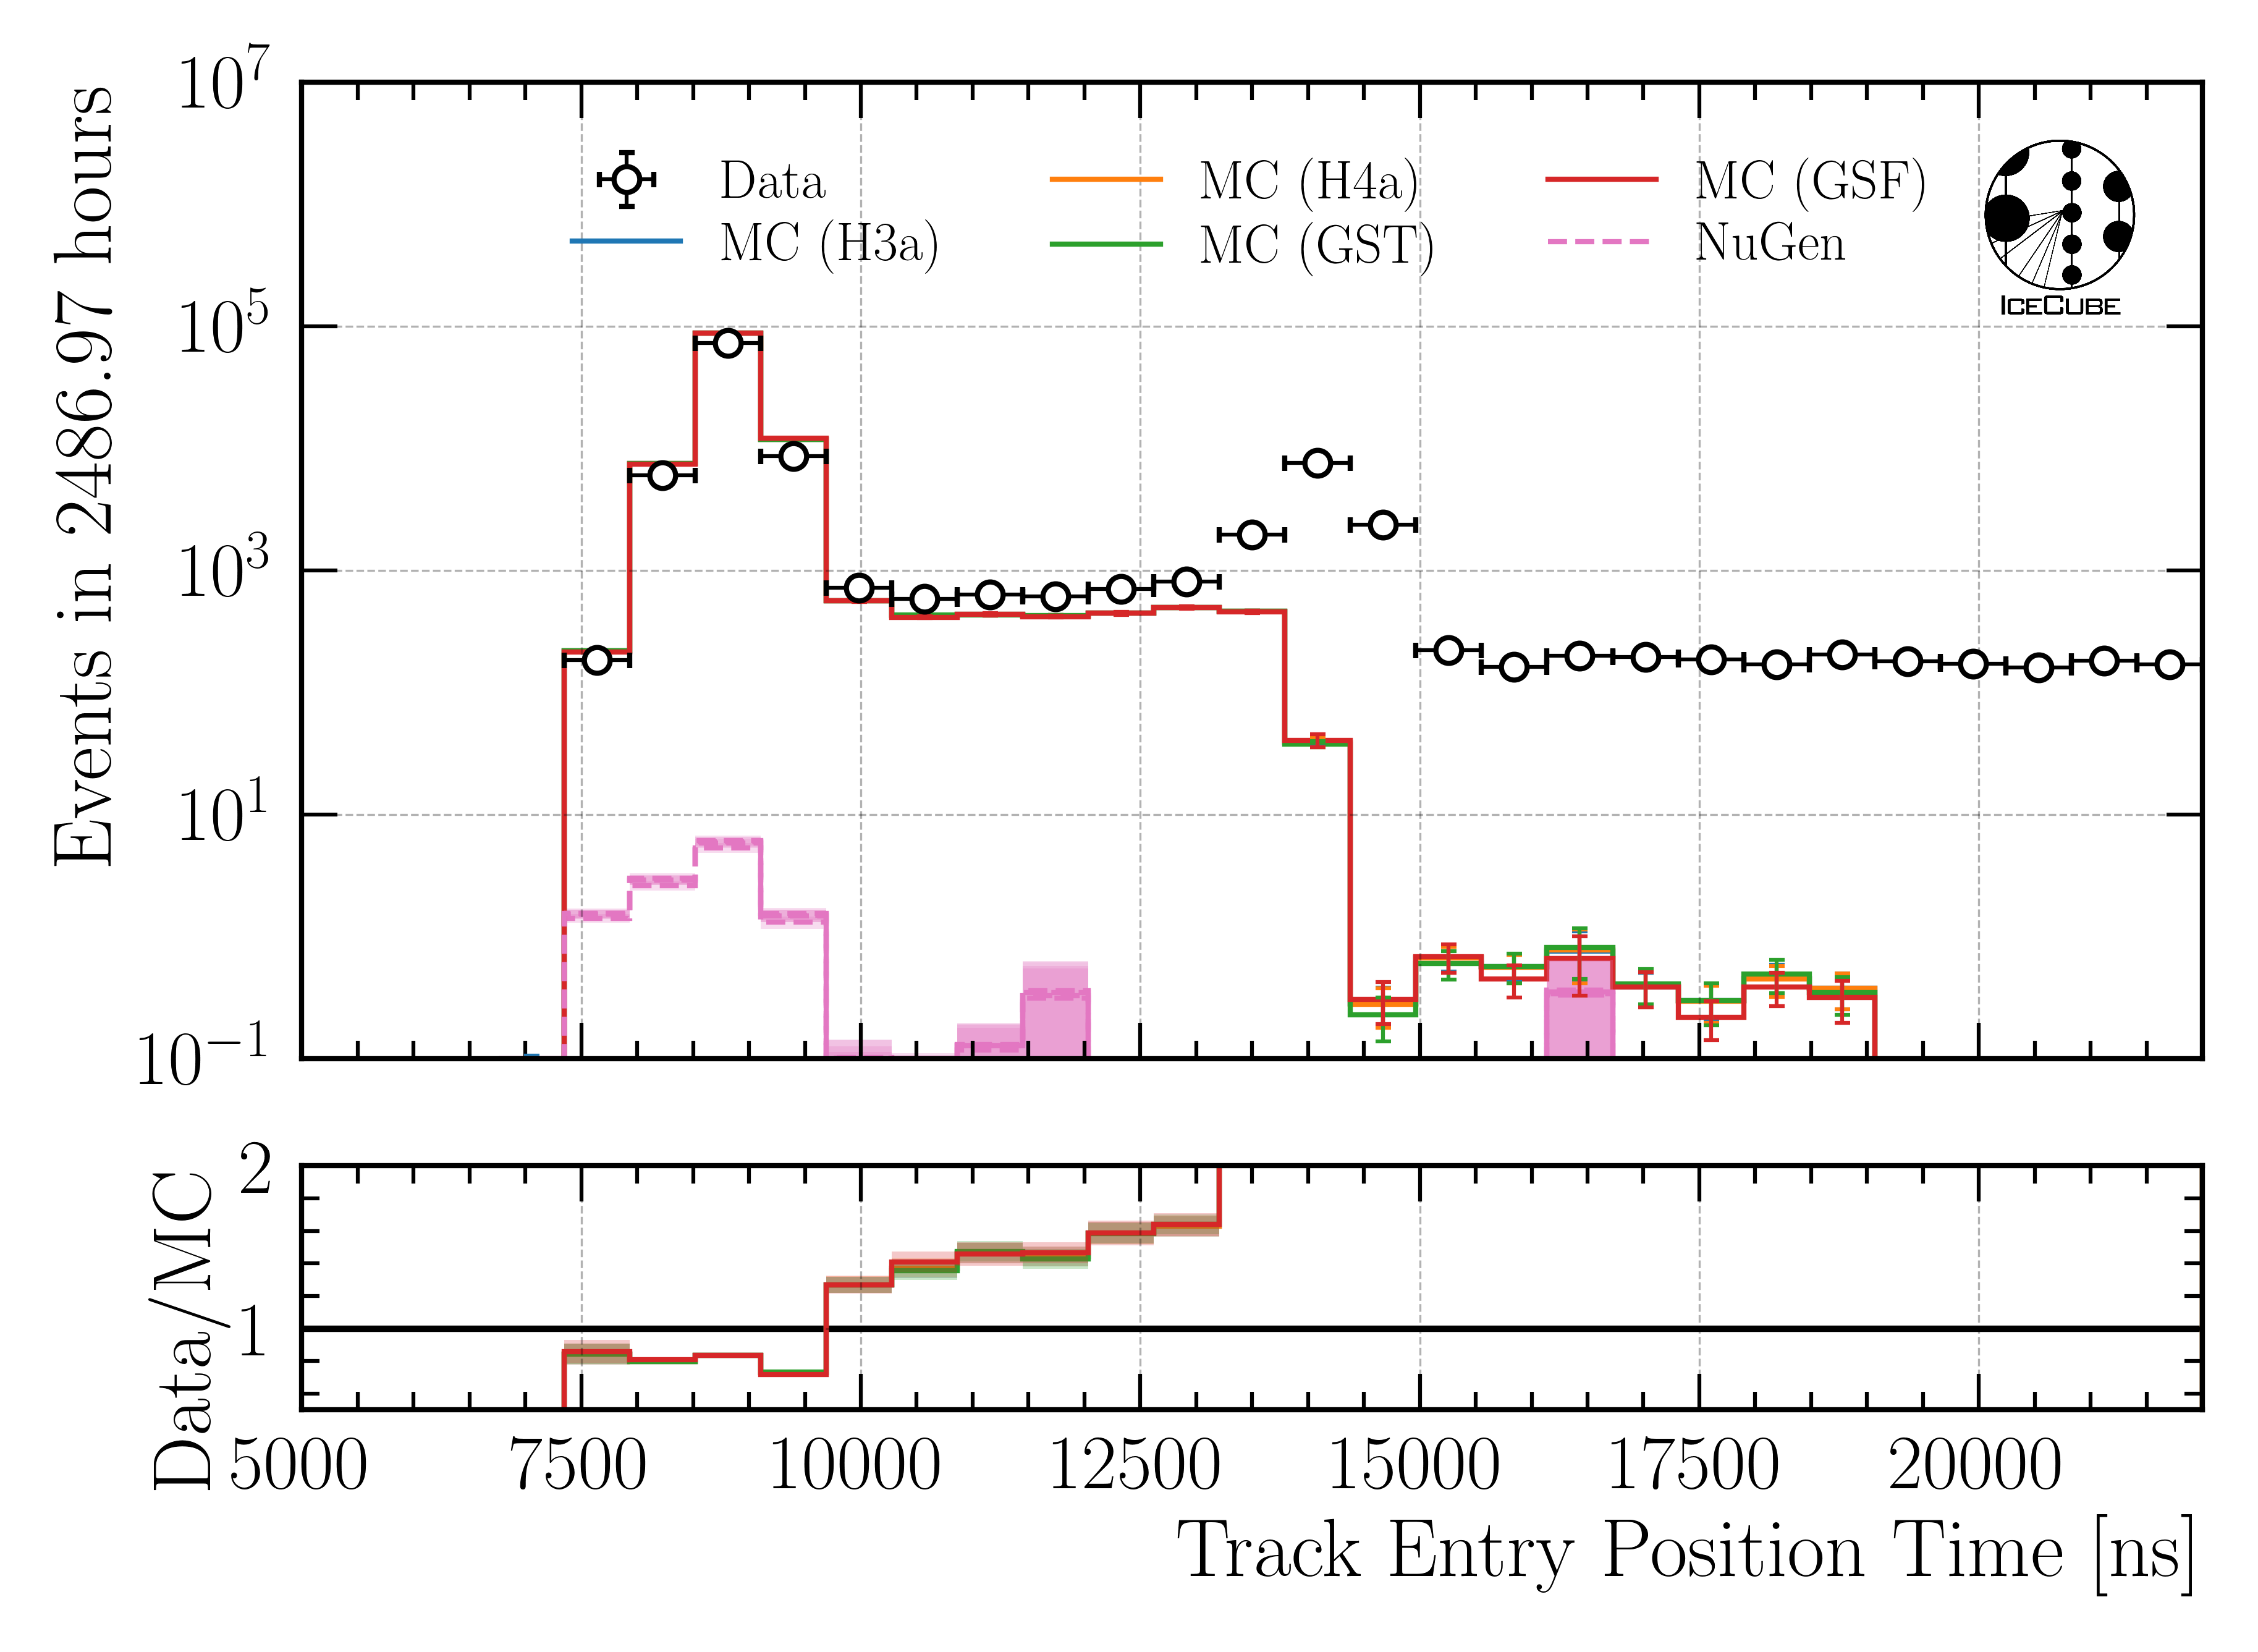
Fig. 119 : Entry time reconstructed by DeepLearningReco_track_geometry_9inputs_6ms_medium_01.
Time - uncertainty
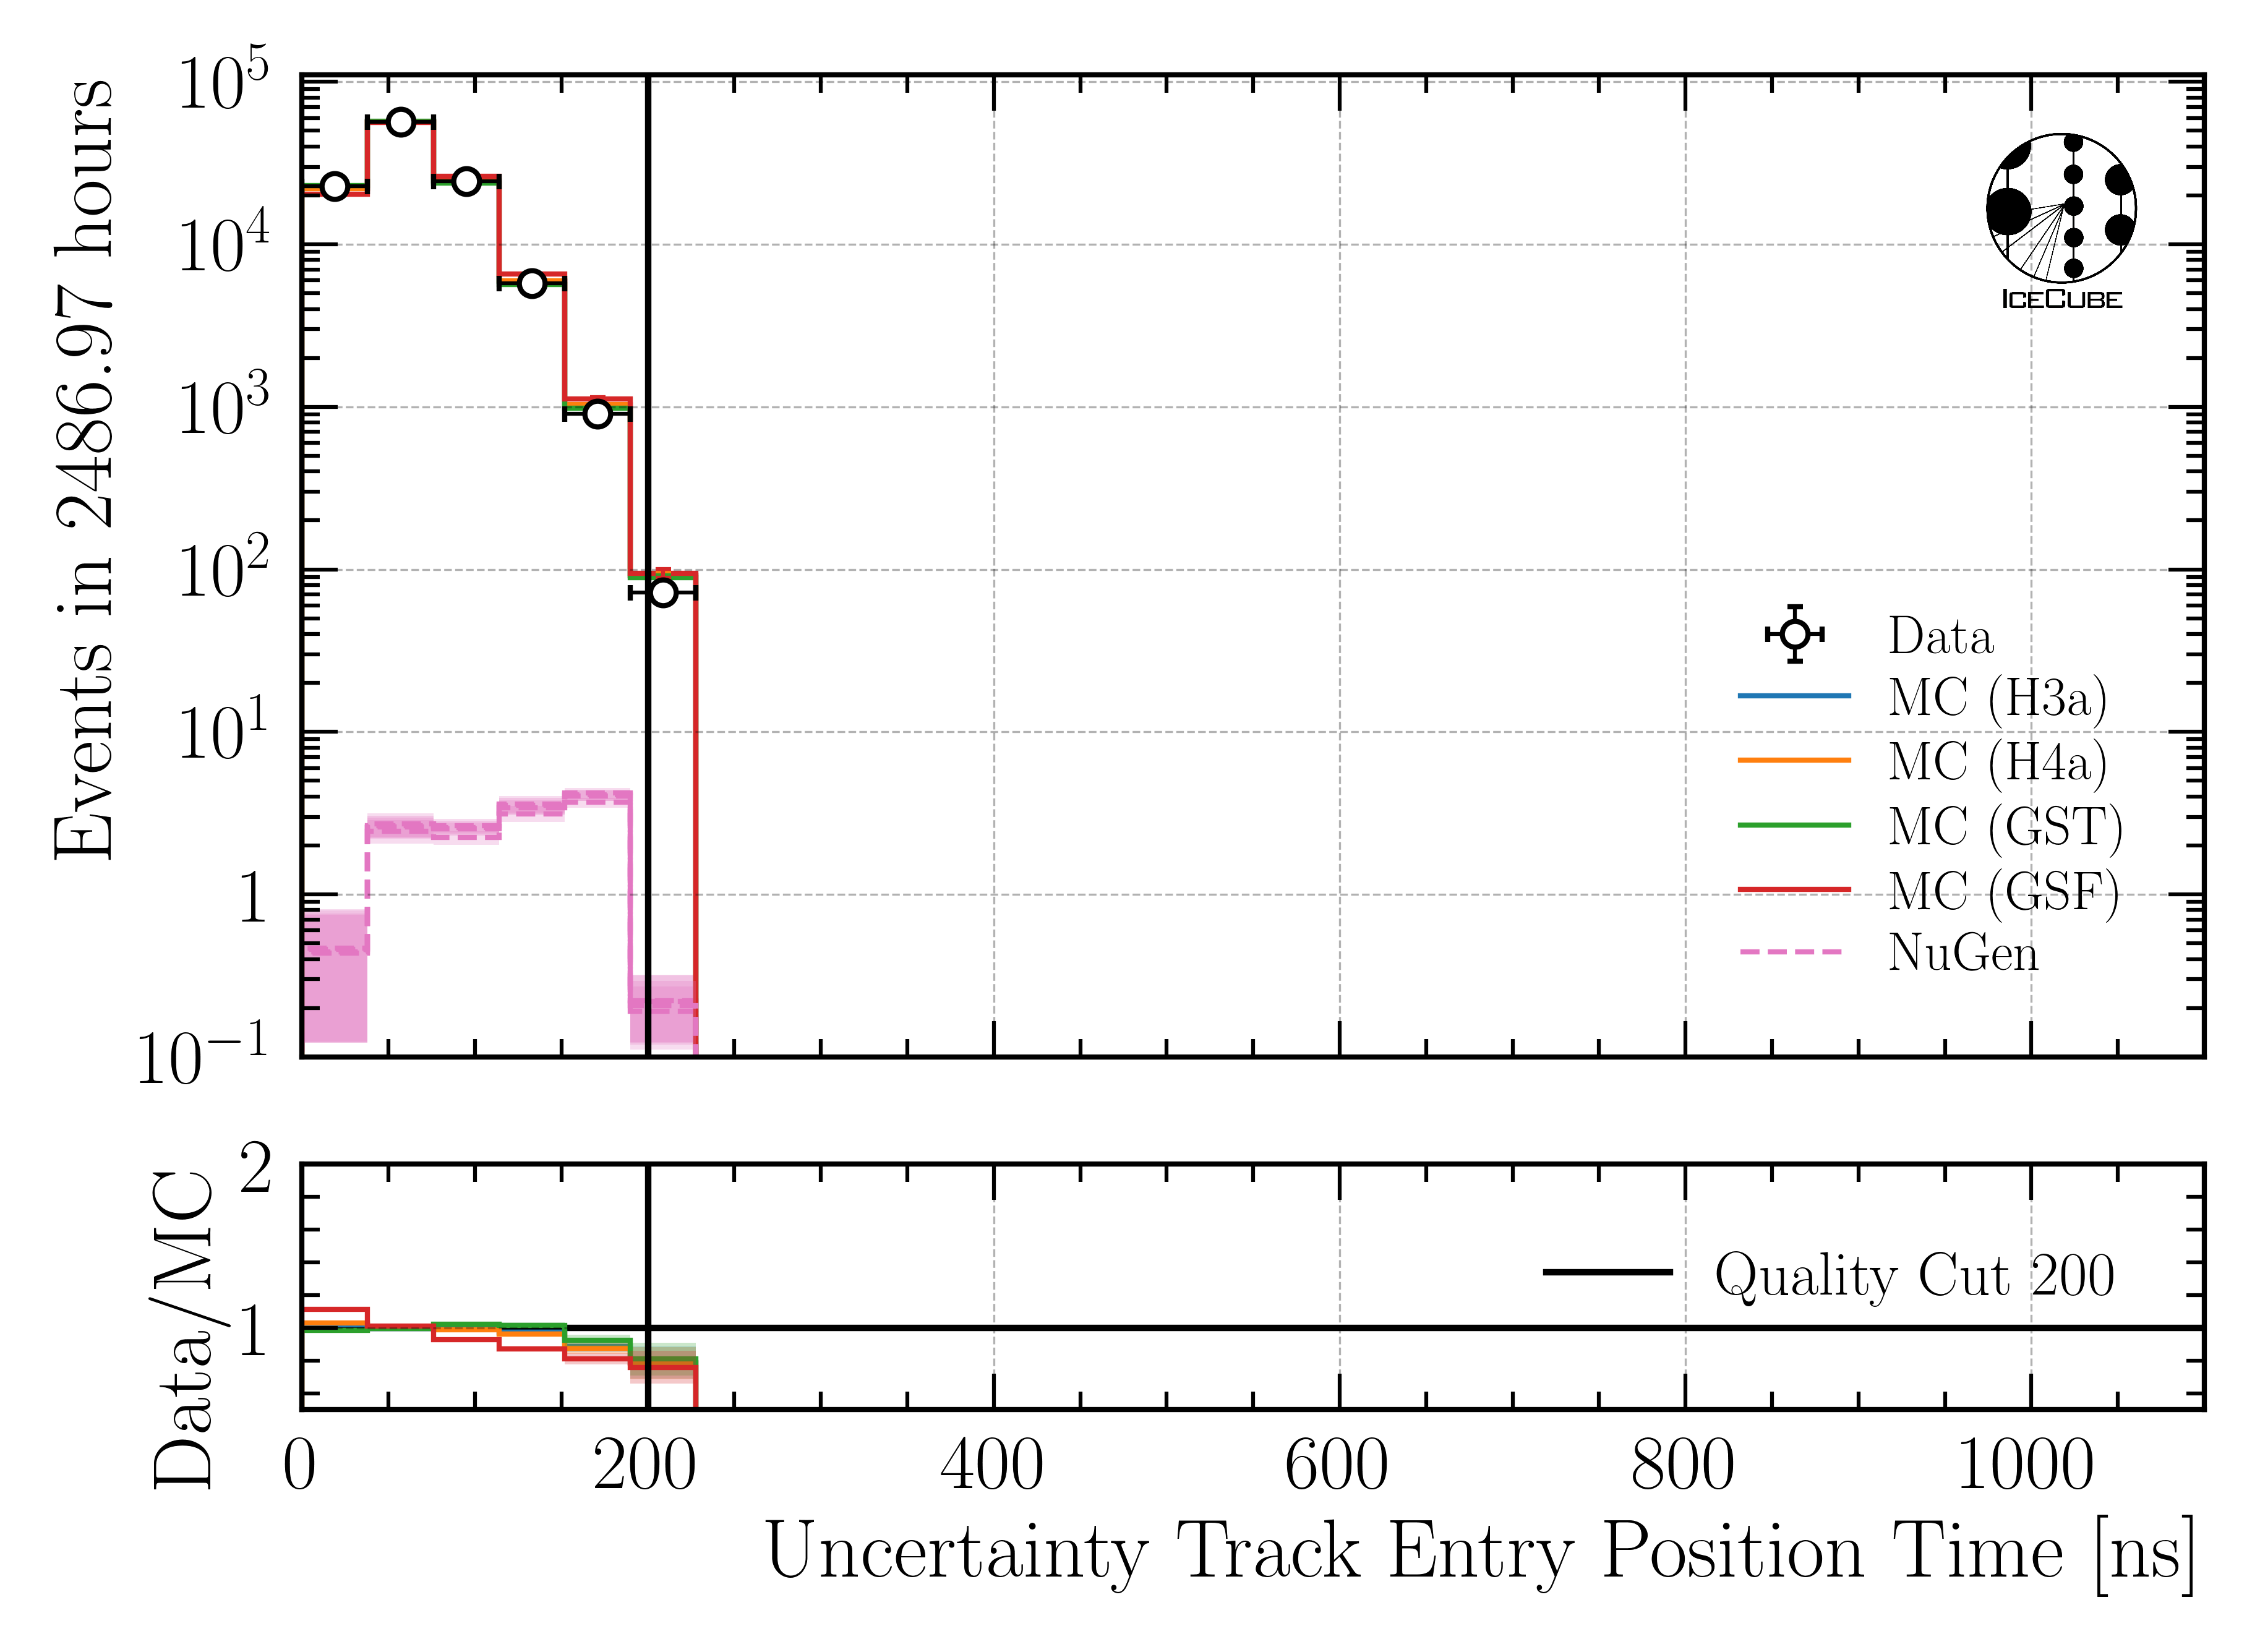
Fig. 120 : Uncertainty of entry time reconstructed by DeepLearningReco_track_geometry_9inputs_6ms_medium_01.
Position x
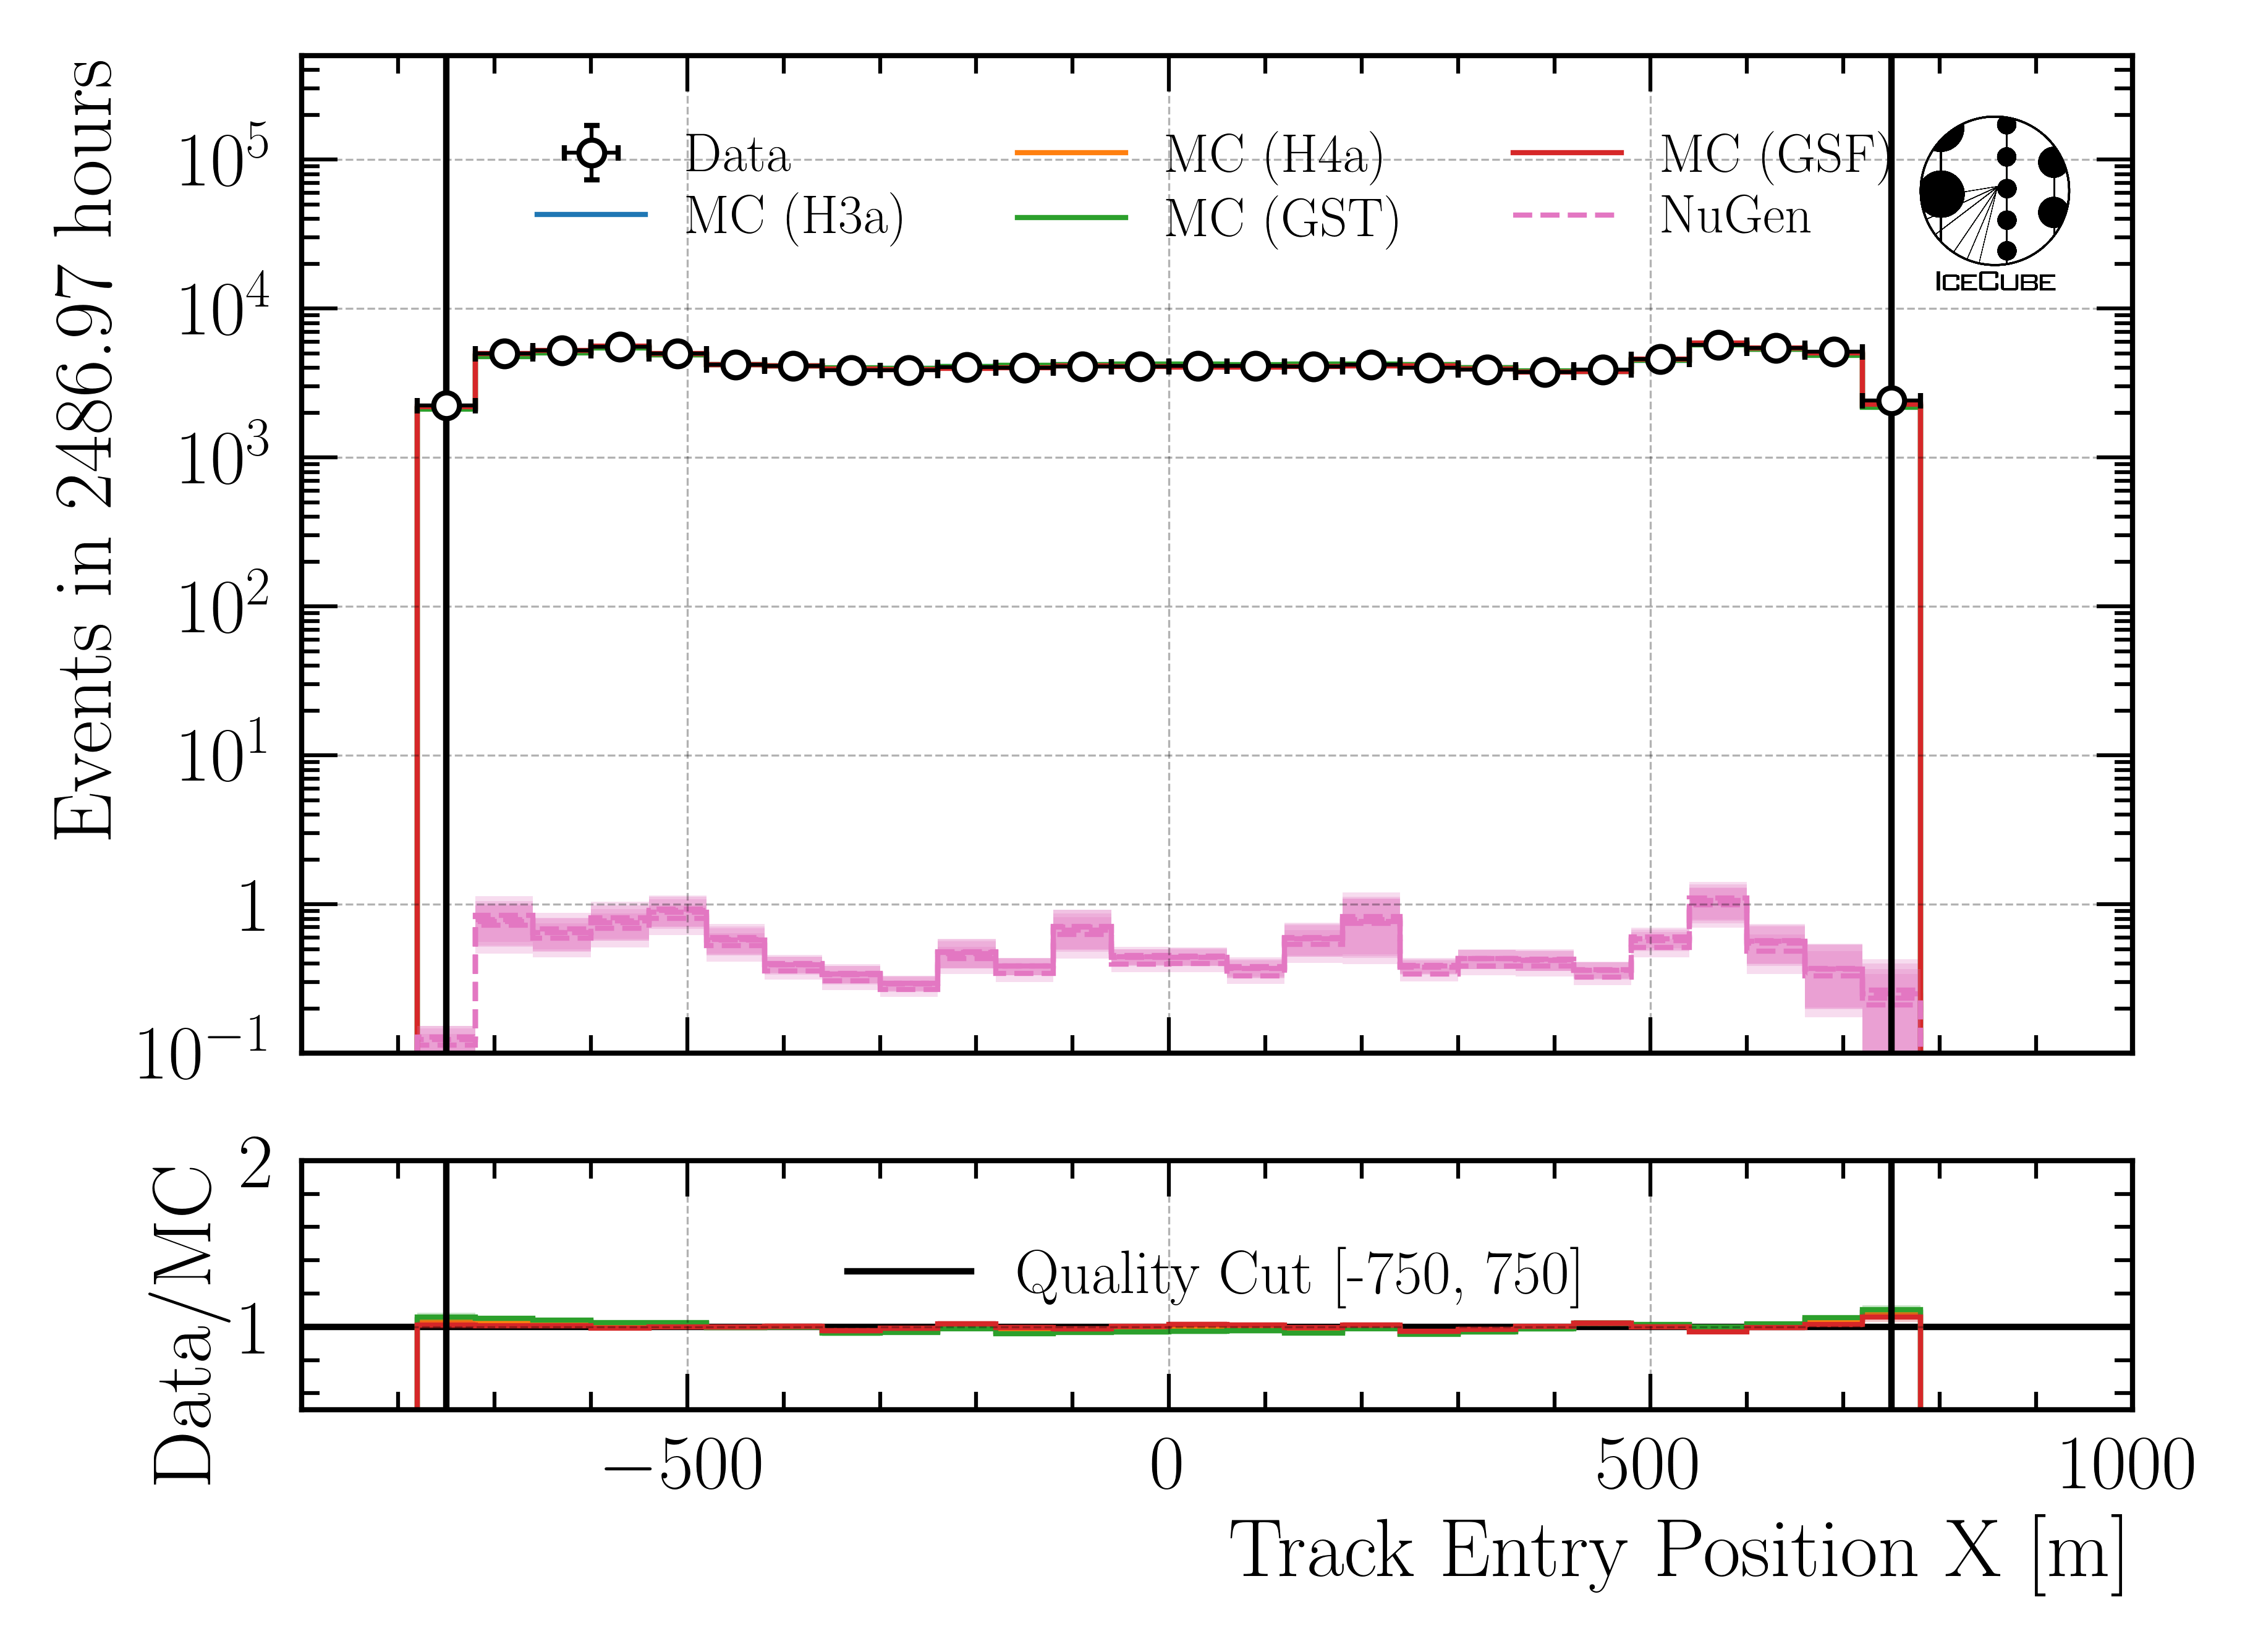
Fig. 121 : Entry position x reconstructed by DeepLearningReco_track_geometry_9inputs_6ms_medium_01.
Position x - uncertainty
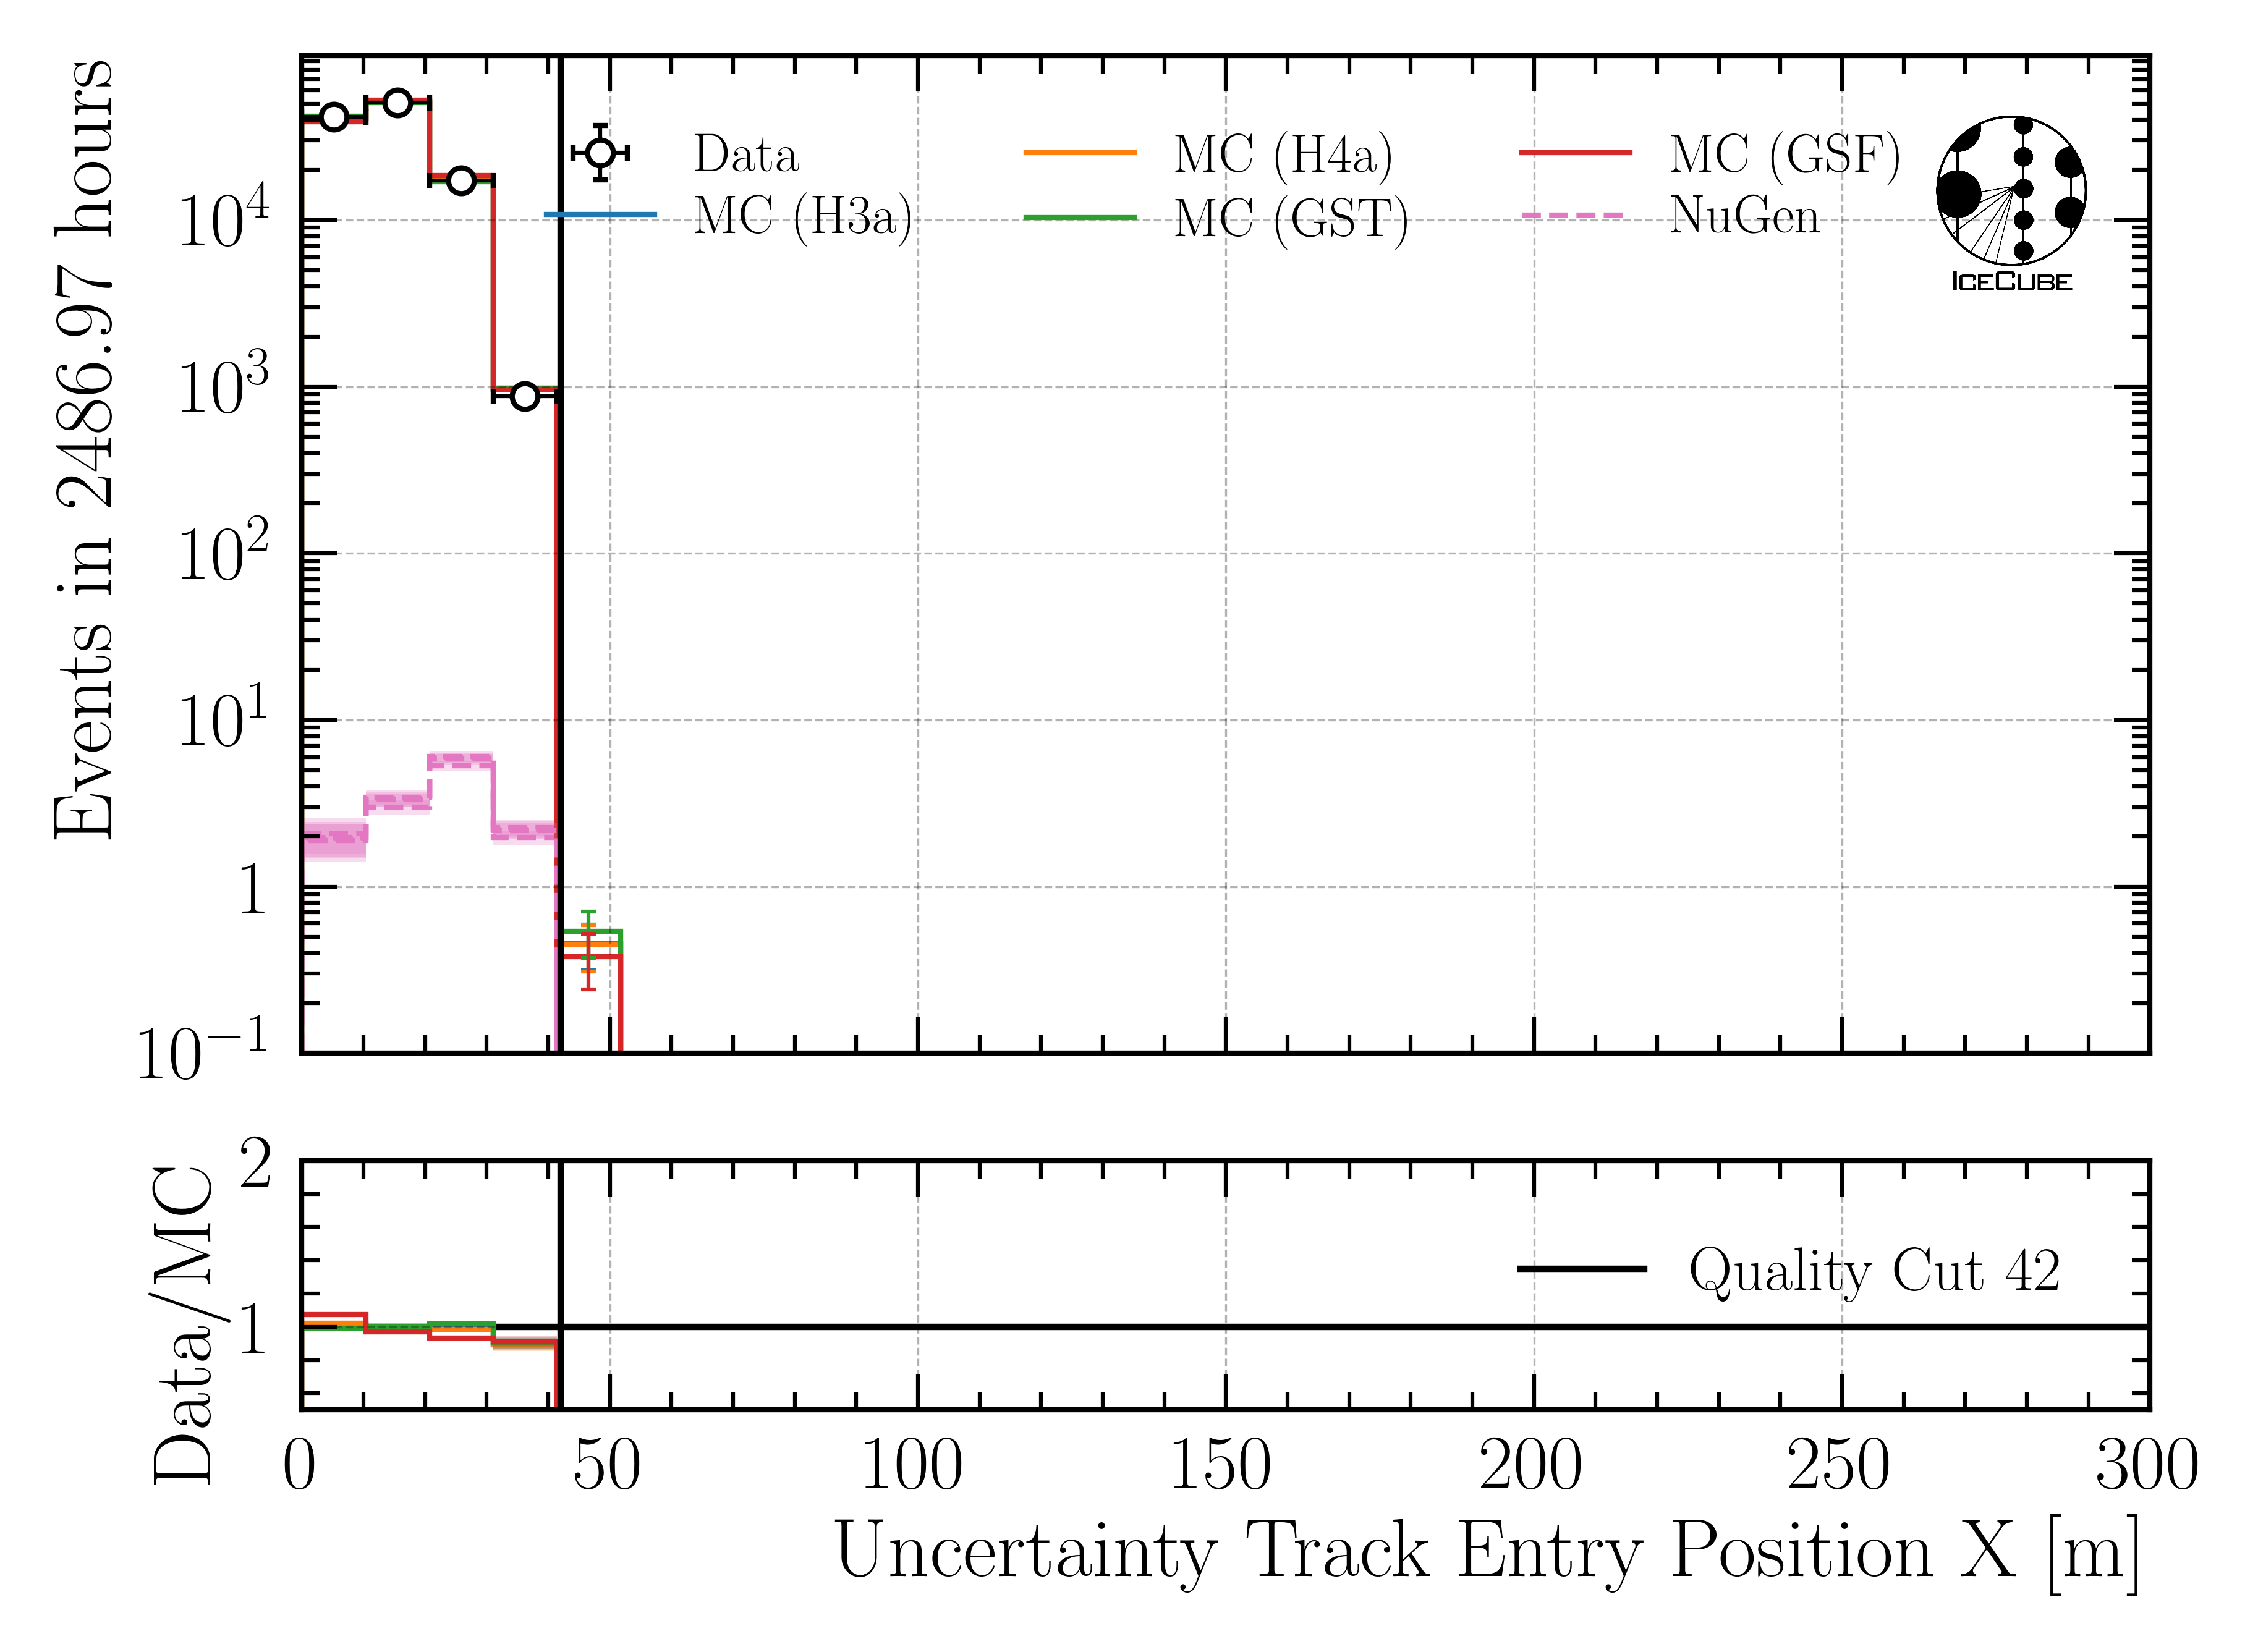
Fig. 122 : Uncertainty of entry position x reconstructed by DeepLearningReco_track_geometry_9inputs_6ms_medium_01.
Position y
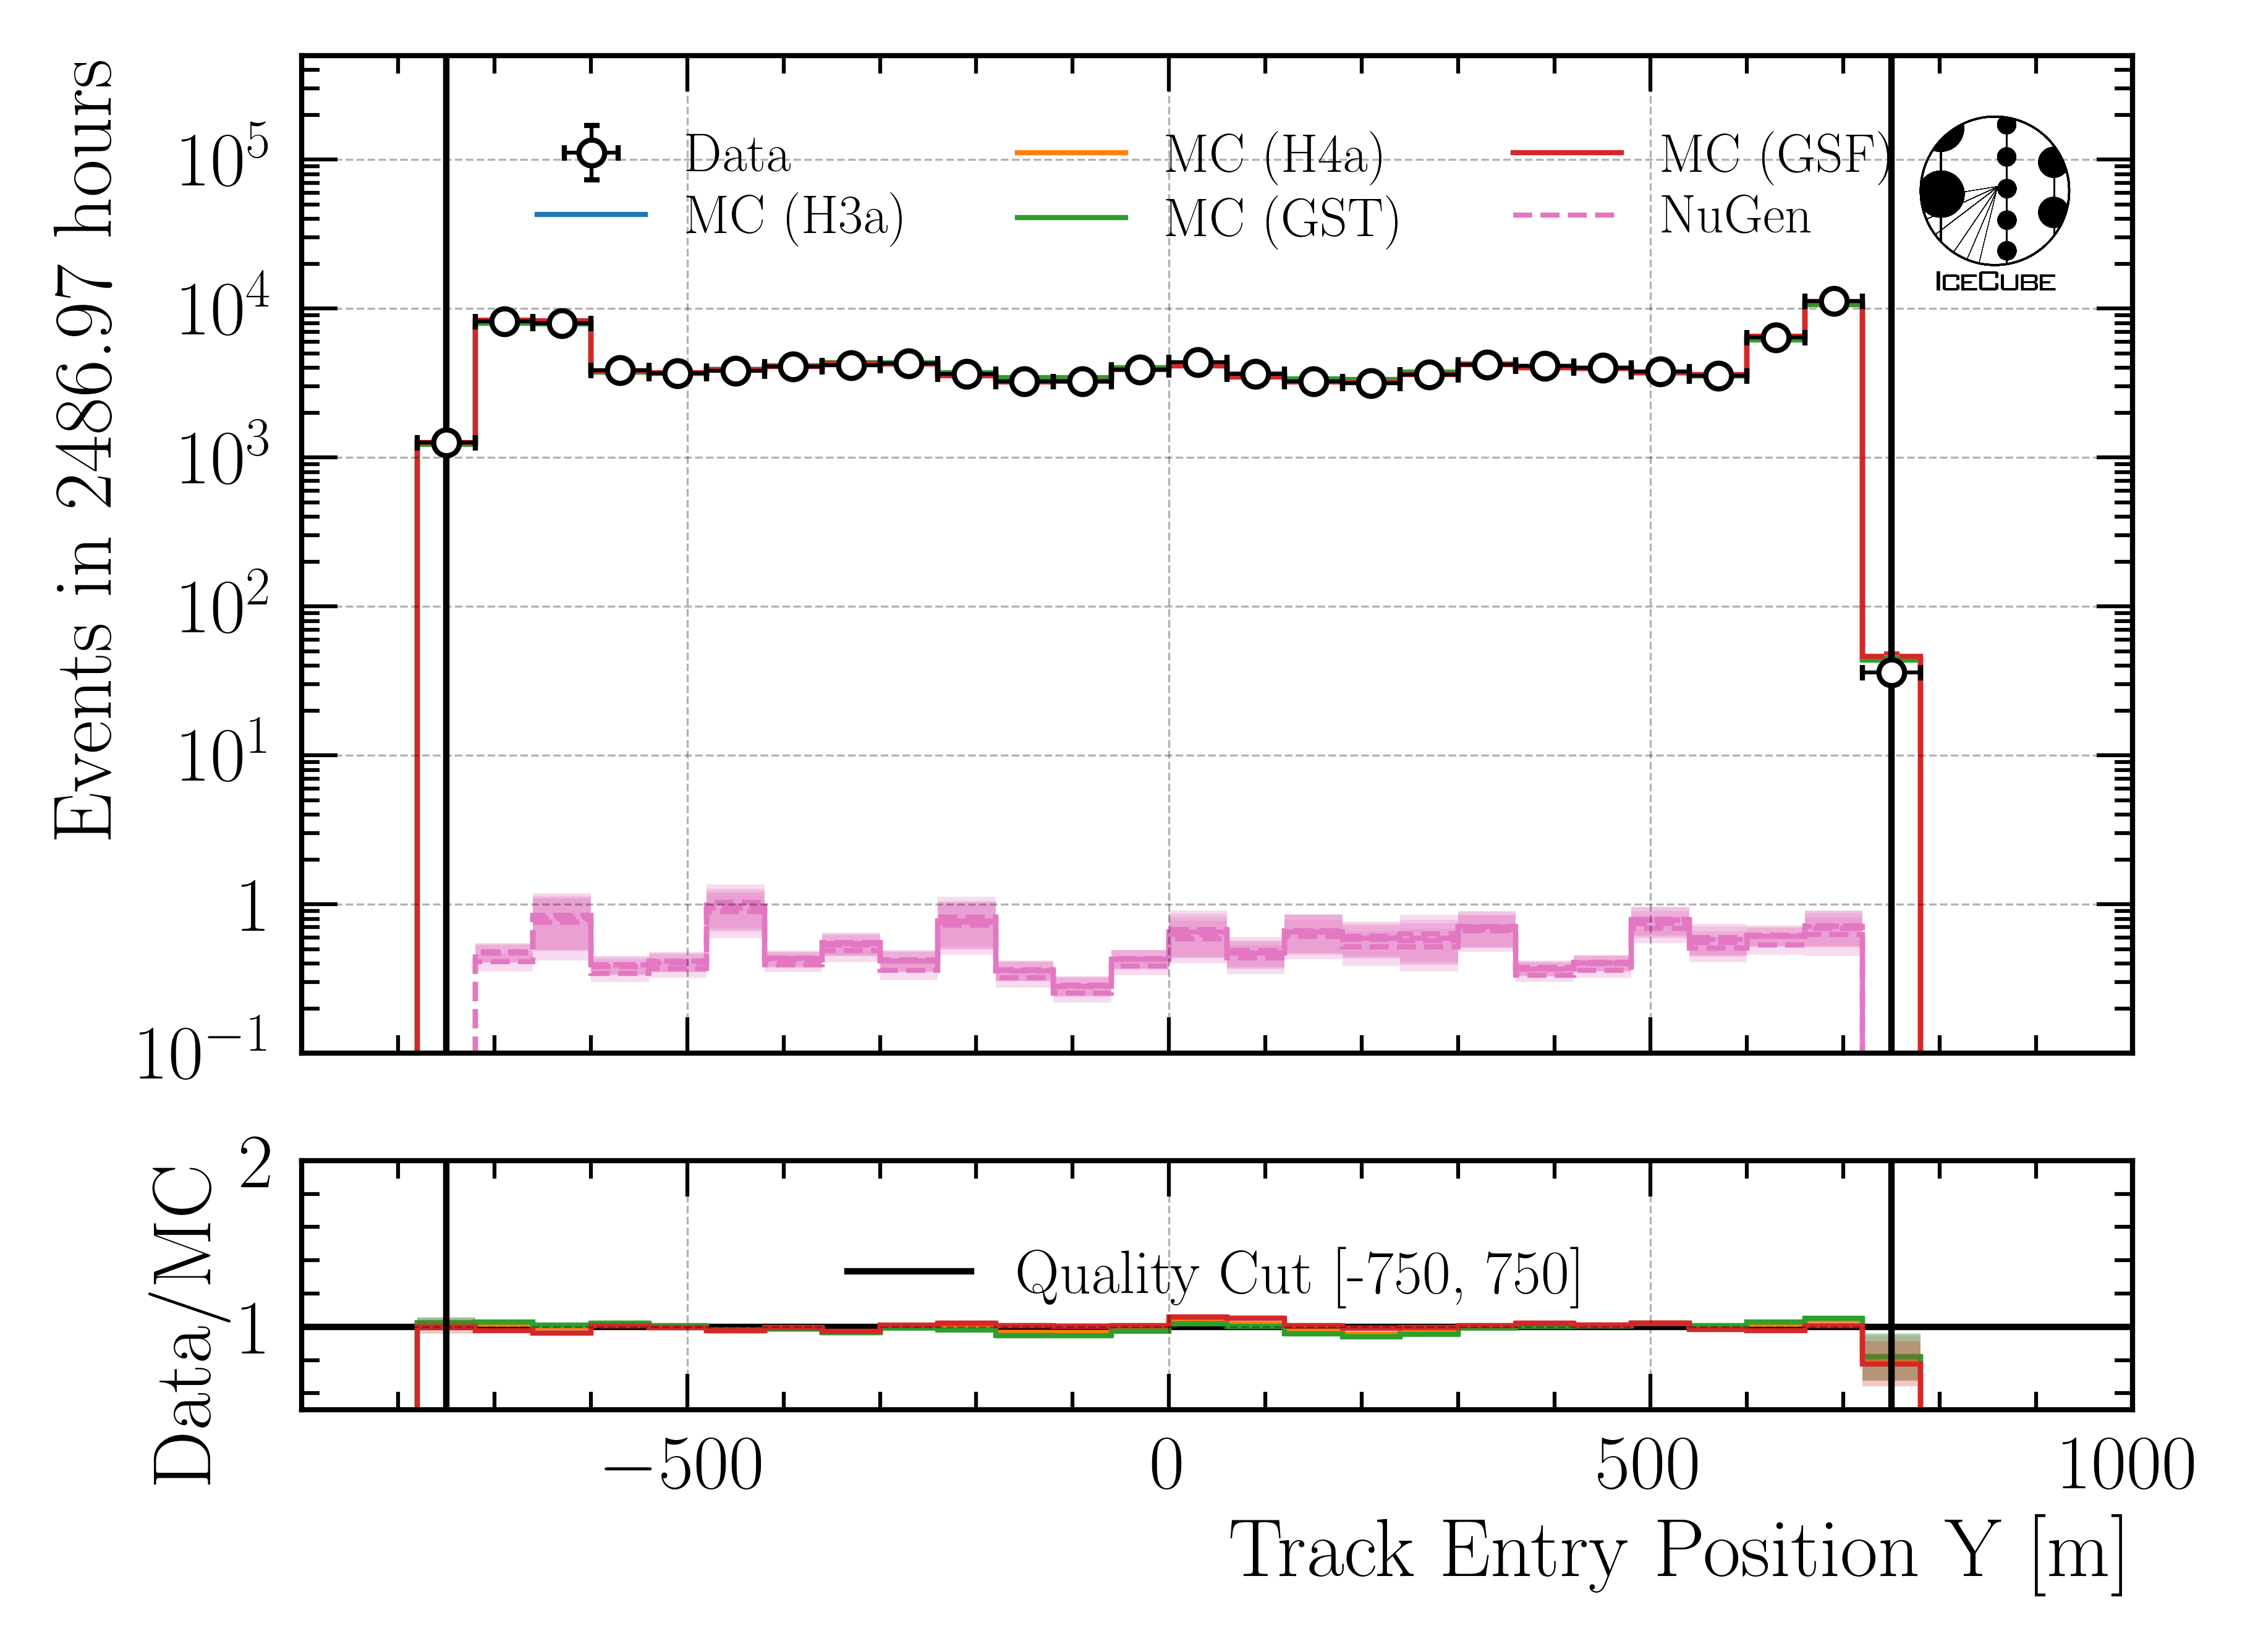
Fig. 123 : Entry position y reconstructed by DeepLearningReco_track_geometry_9inputs_6ms_medium_01.
Position y - uncertainty
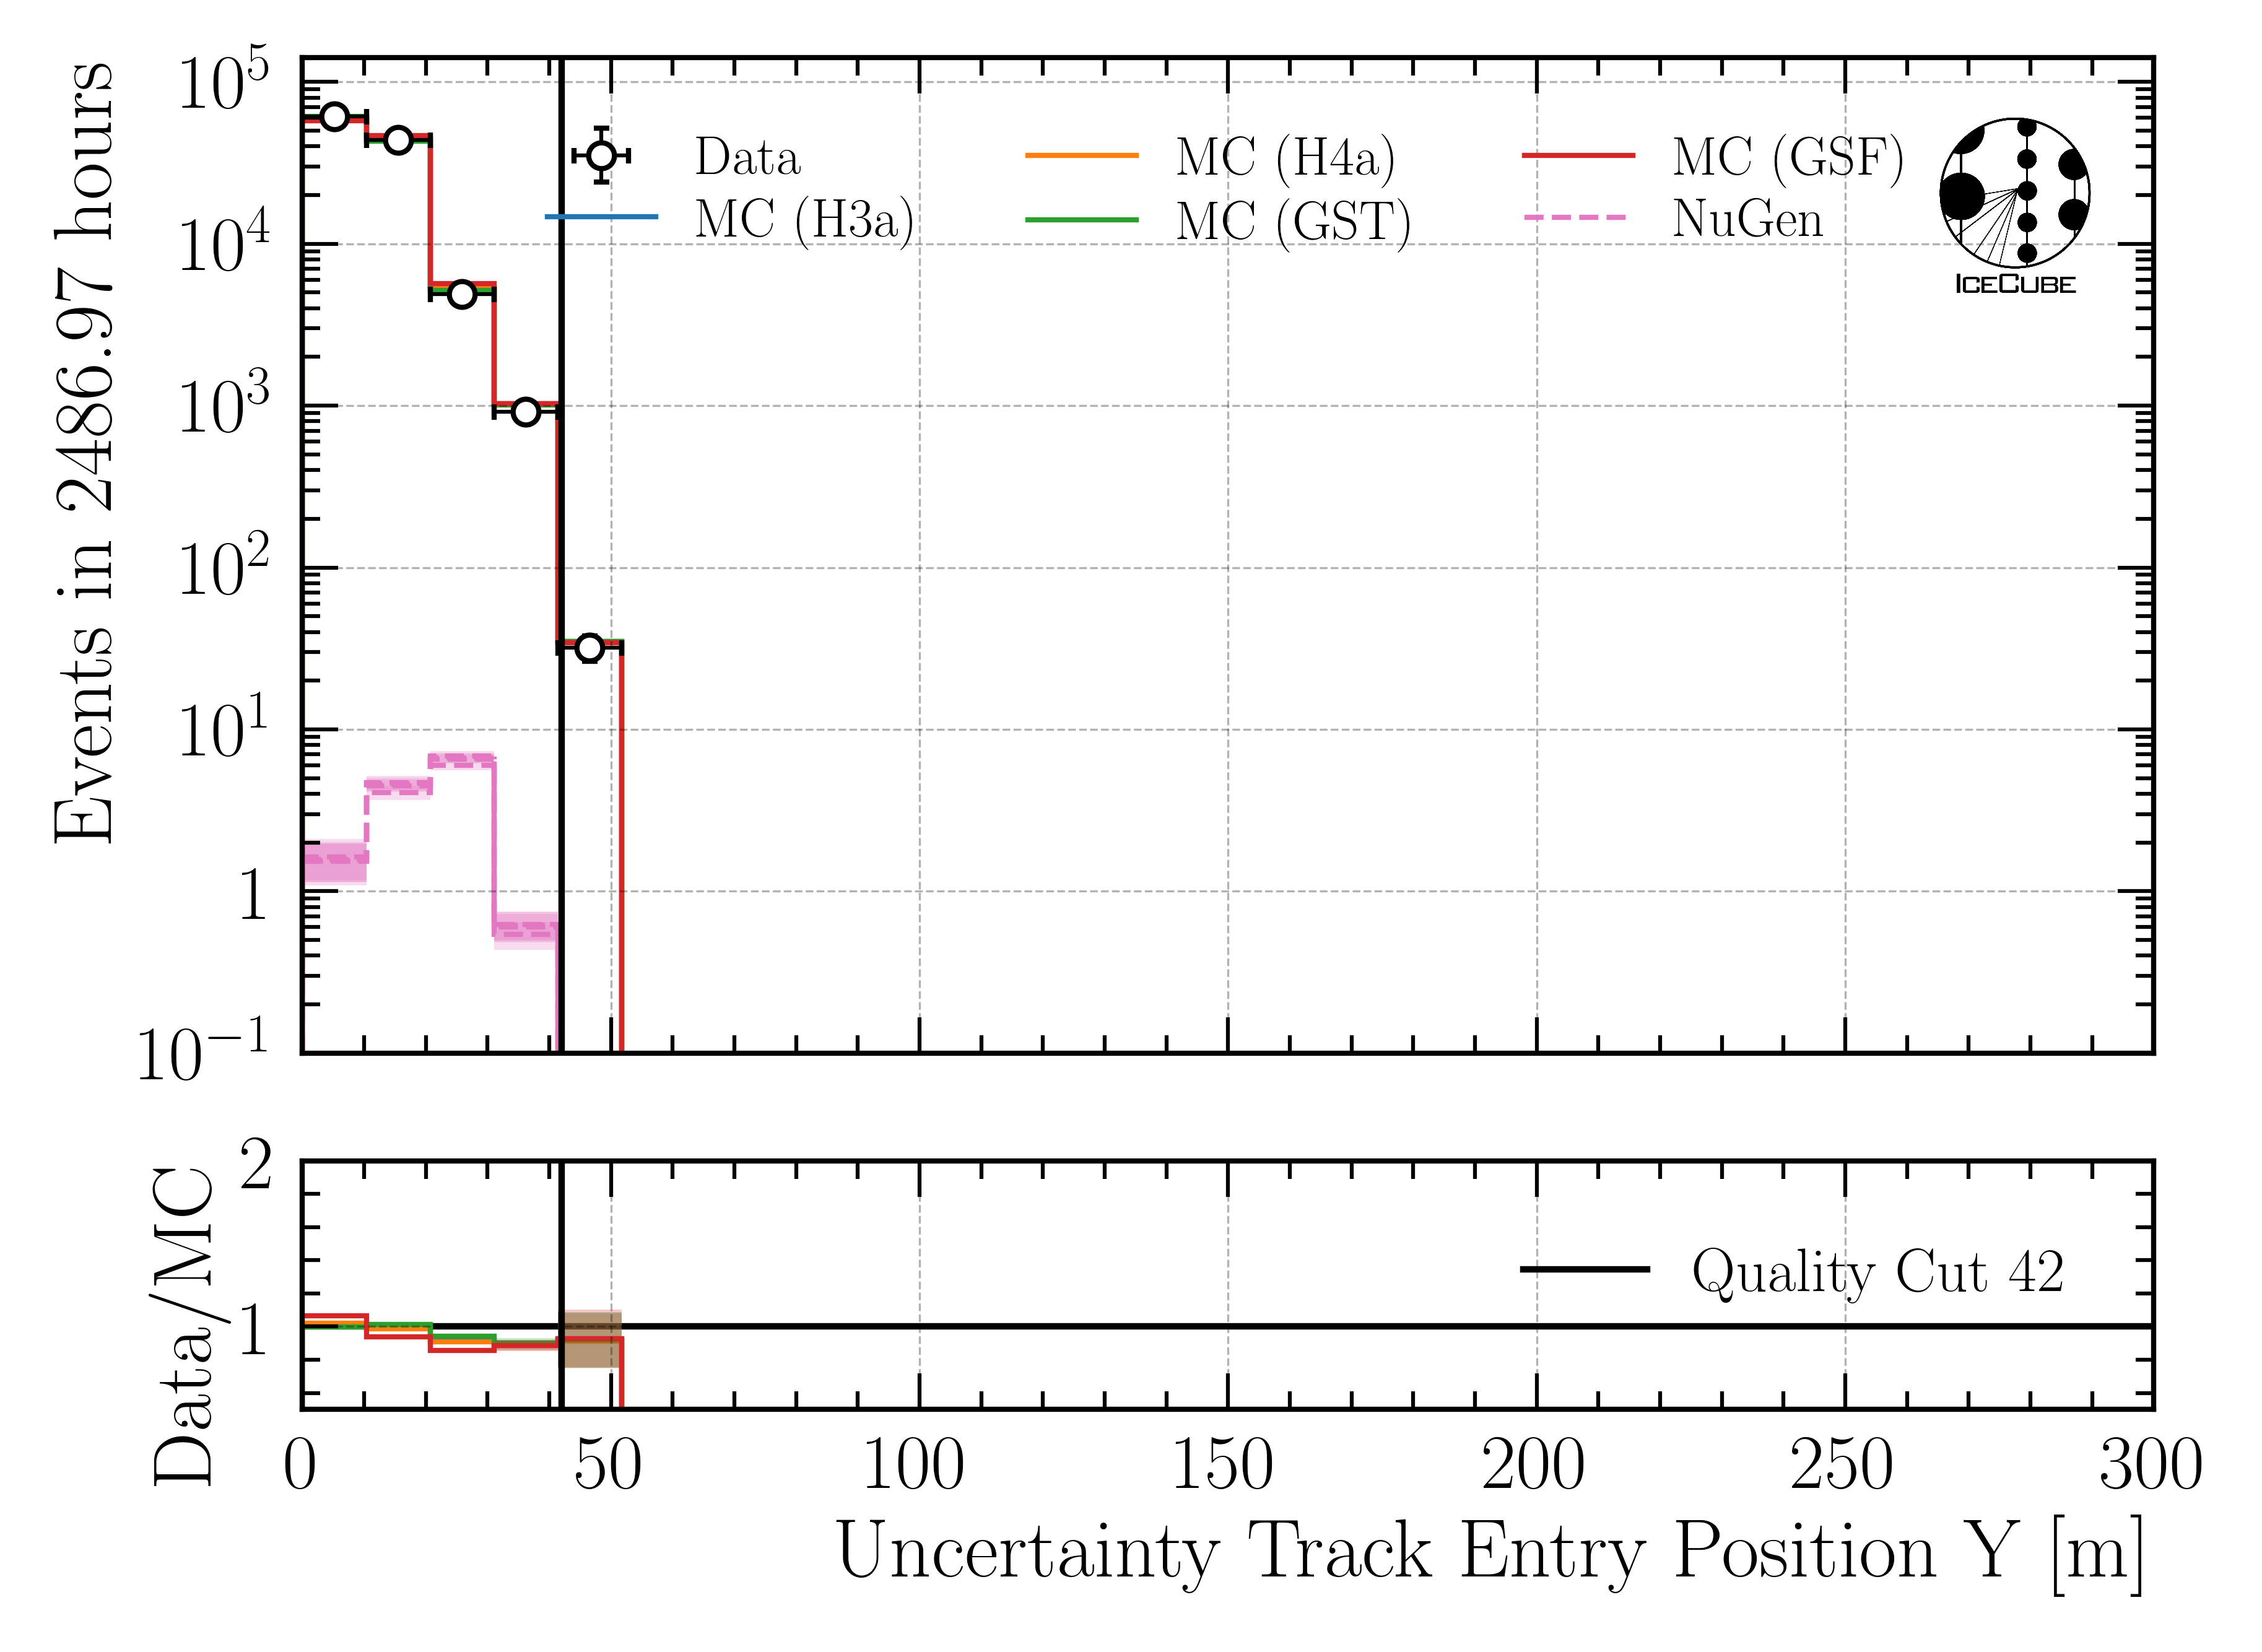
Fig. 124 : Uncertainty of entry position y reconstructed by DeepLearningReco_track_geometry_9inputs_6ms_medium_01.
Position z
Further investigations of the z-vertex can be found in the Appendix/Z-vertex investigations (L5).
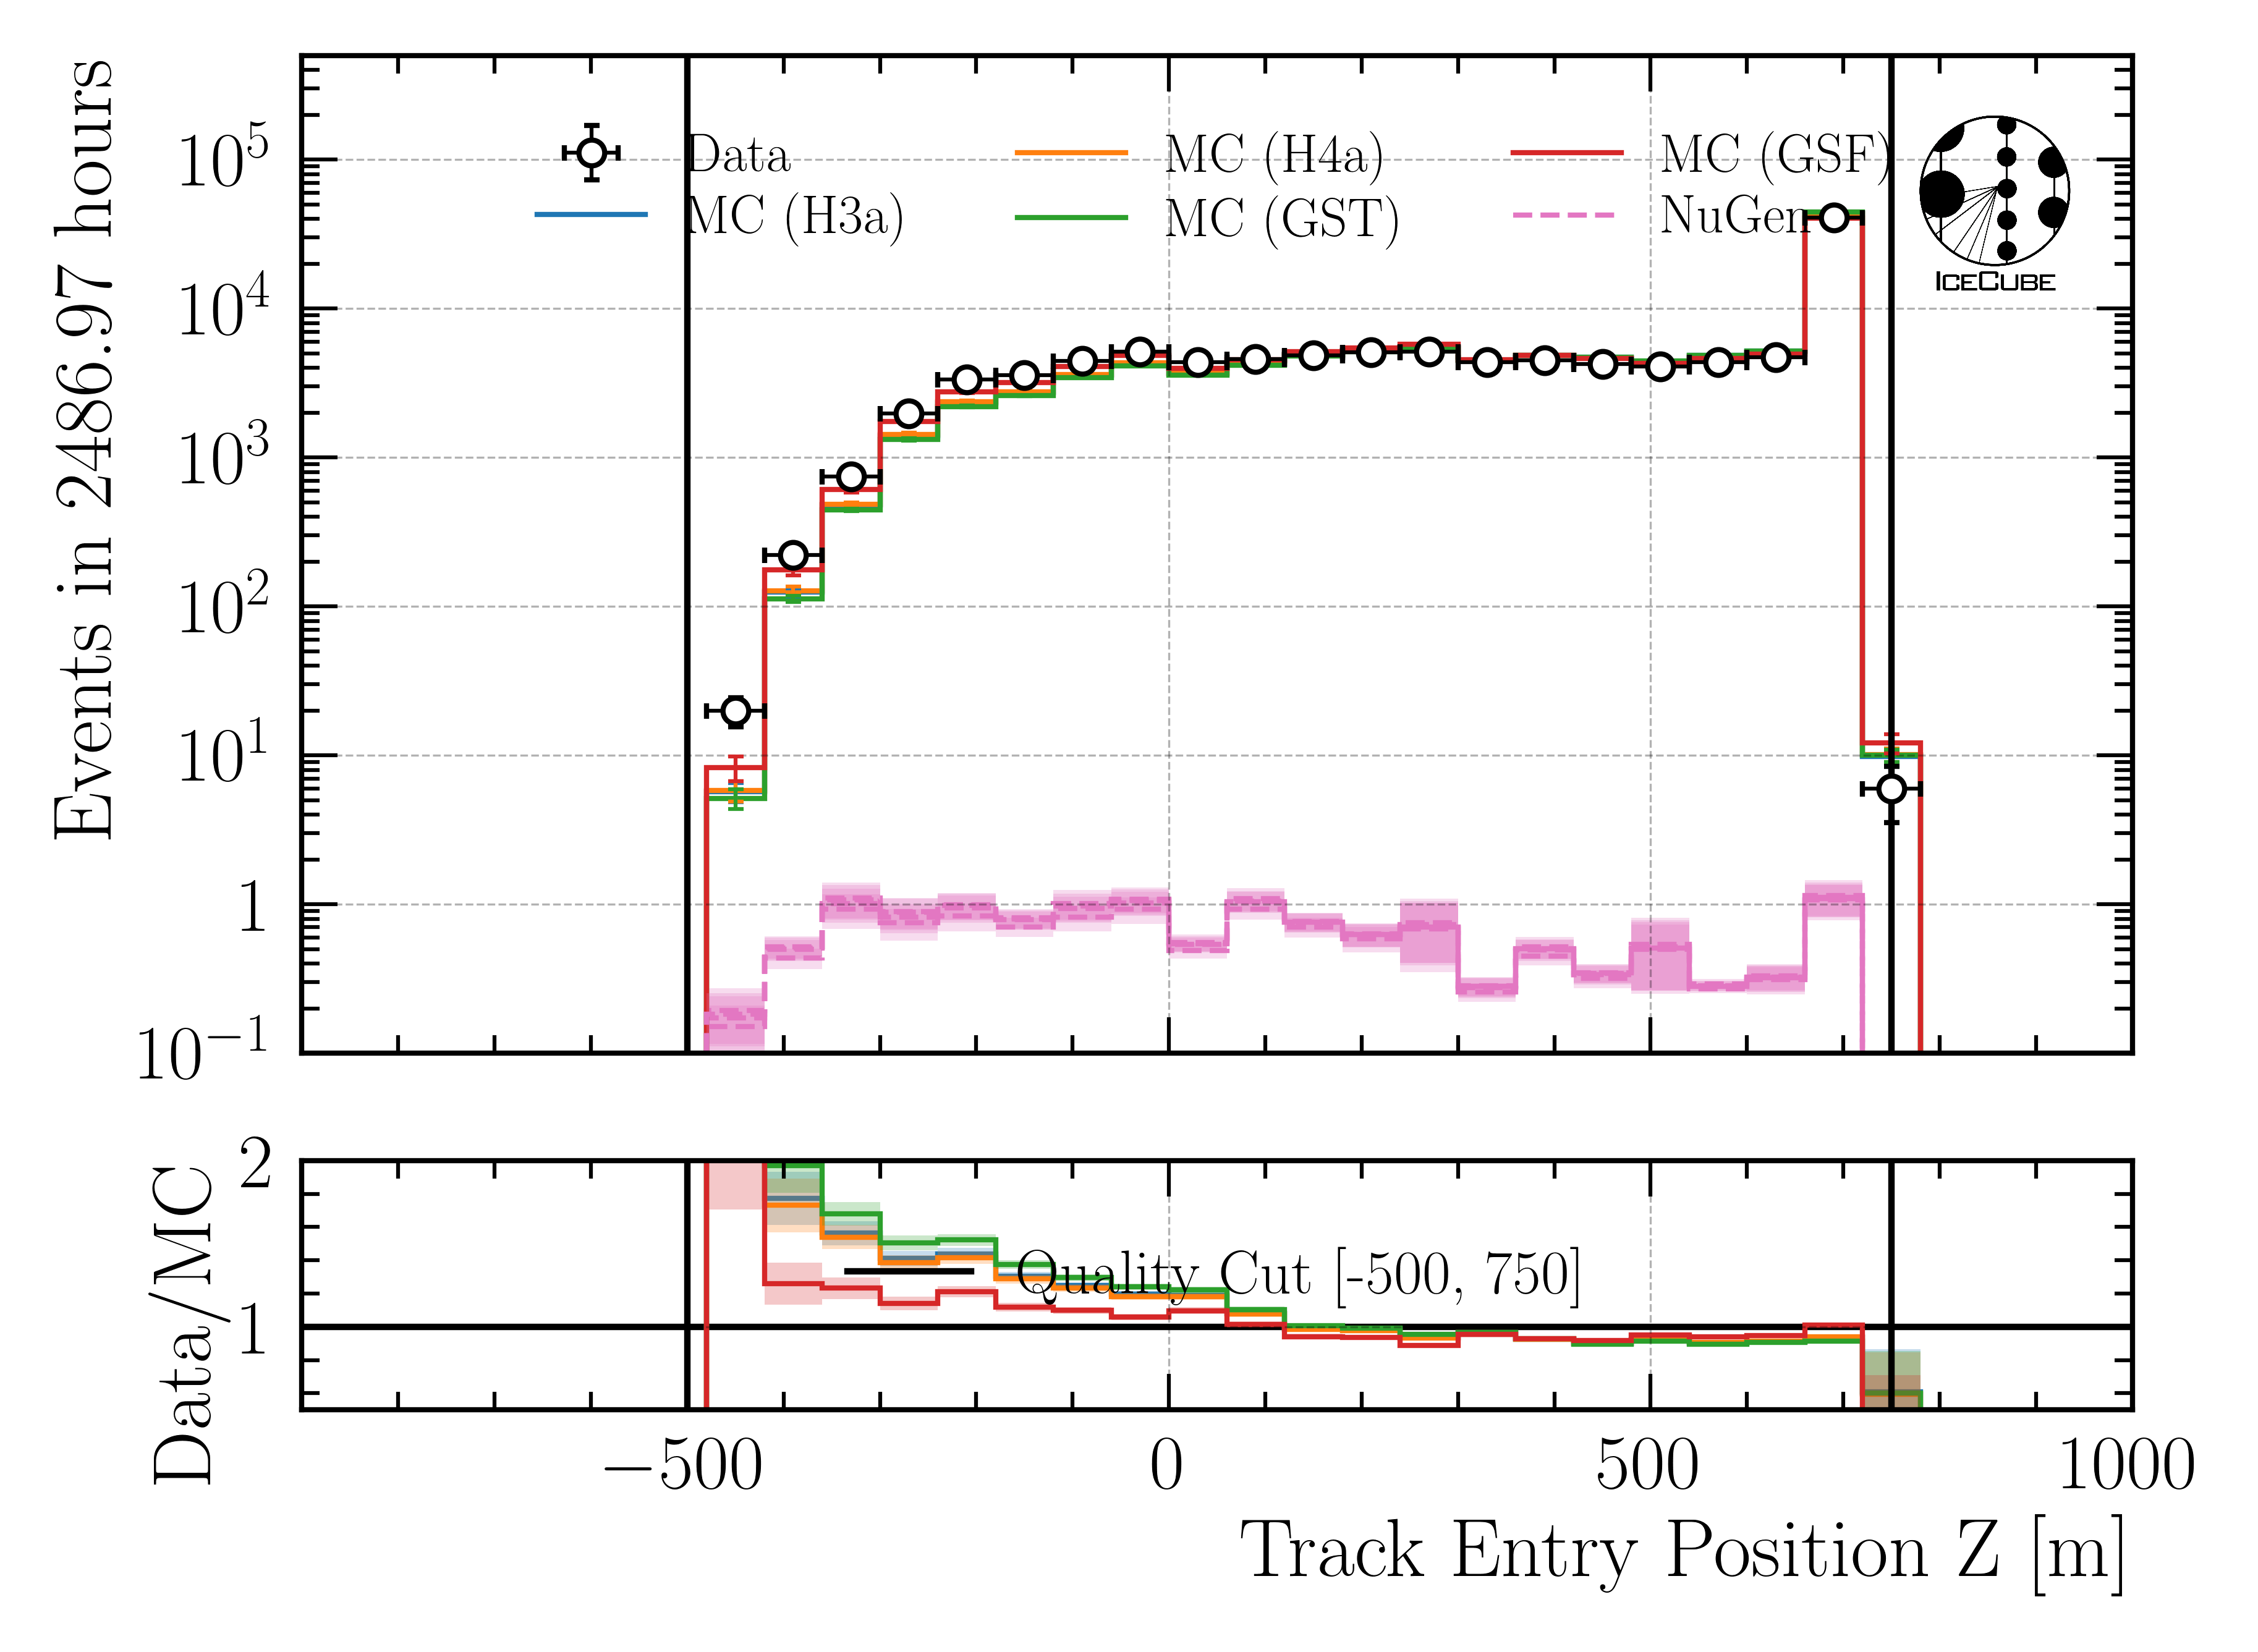
Fig. 125 : Entry position z reconstructed by DeepLearningReco_track_geometry_9inputs_6ms_medium_01.
Position z - uncertainty
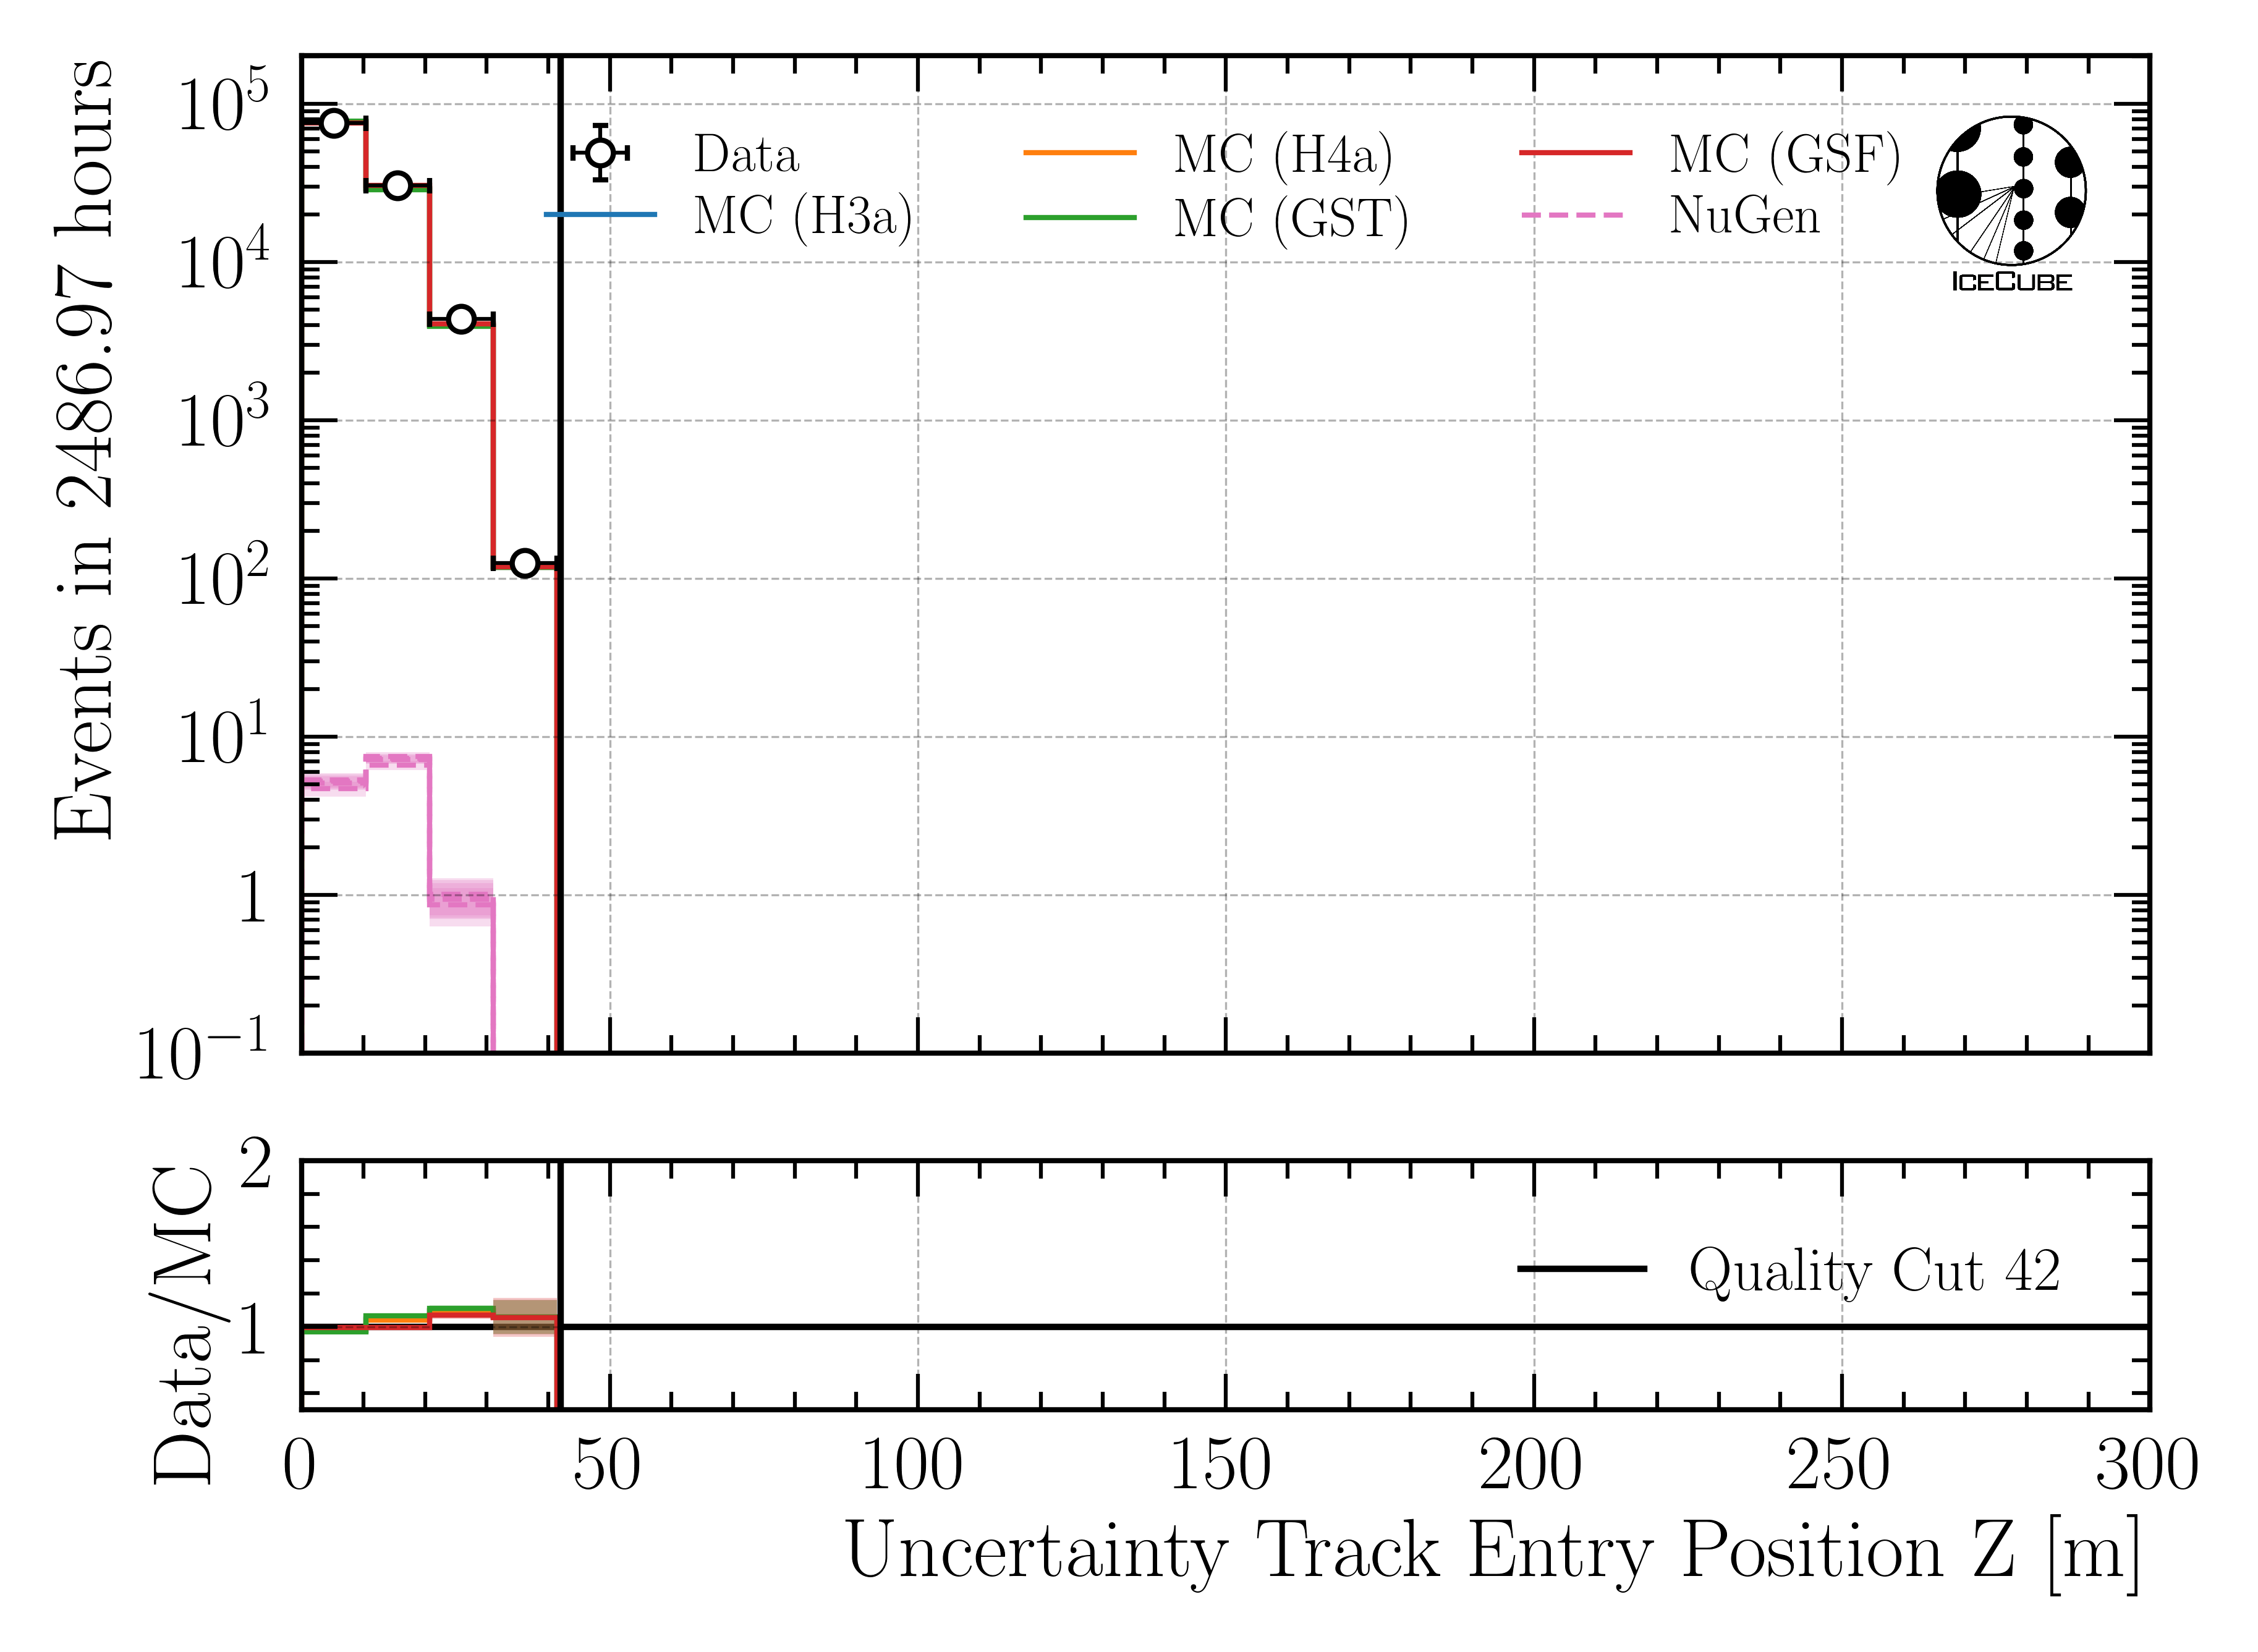
Fig. 126 : Uncertainty of entry position z reconstructed by DeepLearningReco_track_geometry_9inputs_6ms_medium_01.
Propagation length
Total propagation length
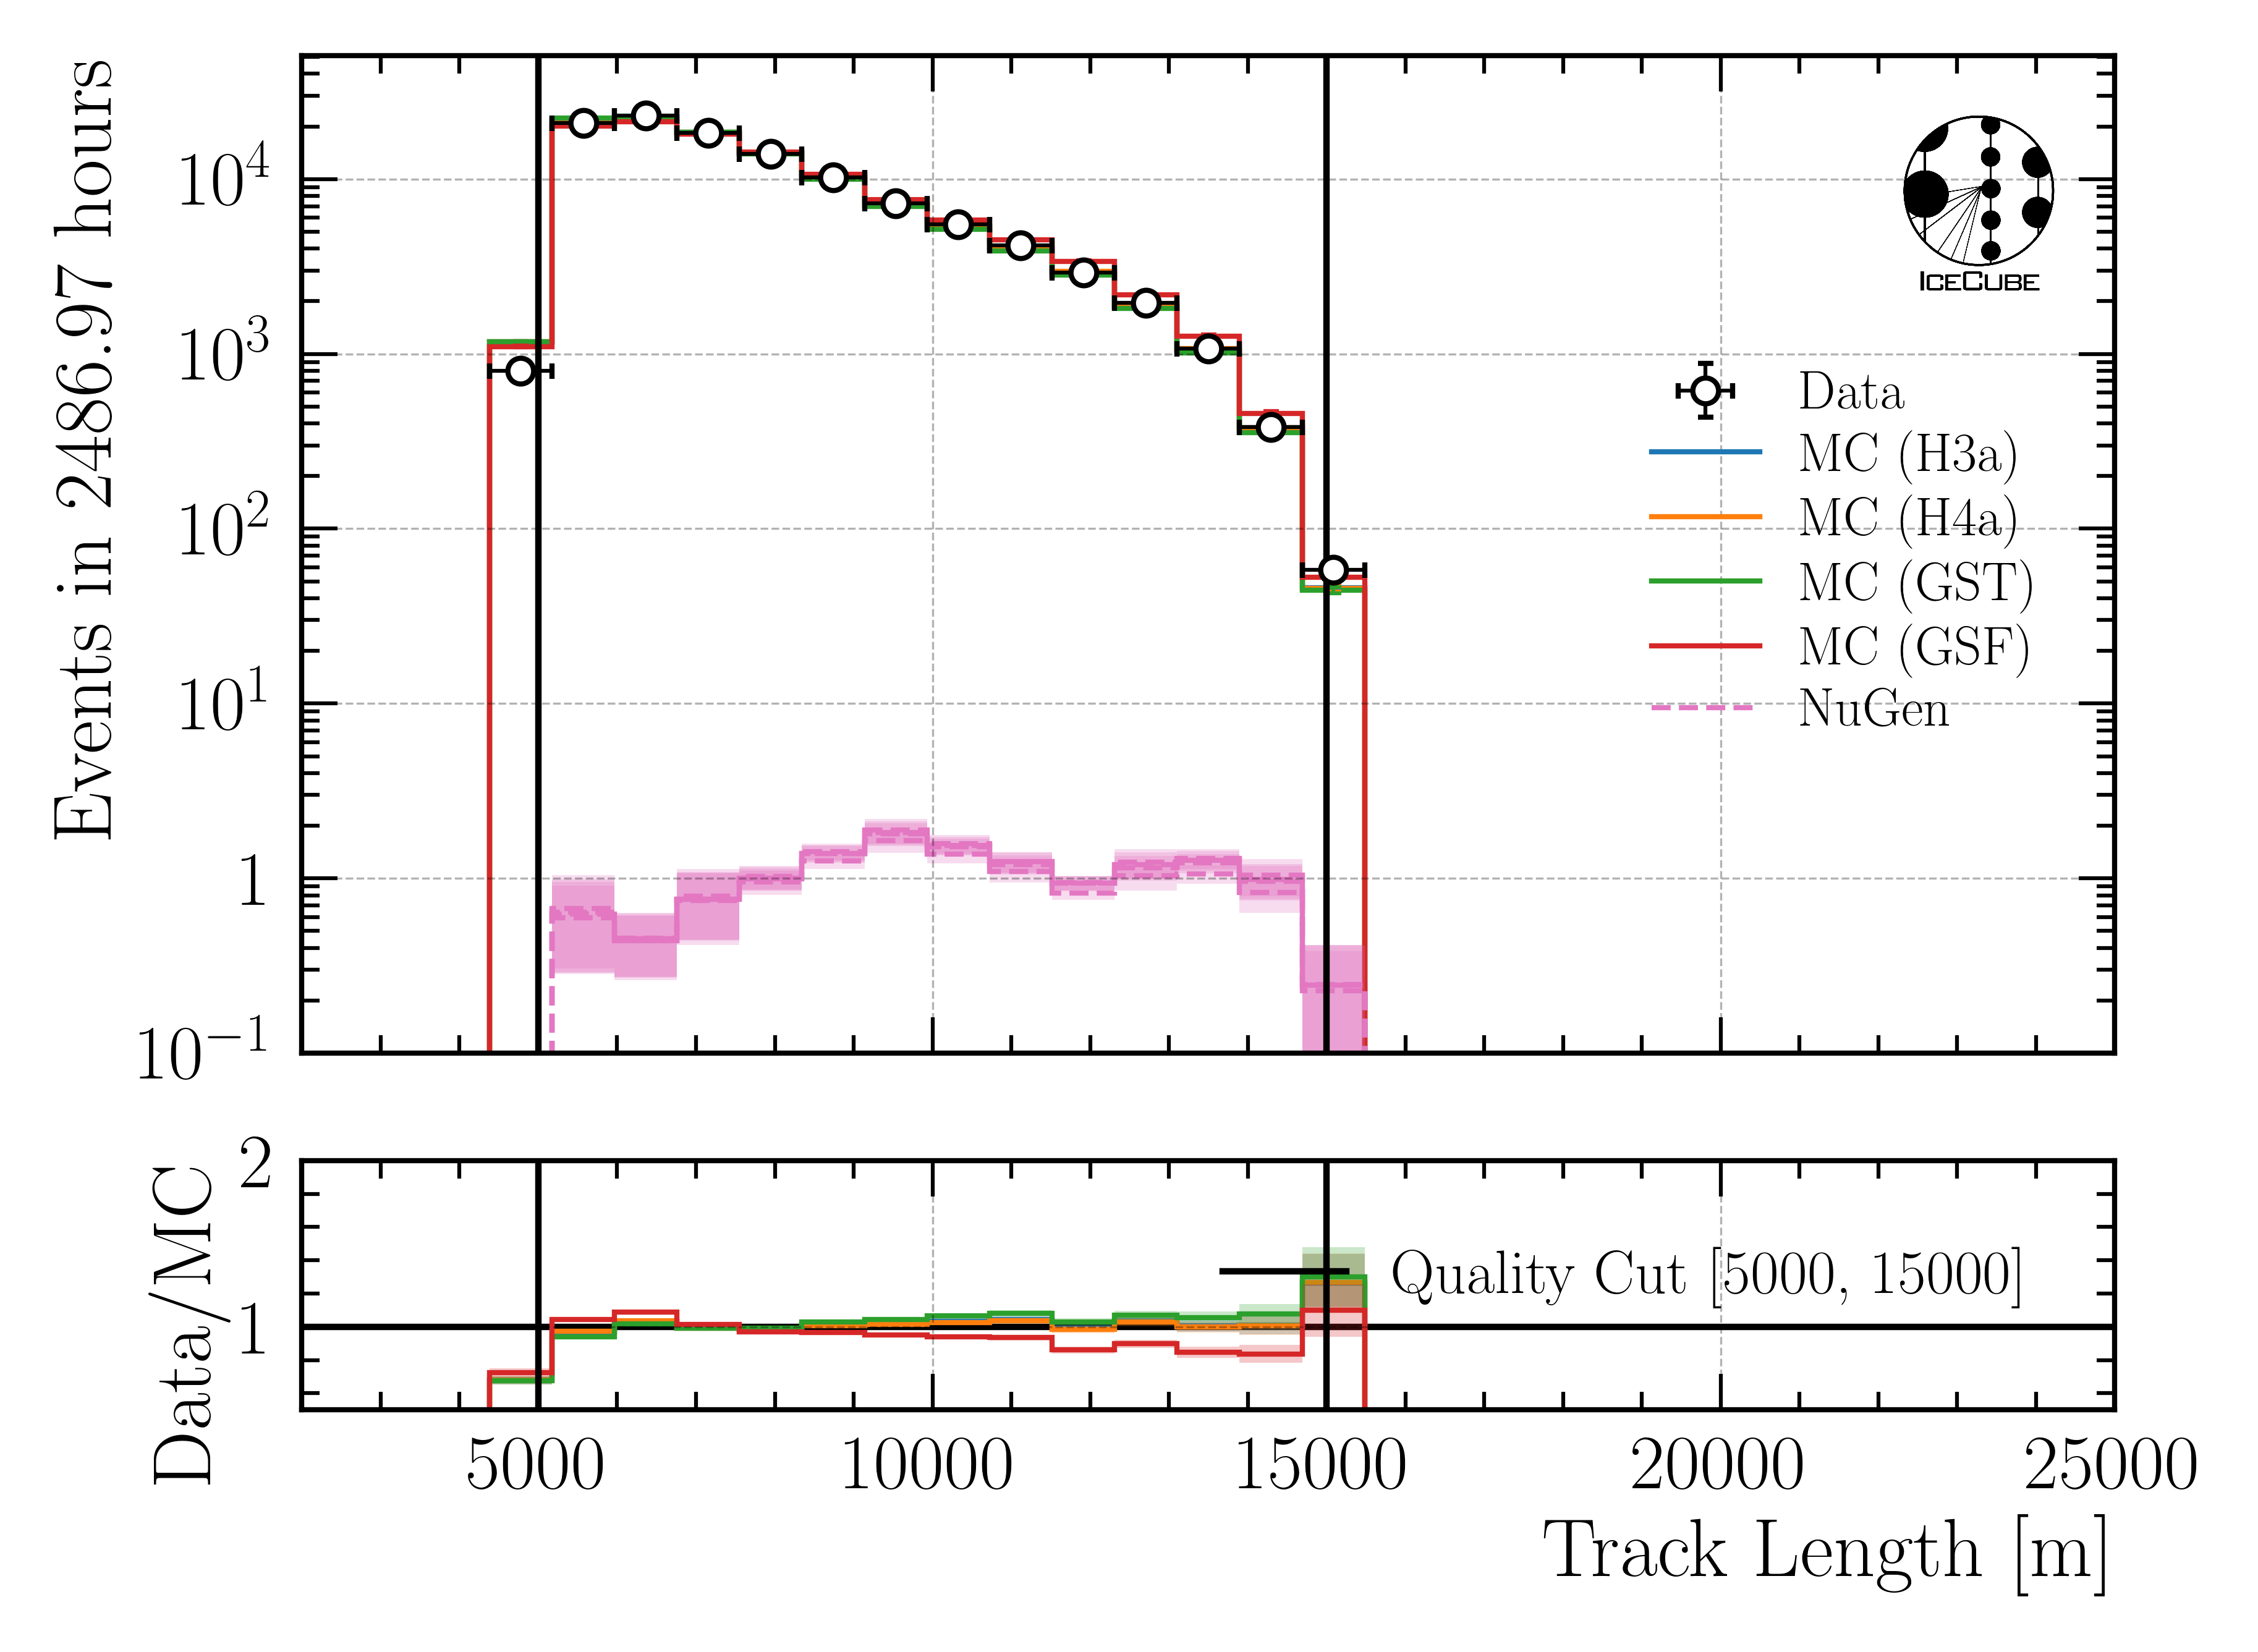
Fig. 127 : Propagation length reconstructed by DeepLearningReco_track_geometry_9inputs_6ms_medium_01.
Length in detector
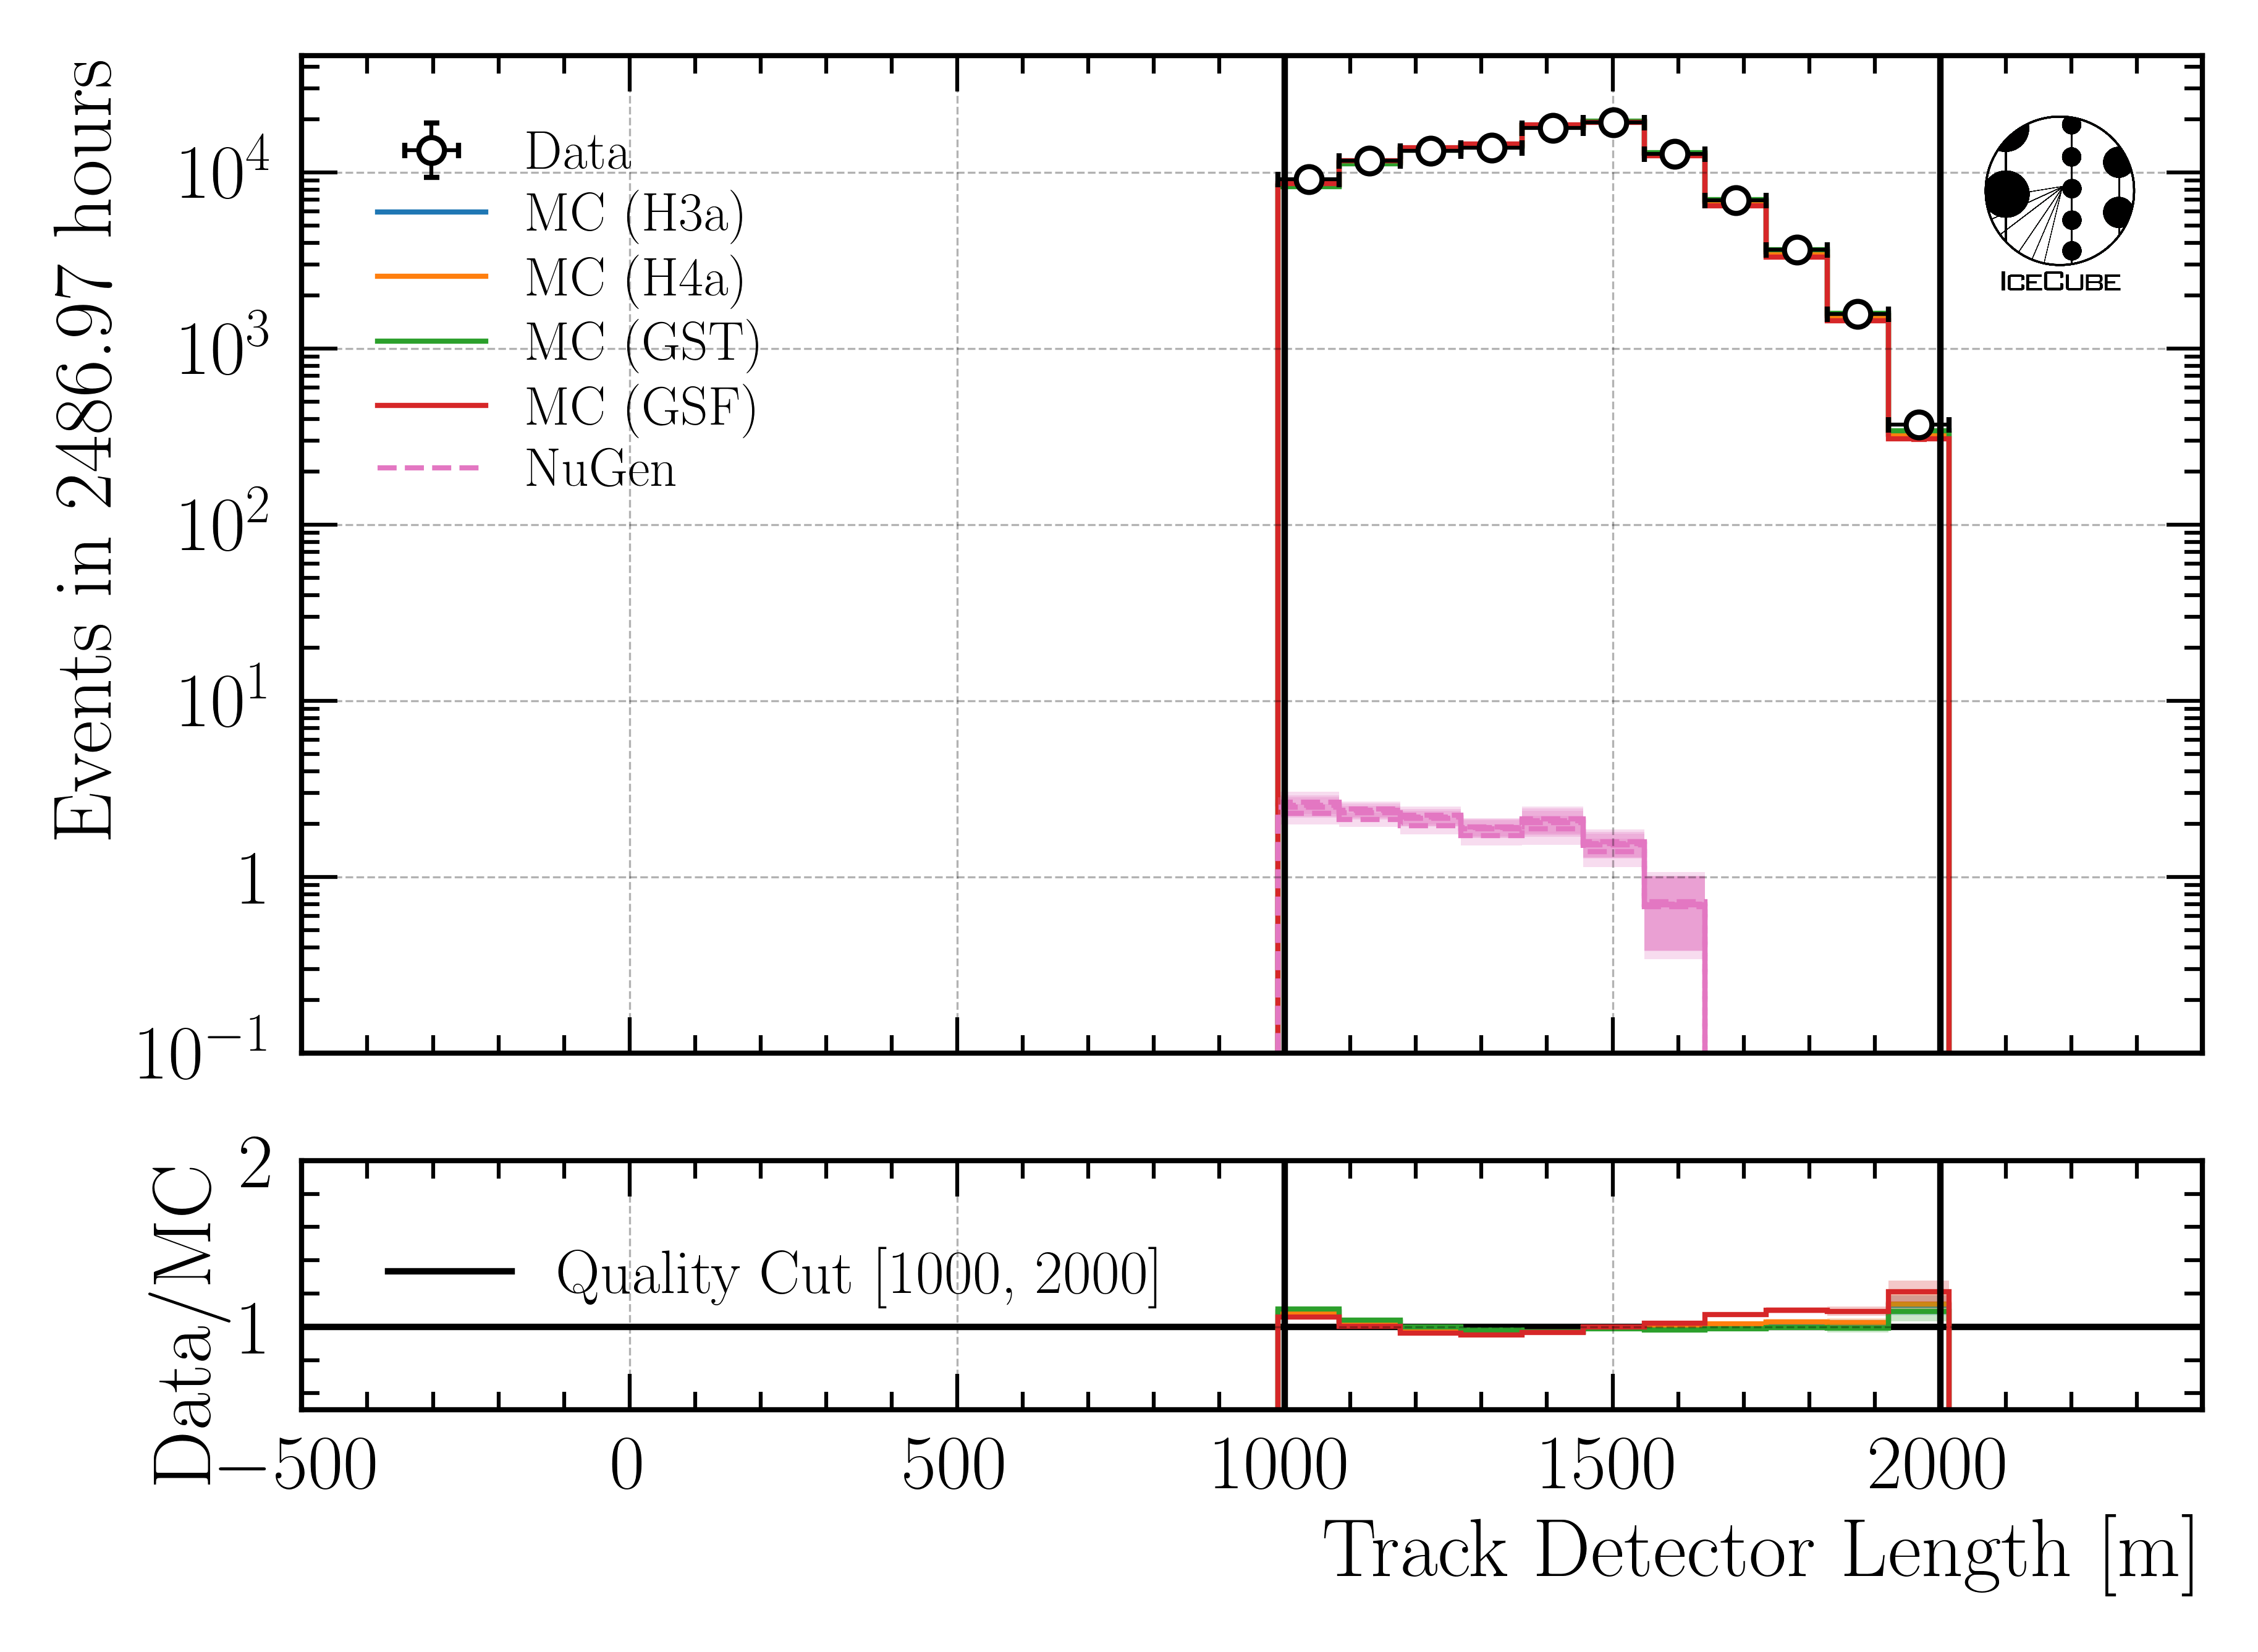
Fig. 128 : Length in detector reconstructed by DeepLearningReco_track_geometry_9inputs_6ms_medium_01.
Total propagation length - uncertainty
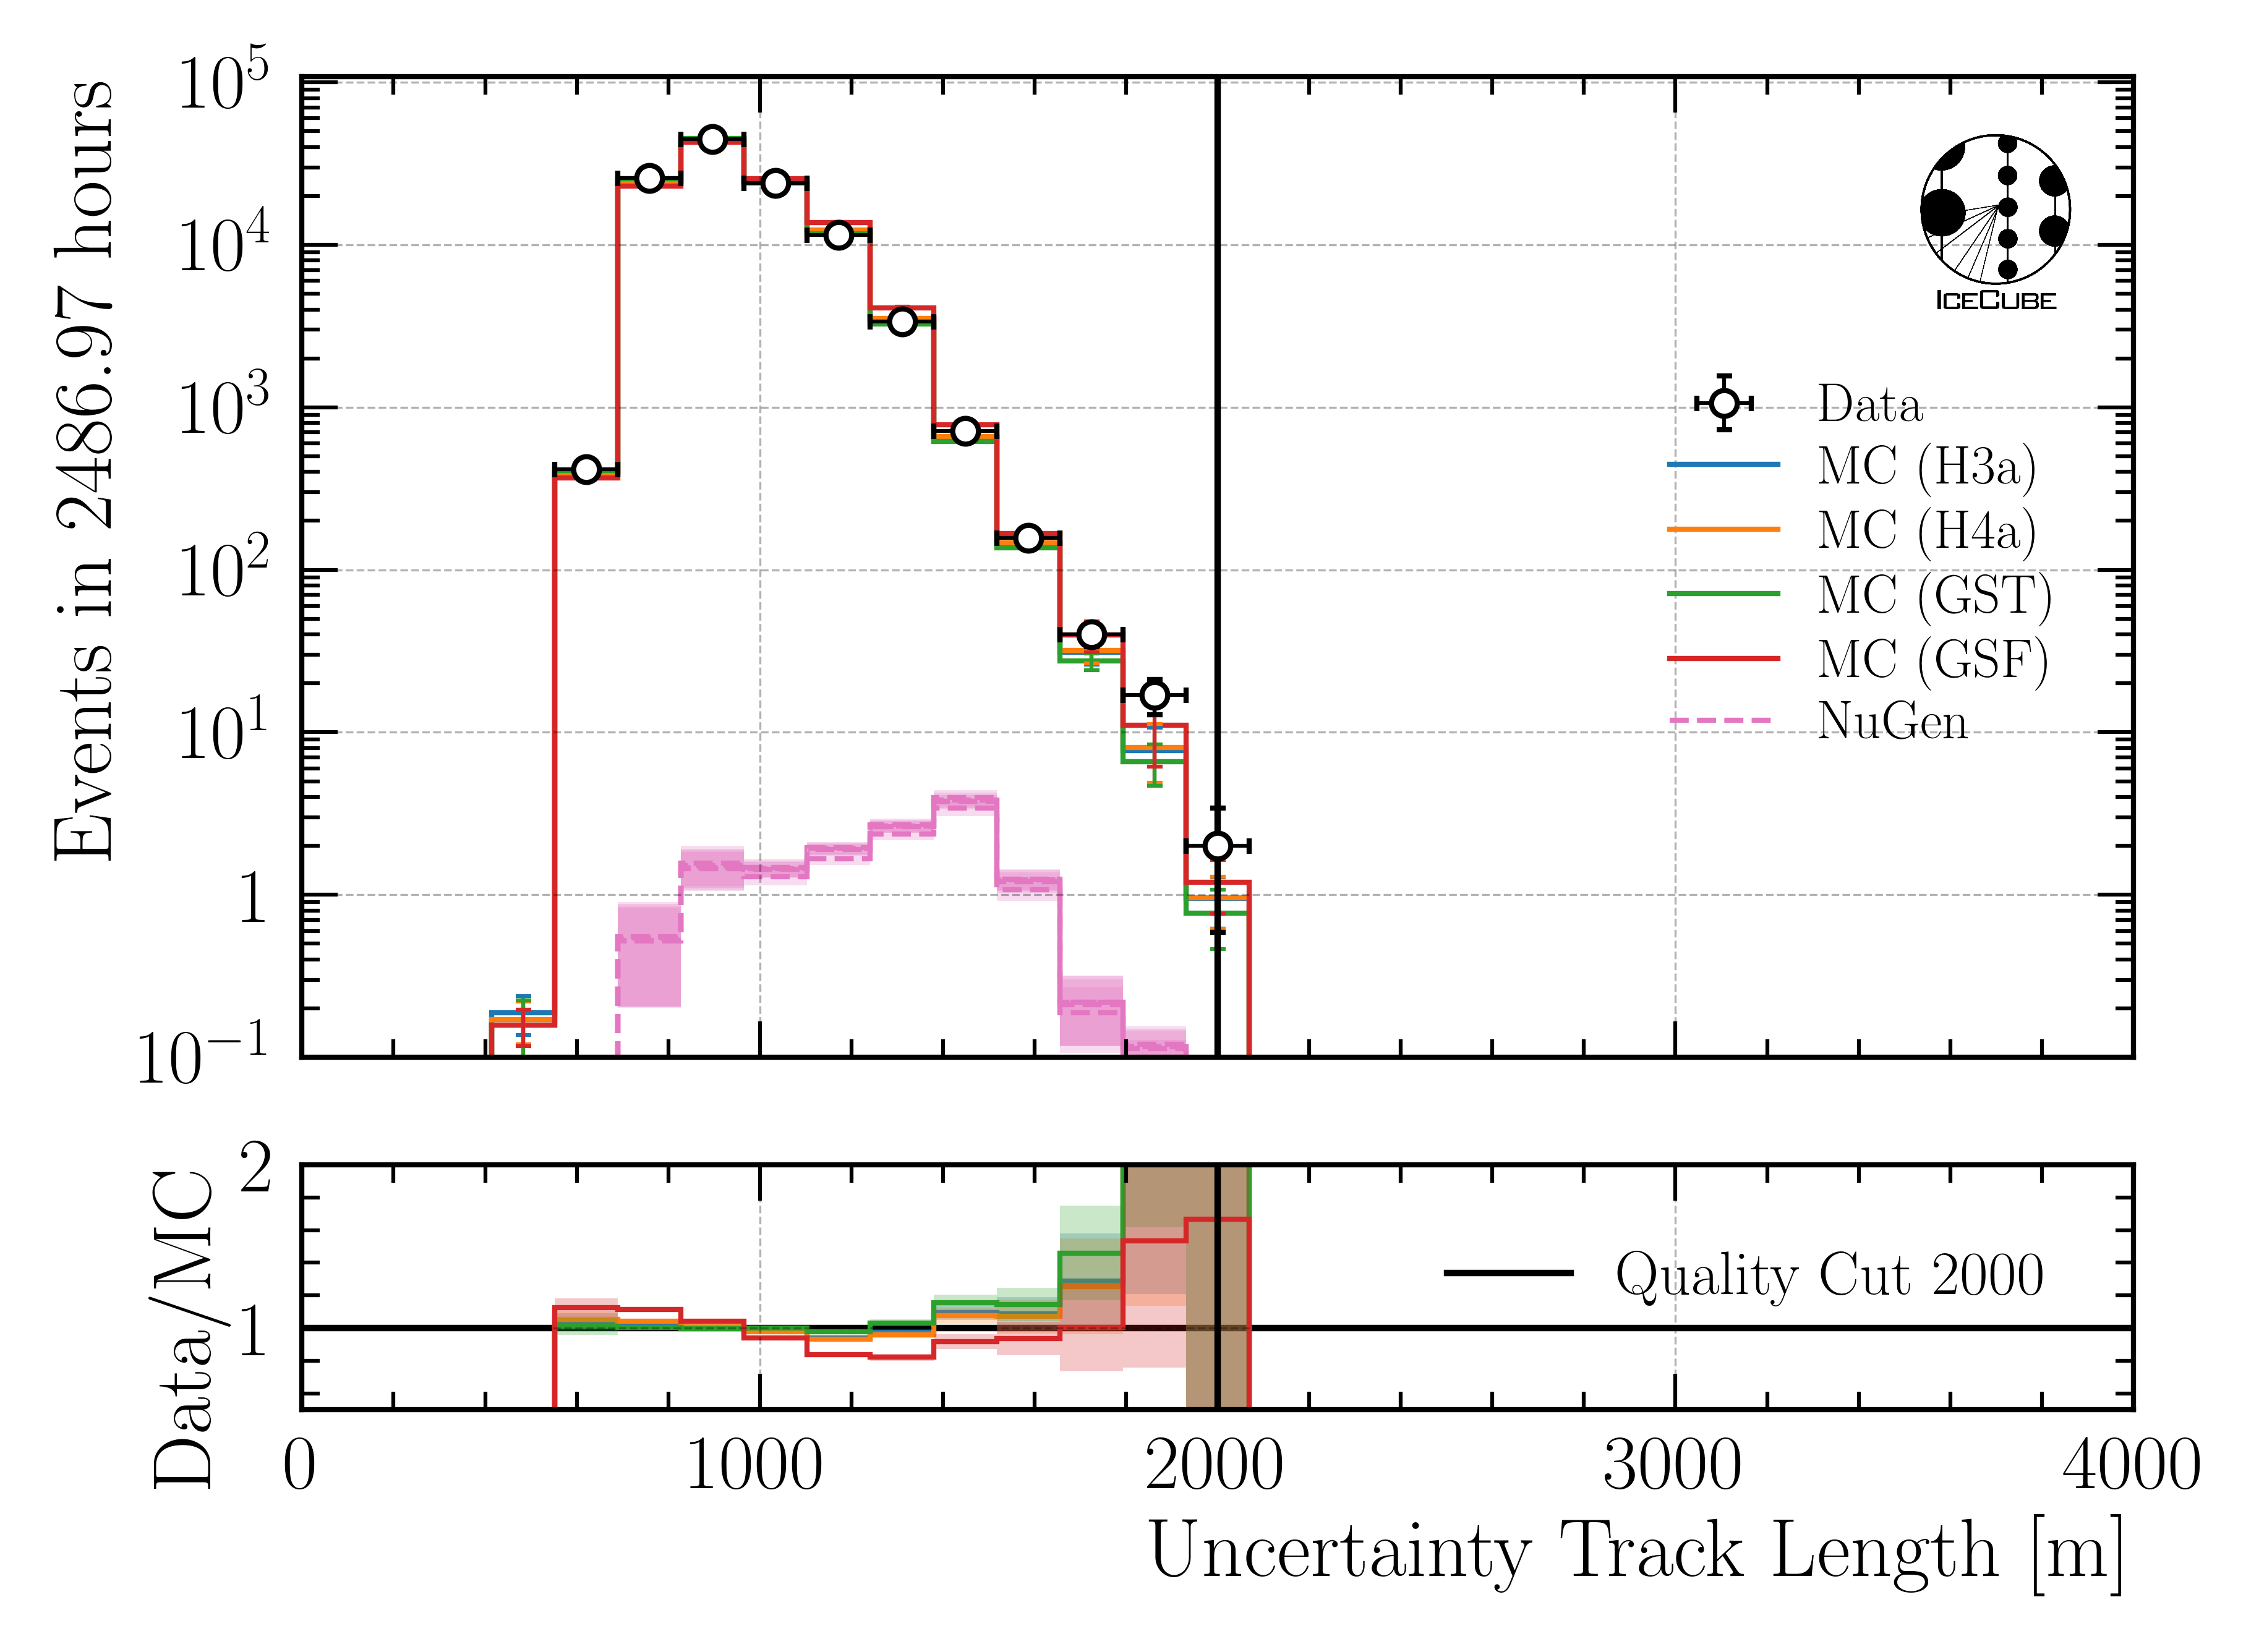
Fig. 129 : Uncertainty of propagation length reconstructed by DeepLearningReco_track_geometry_9inputs_6ms_medium_01.
Length in detector - uncertainty
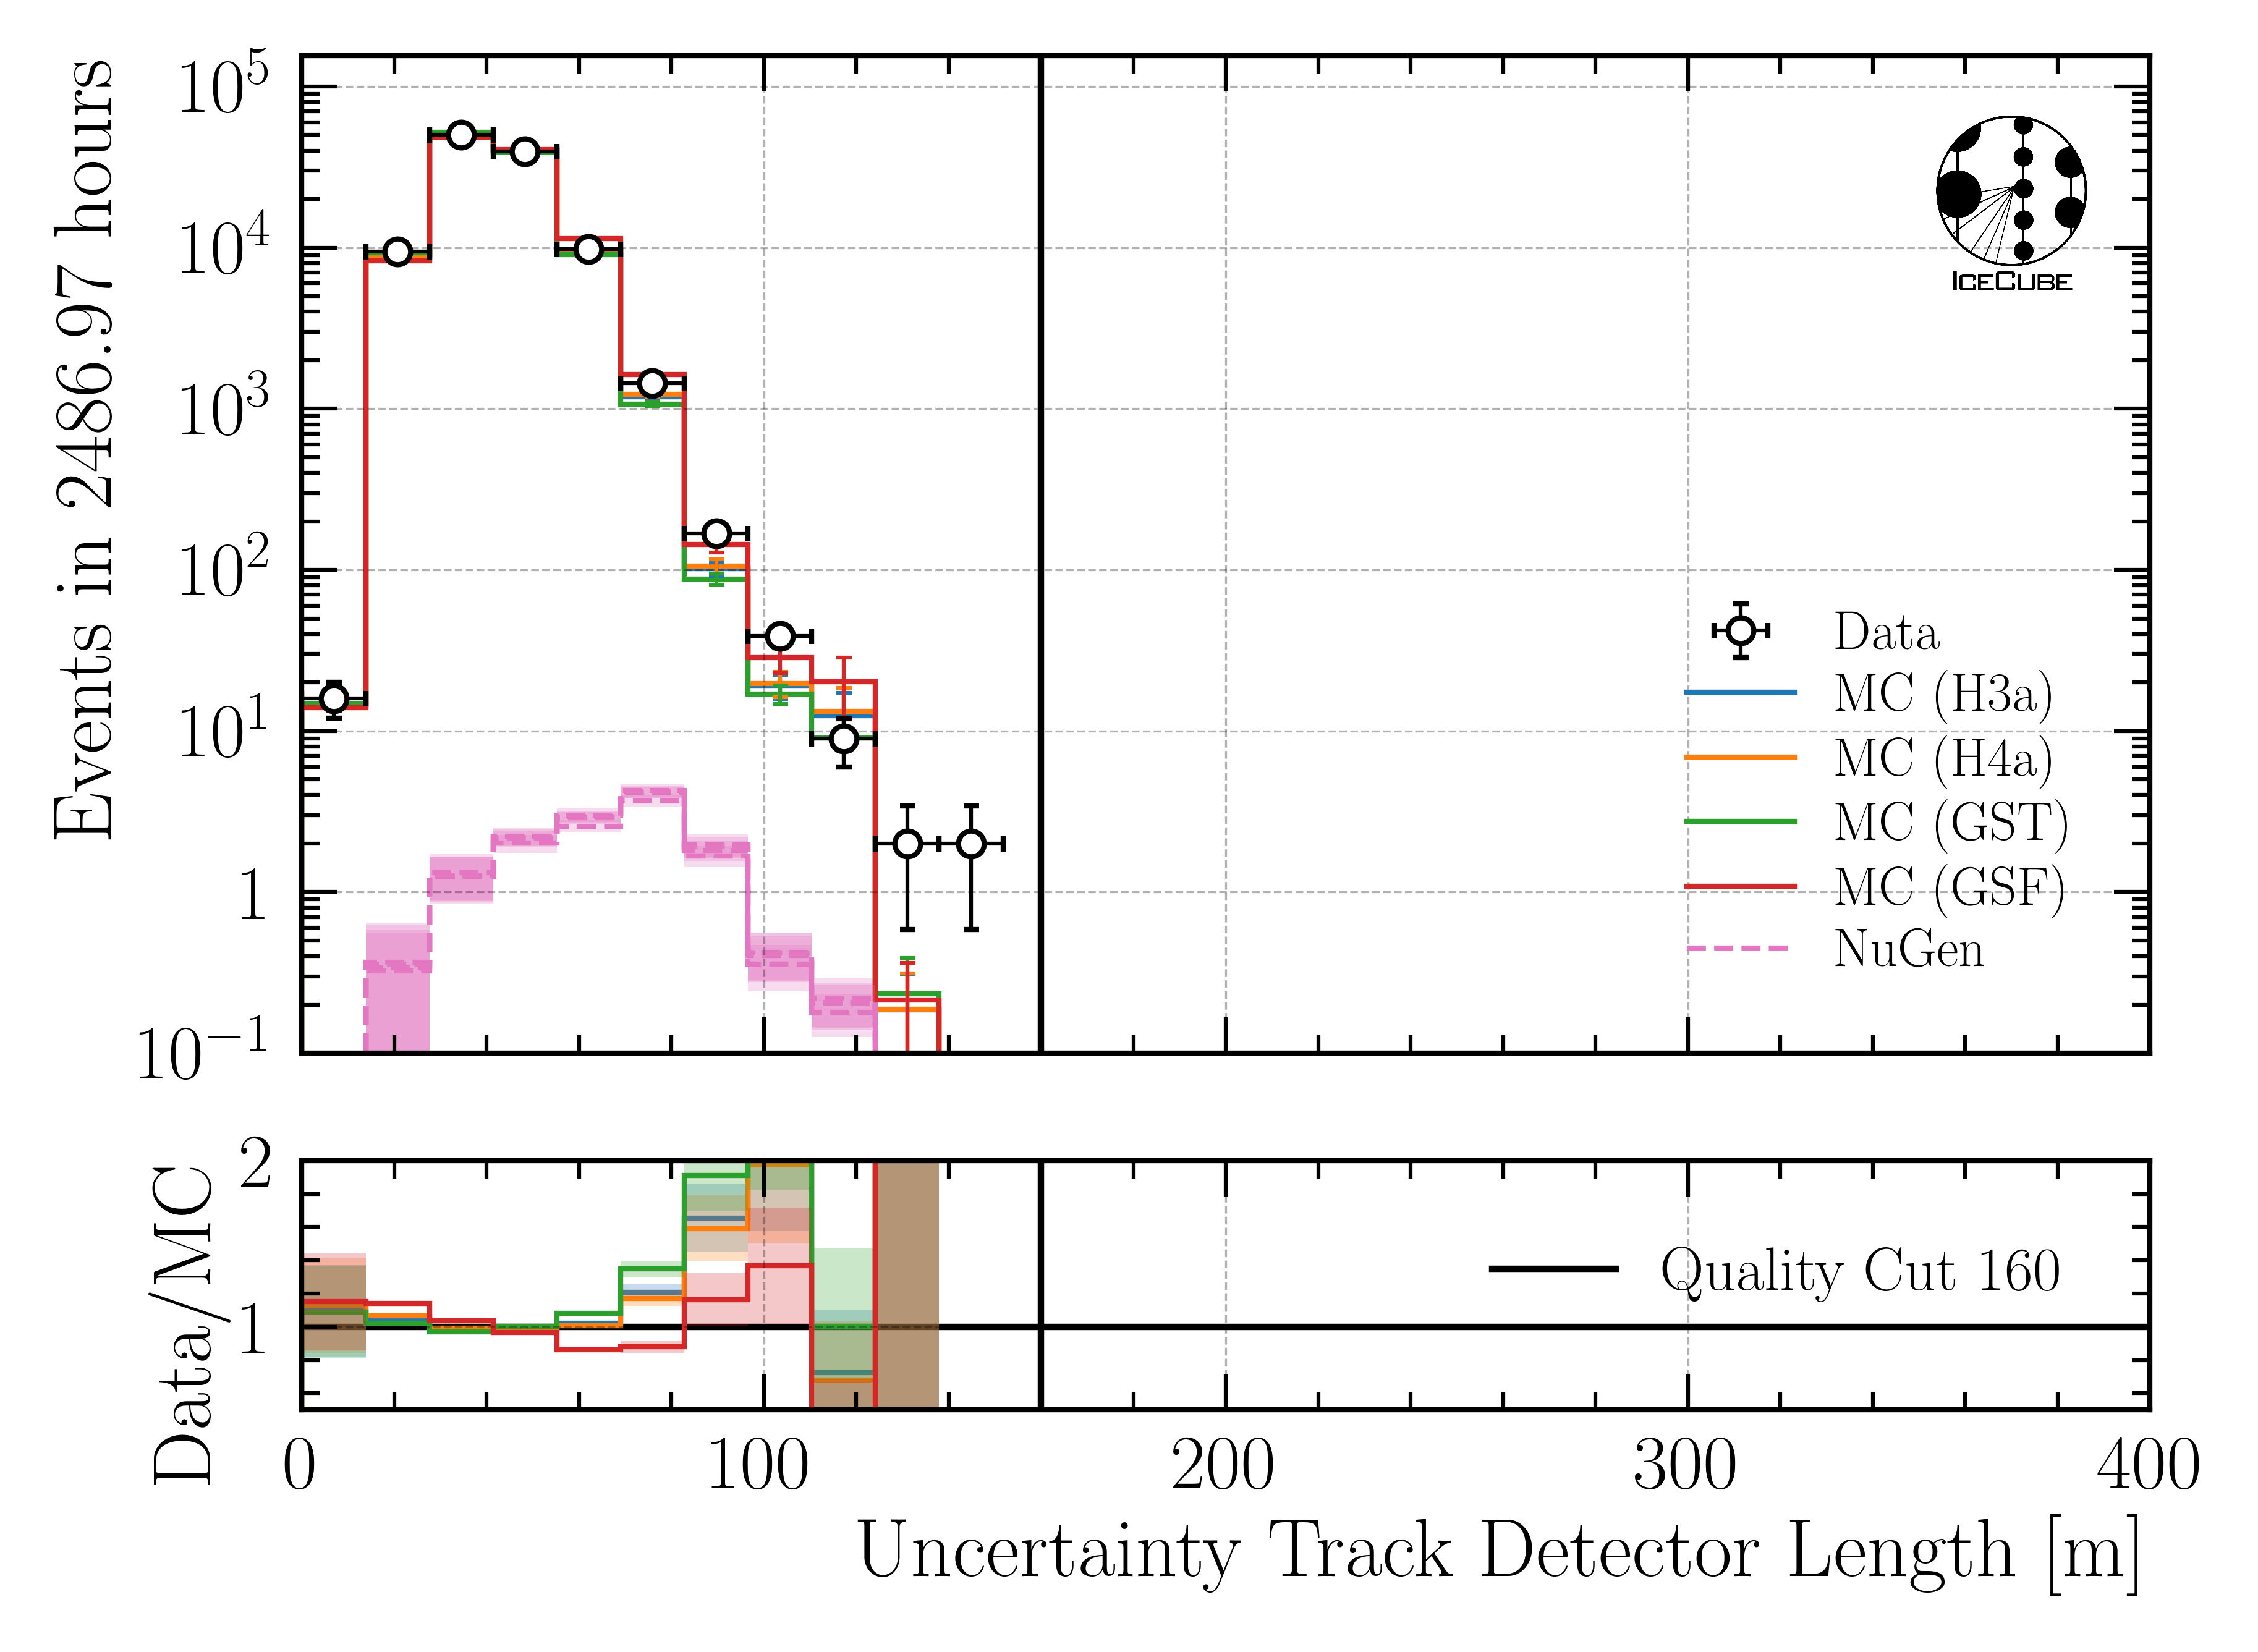
Fig. 130 : Uncertainty of length in detector reconstructed by DeepLearningReco_track_geometry_9inputs_6ms_medium_01.
Systematics
Detailed information about the systematics used for this analysis can be found here.
Further plots with all 4 primary models can be found in the Google docs here.
Note
In the following, the impact of the ice systematics is investigated for three different properties: the bundle energy at entry, the cos(zenith) and the z-vertex. However, these variables are not used for the unfolding, and thus they are negligible for the analysis. They are presented here to visualize the impact of the ice systematics on different variables at this selection stage, level 5.
Bundle energy at entry

Fig. 131 : Absorption effect on bundle energy at entry reconstructed by DeepLearningReco_leading_bundle_surface_leading_bundle_energy_OC_inputs9_6ms_large_log_02.

Fig. 132 : DOM efficiency effect on bundle energy at entry reconstructed by DeepLearningReco_leading_bundle_surface_leading_bundle_energy_OC_inputs9_6ms_large_log_02.

Fig. 133 : Hole ice forward unified p0 effect on bundle energy at entry reconstructed by DeepLearningReco_leading_bundle_surface_leading_bundle_energy_OC_inputs9_6ms_large_log_02.

Fig. 134 : Hole ice forward unified p1 effect on bundle energy at entry reconstructed by DeepLearningReco_leading_bundle_surface_leading_bundle_energy_OC_inputs9_6ms_large_log_02.

Fig. 135 : Scattering effect on bundle energy at entry reconstructed by DeepLearningReco_leading_bundle_surface_leading_bundle_energy_OC_inputs9_6ms_large_log_02.
Cosine zenith

Fig. 136 : Absorption effect on cosine zenith reconstructed by DeepLearningReco_direction_9inputs_6ms_medium_02_03.

Fig. 137 : DOM efficiency effect on cosine zenith reconstructed by DeepLearningReco_direction_9inputs_6ms_medium_02_03.

Fig. 138 : Hole ice forward unified p0 effect on cosine zenith reconstructed by DeepLearningReco_direction_9inputs_6ms_medium_02_03.

Fig. 139 : Hole ice forward unified p1 effect on cosine zenith reconstructed by DeepLearningReco_direction_9inputs_6ms_medium_02_03.
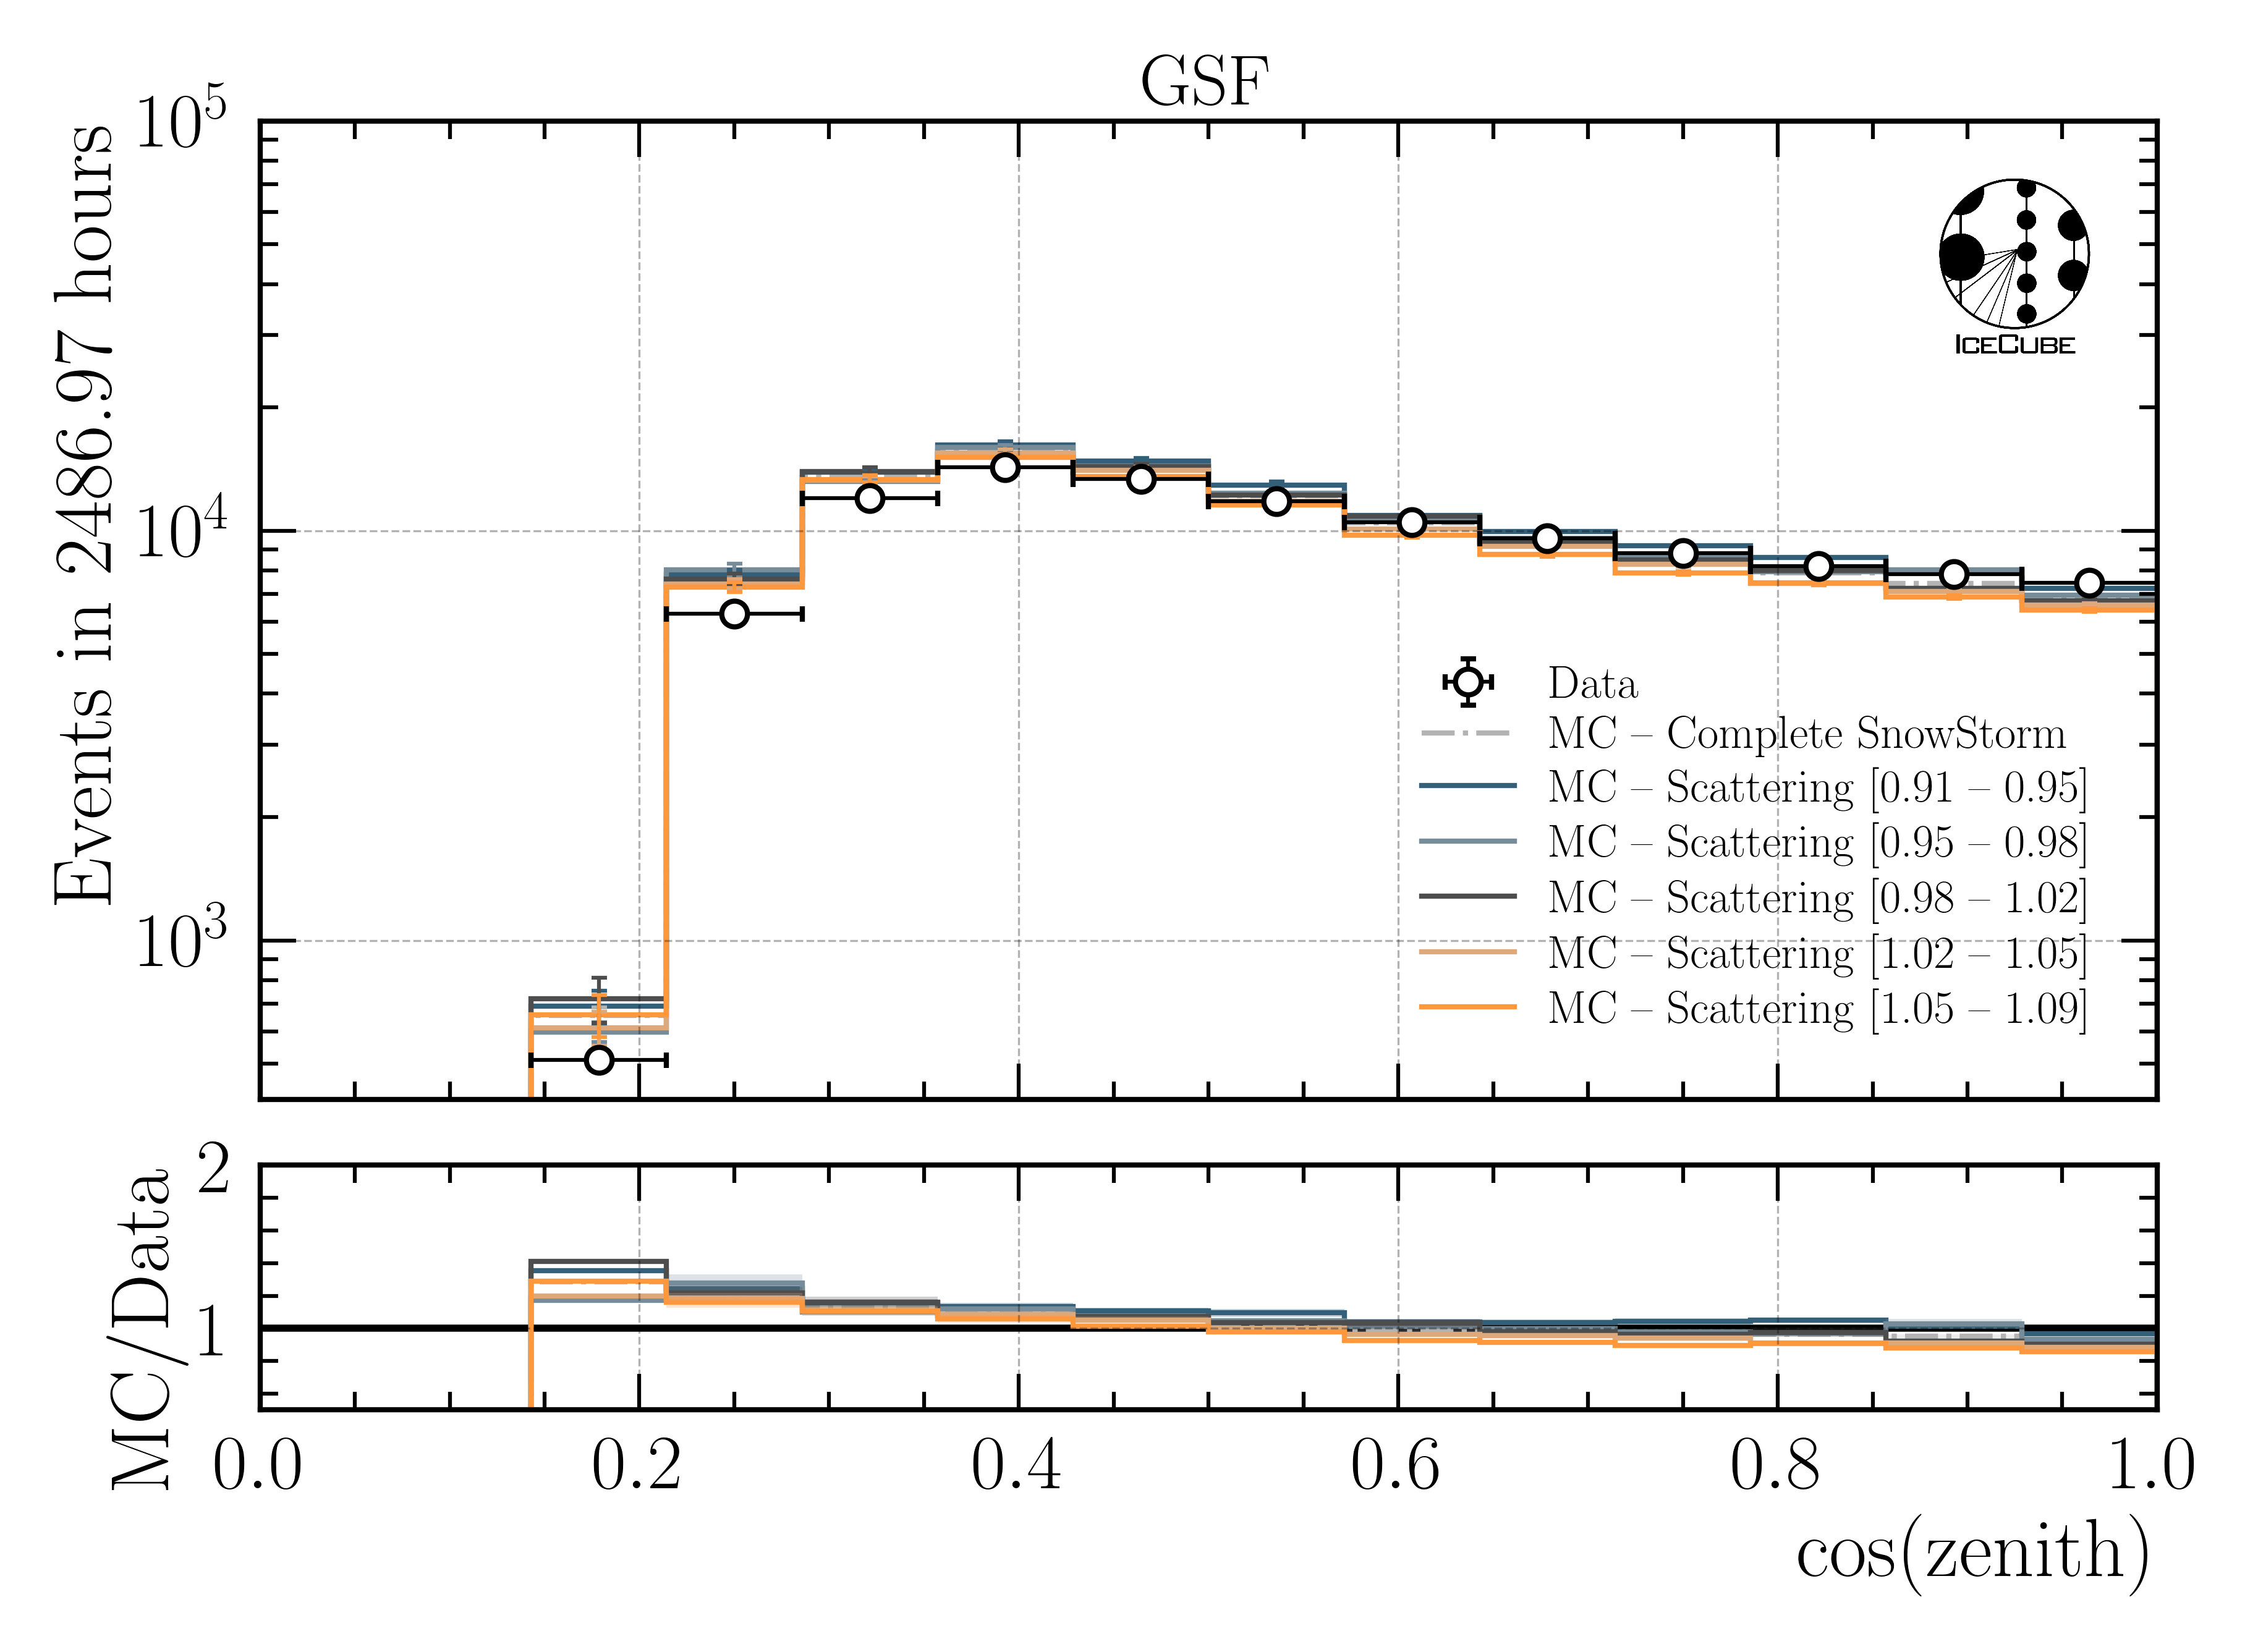
Fig. 140 : Scattering effect on cosine zenith reconstructed by DeepLearningReco_direction_9inputs_6ms_medium_02_03.
Center position z

Fig. 141 : Absorption effect on center position z reconstructed by DeepLearningReco_track_geometry_9inputs_6ms_medium_01.

Fig. 142 : DOM efficiency effect on center position z reconstructed by DeepLearningReco_track_geometry_9inputs_6ms_medium_01.

Fig. 143 : Hole ice forward unified p0 effect on center position z reconstructed by DeepLearningReco_track_geometry_9inputs_6ms_medium_01.

Fig. 144 : Hole ice forward unified p1 effect on center position z reconstructed by DeepLearningReco_track_geometry_9inputs_6ms_medium_01.

Fig. 145 : Scattering effect on center position z reconstructed by DeepLearningReco_track_geometry_9inputs_6ms_medium_01.